


Services on Demand
Journal
Article
 text in
  English (pdf)
 Article in xml format
 Article references
 Send this article by e-mail
Indicators
-
 Cited by SciELO
 -
 Access statistics
Related links
-
 Similars in
SciELO
Similars in
SciELO
Share

 Permalink
Revista mexicana de ciencias forestales
Print version ISSN 2007-1132
Rev. mex. de cienc. forestales vol.11 n.58 México Mar./Apr. 2020 Epub June 17, 2020
https://doi.org/10.29298/rmcf.v11i58.594
Scientific article
Critical nutrient concentrations and DRIS norms for mid-rotation Cedrela odorata L. trees
1 Posgrado en Ciencias Forestales, Colegio de Postgraduados, Campus Montecillo. México.
2 Posgrado en Edafología, Colegio de Postgraduados, Campus Montecillo. México.
Nutrient diagnosis helps increase fertilizer use efficiency in forest plantations as well as economic profits and ecological benefits. Two of the methods commonly used for diagnosis of the nutrient status are critical nutrient concentrations and the Diagnosis and Recommendation Integrated System (DRIS); however, no studies exist that show the critical values or DRIS norms for Cedrela odorata (red cedar); which is an important tropical tree species. The aim of the present study was to develop a set of critical nutrient concentrations and a set of DRIS norms as well, for C. odorata at the mid-rotation stage. The study was carried out by selecting 74 trees located over the species natural distribution area in Mexico, on which diameter increment and nutrient concentration was recorded from July 2017 to January 2018. A set of critical nutrient concentrations and one more of DRIS norms were developed. In a second phase of the study, both nutrient standards were verified by using an experiment installed within a red cedar mid-rotation plantation. The experimental design was a complete randomized, with a 3×4 factorial arrangement of treatments, where the factors corresponded to the application of P and K, respectively. A set of critical nutrient concentrations and a set of DRIS norms for C. odorata at its mid-rotation stage are exhibited in this paper. The verification process indicates that both reference sets correctly predict nutrient status of mid-rotation red cedar trees.
Key words Red cedar; nutrient diagnosis; fertilization; forest nutrition; nutrients; Diagnosis and Recommendation Integrated System
El diagnóstico nutrimental ayuda a mejorar la eficiencia del uso de fertilizantes en plantaciones forestales y a incrementar tanto las utilidades económicas, como los beneficios ecológicos. Dos métodos comúnmente usados, para tal efecto, son las concentraciones críticas y el Sistema Integrado de Diagnóstico y Recomendación (DRIS); sin embargo, no existen estudios que aporten los valores críticos o normas DRIS para Cedrela odorata (cedro rojo), especie importante en las regiones tropicales. El objetivo del presente estudio fue desarrollar un conjunto de concentraciones críticas y uno de normas DRIS para C. odorata en su etapa de medio turno. El estudio se realizó con 74 árboles localizados a lo largo del área de distribución natural del taxon en México, a los cuales se les determinó el incremento diamétrico y la concentración nutrimental entre julio de 2017 y enero de 2018. Se derivó un conjunto de concentraciones críticas y uno de normas DRIS. Una segunda fase fue la verificación de las concentraciones críticas y normas DRIS generadas, mediante un experimento en una plantación de cedro rojo de medio turno. El ensayo fue completamente al azar con arreglo factorial 3 × 4, en el que los factores correspondieron a la aplicación de P y K, respectivamente. Se presenta un conjunto de concentraciones críticas y uno de normas DRIS para árboles de C. odorata de medio turno. El proceso de verificación indica que ambos conjuntos de valores de referencia predicen correctamente el estado nutrimental de los árboles de medio turno del cedro rojo.
Palabras clave Cedro rojo; diagnóstico nutrimental; fertilización; nutrición forestal; nutrimento; Sistema Integrado de Diagnóstico y Recomendación
Introduction
Cedrela odorata L. is one of the most important forest species in the tropical and subtropical regions of Mexico and South America and is considered one of the most valuable in the world in the commercial field (Russell et al., 1993; Semarnat, 2016), by the properties and aesthetic characteristics of its wood, which is soft, has a pleasant aroma, and it is easy to work with for cabinetmakers. The beauty of its wood is synonymous of quality and good taste. Once dry, it is resistant to insect attack (Brown and Pacheco, 2006). Together with Swietenia macrophylla King, Tectona grandis L. f. and Eucalyptus sp., it is included among the most commercially planted forest species in Mexico (Ramírez et al., 2013). It is grown intensively in the tropics of the American continent, and naturally in rainforests (Muellner et al., 2009).
In the national market, the demand for red cedar is of great relevance and the supply is insufficient due, partially, to the low productivity of the species in natural conditions or even in plantations. The productivity of forest species can be increased by the addition of fertilizers, if deficient nutrients are applied at the site. However, to define such deficiency in each case, it is necessary to carry out a diagnosis of trees in that sense or of soil fertility.
Critical concentrations and the Diagnosis and Recommendation Integrated System (DRIS) are two of the most commonly used techniques for the nutritional diagnosis of forest species. These methodologies have given good results in commercial plantations and natural forests (Moreno et al., 2002; Osiecka et al., 2019). Critical concentrations refer to foliar concentrations of nutrients, with which a performance between 90 and 100 % is obtained with respect to the potential performance (Medina-Morales, 2004) and are particular for each forest species and for each nutrient; however, for C. odorata, the values are unknown.
The DRIS is a nutritional diagnostic system developed and tested by Beaufils and Sumner (1976), designed for particular forest species, and subsequently applied to multiple agricultural crops. It consists of a set of standards (means and coefficients of variation) corresponding to quotients between the nutrients of interest. Currently, there are sets of DRIS standards for few Mexican forest species and, despite the high demand for C. odorata wood, there are no such regulations for it, even if they are necessary to contribute to the design of programs oriented to its sustainable management. Therefore, in the present study a set of critical concentrations and one of DRIS standards for C. odorata were generated.
Materials and Methods
Sampling procedure
A targeted sampling was made by selecting a series of individual trees (74) and trying to cover most of the natural range of the species in Mexico (Pennington and Sarukhán, 1998; Conabio, 2017). Individual trees were finally established in the states of Veracruz, Puebla, Tabasco, Chiapas, Campeche, Quintana Roo and Yucatán. The selected individuals were healthy specimens, without mechanical damage, or bifurcations, dominant and codominant, free from excessive fruiting; they were placed in the diametric category of 15 to 19 cm initial or half-turn and in easily accessible places for later monitoring.
Assessed Variables
The evaluated response variable was the increase in normal diameter (diameter at 1.3 m above ground level, in an evaluation period of 7 months) and was calculated by subtracting the normal diameter measured in July 2017, to the normal diameter measured in January 2018, for each of the 74 trees.
The normal diameter was recorded with diametric tape (Forestry Suppliers 20FT) and its imprint on the circumference of the shaft was marked with indelible ink. The height of the tree was determined with a W-Germany Haga gun and the measurement method developed by López (2005). The geographical coordinates at the base of the tree were set with a Garmin Venture Cx GPS. Each tree was marked with the corresponding consecutive number, with glow-in- the-dark paint for later identification and re-measurement.
Tree Re-measurement
Seven months after the initial measurement of the trees, the same variables were repeated. In addition, a sample of 30 leaflet was collected from each tree as indicated by Wells and Allen (1985).
The collected leaflet were transported in containers (refrigerators) with ice to the Salvador Alcalde Blanco laboratory of the Colegio de Postgraduados, where the foliar concentration of N, P, K, Ca, Mg, B, Cu, Fe, Mn and Zn was determined for each tree. The N by the micro-Kjeldahl method, and the rest of the nutrients from a digestion with sulfuric, perchloric and nitric acids; an aliquot was taken from this digestate that was analyzed by an inductively coupled plasma spectrophotometer (ICP-AES) (VARIAN 725-ESI).
Data Analysis
Data were analyzed by using the methodology originally described by Beaufils and Sumner (1976), for the development of DRIS standards and critical concentrations (Walworth and Sumner, 1987). For the second type, the total of 74 observations was subdivided into two subgroups: high performance (16 %) and low performance (74 %) (Medina and Medina, 1992). Such concentrations for the species of interest at half-turn age corresponded to the means of each nutrient in the high performance trees. The DRIS standards consisted of the ratios of nutrient concentrations in the same subpopulation. Each quotient was determined by its mean and its coefficient of variation.
Description of the experimental plot
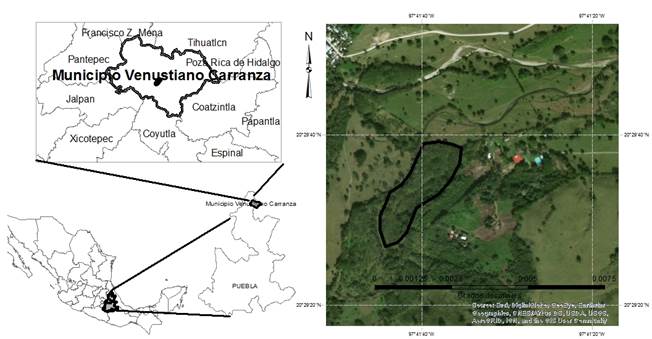
To validate the sets of critical concentrations and DRIS standards, a plantation of C. odorata with an area of seven ha was chosen (Figure 1). The plantation is 10 years old, it has a 4 × 3 m spacing, diametric categories between 15 and 20 cm, alluvial soil and a slope <5 %.
Diagnosis of the nutritional condition of the experimental plot
Based on the homogeneity of the experimental area (flat surface and even-aged trees), the initial nutritional diagnosis was made from three foliar samples from three randomly distributed trees in the experimental area. Samples were collected according to the protocol published by Wells and Allen (1985) for foliar sampling of forest trees for chemical analysis purposes. The samples were sent to the Salvador Alcalde Blanco laboratory of the Colegio de Postgraduados where the elements mentioned above were determined, using the methodologies already described.
In addition, soil sampling from the study area was made, in which nine subsamples were taken at a depth between 0 and 30 cm, from which three composite samples were formed. In the mentioned laboratory, pH, electrical conductivity (EC), organic matter (MO) and cation exchange capacity (CIC) were determined, as well as concentrations of N, P, K, Ca, Mg, Mn, Fe, B, Cu and Zn. Based on these results, the general fertility of the experimental site and the treatments that should be applied were defined.
Experimental design
A completely randomized experimental design was selected with a factorial arrangement of the treatments, in which the experimental unit consisted of a tree, in the diametric category of 15 to 19 cm in normal diameter and approximately 12 m in height. Each treatment was replicated five times and the factors tested were P and K, with three levels (doses) of P and four of K, which gave a total of 12 treatments.
The response variable analyzed was the increase in normal diameter and the statistical model used was:
Where:
To assign the treatments to the experimental units, a randomization was run using the R software (The R Project, 2017).
Applied treatments
The 12 fertilization treatments resulting from the combination of P and K levels (Table 1) were applied to the previously selected experimental units.
Table 1 Factors and levels tested in the Cedrela odorata L. fertilization experiment in Venustiano Carranza, Puebla.
| Levels | P (H3PO4 2 mL per tree) | K (K2SO4 g per tree) | Number of replications |
|---|---|---|---|
| 1 | 0 | 0 | 5 |
| 2 | 390 | 660 | 5 |
| 3 | 690 | 1 340 | 5 |
| 4 | 2 000 | 5 |
In addition to the 12 treatments mentioned, a treatment without fertilization was established (absolute control). To each of the experimental units, except for the absolute controls, N was applied in the form of commercial urea, at a rate of 600 g per tree and 100 mL of microelements in the commercial presentation called “sagaquel combi” (Fe = 3.1 %, Zn = 4.05 %, B = 0.05 %, Cu = 0.04 %, Co = 0.002 %, Mn = 0.25 %, Mo = 0.005 %). These fertilizer materials were supplied to ensure the absence of deficiencies of said nutrients throughout the experiment. The application of these nutrients and treatments with P and K was done in eight holes 30 cm deep in the soil, at a distance of 1 m from the base of each tree.
At the time of applying the treatments to the trees, weeds were removed, with the use of a systemic herbicide, based on glyphosate, which was applied within a radius of 2 m around each tree, including absolute controls; this prevented the consumption of nutrients by weeds.
Response variables
For each experimental unit, the diameter was measured at 1.30 m above ground level. The first measurement was made on October 22, 2017, and the second on October 22, 2018. From these data the annual diameter increase (cm yr-1) was obtained.
In September 2018, a foliar sample of three experimental units of each treatment was taken, according to the recommendations of Wells and Allen (1985). The samples were prepared for analysis in the same laboratory mentioned before, where N, P, K, Ca, Mg, Fe, Cu, Mn, B and Zn were determined by the methods already described.
Results
Figure 2 illustrates the two subpopulations into which the population of 74 trees evaluated was divided. The high performance subpopulation included 11 trees of the total population, while the low performance subpopulation included 63 trees (84 %).
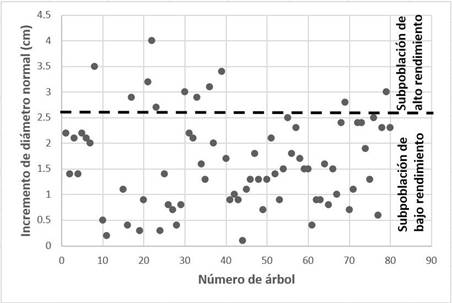
Incremento de diámetro normal = Increase in diameter; Supoblación de bajo rendimiento = Low performance subpopulation; Subpoblación de alto rendimiento = High performance subpopulation; Número de árbol = Tree number.
Figure 2 Increase in diameter reached in seven months of the evaluation period in the subpopulations of Cedrela odorata L. trees.
The increase in diameter in the evaluation period varied from 0.1 cm to 4.0 cm. The average of the high performance subpopulation was more than double, compared to that of the low performance subpopulation (Table 2).
Table 2 Basic descriptive statistics regarding the increase in diameter at breast height in the subpopulations of high and low performance.
| Subpopulation | Number of samples | Mean | Minimum value | Maximum value |
|---|---|---|---|---|
| 1 | 11 | 3.1364 | 2.7 | 4.0 |
| 2 | 62 | 1.3597 | 0.1 | 2.5 |
The t-test for the comparison of the Diameter at Breast Height Increment (IDAP, for its acronym in Spanish) in the high and low performance subpopulations indicates that these are different from each other (Pr> 0.0001), which expresses that the average of the subpopulation of high performance is significantly higher than low performance (Table 3).
Table 3 t test to compare the diameter increase in the high performance and low performance subpopulations.
| Method | Variances | FD | T value | Pr>|t| |
|---|---|---|---|---|
| Clustered | Equal | 71 | 8.6 | <0.0001 |
| Satterthwaite | Not-equal | 23.066 | 12.6 | <0.0001 |
The ranges and means of the concentrations of the nutrients studied in red cedar foliage are shown in Table 4.
Table 4 Foliar nutrient concentrations in the entire population of Cedrela odorata L. trees.
| Nutrient | Concentration range | Mean concentration |
|---|---|---|
| N (%) | 0.56-3.78 | 1.94 |
| P (%) | 0.082-0.25 | 0.14 |
| K (%) | 0.26-2.28 | 0.83 |
| Ca (%) | 0.58-3.17 | 1.71 |
| Mg (%) | 0.079-0.38 | 0.22 |
| B (ppm) | 14.7-108.3 | 41.0 |
| Cu (ppm) | 0.95-6.08 | 3.04 |
| Fe (ppm) | 38-417 | 102.0 |
| Mn (ppm) | 4.99-136.0 | 21.3 |
Critical nutrient concentrations consisted of the means of the concentrations of each nutrient, associated with the 11 trees of the high performance subpopulation (Table 5).
Table 5 Nutrient concentrations of the trees corresponding to the subpopulation of high performance and critical concentrations for mid-rotation Cedrela odorata L. trees.
| IDAP | N (%) | P (%) | K (%) | Ca (%) | Mg (%) | B (ppm) | Cu (ppm) | Fe (ppm) | Mn (ppm) | Zn (ppm) |
|---|---|---|---|---|---|---|---|---|---|---|
| 4.0 | 2.205 | 0.174 | 0.720 | 1.708 | 0.258 | 19.59 | 1.83 | 202.10 | 30.06 | 31.53 |
| 3.5 | 1.75 | 0.176 | 0.901 | 1.239 | 0.135 | 17.41 | 3.70 | 220.06 | 29.09 | 24.98 |
| 3.4 | 1.575 | 0.089 | 0.415 | 2.650 | 0.317 | 53.96 | 1.74 | 50.77 | 28.83 | 28.41 |
| 3.2 | 2.065 | 0.141 | 0.445 | 2.090 | 0.203 | 26.17 | 1.98 | 104.41 | 9.45 | 27.45 |
| 3.1 | 2.415 | 0.154 | 1.610 | 1.163 | 0.161 | 33.30 | 3.62 | 127.21 | 16.93 | 20.52 |
| 3.0 | 2.065 | 0.147 | 0.416 | 2.480 | 0.250 | 25.73 | 2.59 | 85.29 | 19.59 | 36.45 |
| 3.0 | 2.835 | 0.155 | 0.905 | 1.160 | 0.140 | 60.13 | 2.71 | 103.77 | 14.29 | 22.55 |
| 2.9 | 2.31 | 0.241 | 0.872 | 1.476 | 0.124 | 20.70 | 3.99 | 221.16 | 32.52 | 29.56 |
| 2.9 | 2.24 | 0.168 | 1.352 | 1.676 | 0.312 | 21.08 | 2.22 | 81.86 | 18.36 | 18.01 |
| 2.8 | 2.1 | 0.098 | 0.374 | 2.541 | 0.303 | 71.83 | 2.38 | 53.96 | 22.14 | 22.16 |
| 2.7 | 1.61 | 0.170 | 1.216 | 0.916 | 0.178 | 18.04 | 0.95 | 84.75 | 5.00 | 15.29 |
| CC | 2.106 | 0.156 | 0.839 | 1.736 | 0.216 | 33.45 | 2.52 | 121.39 | 20.57 | 25.17 |
IDAP = DBH Increment (cm in the evaluation period of 7 months); CC = Critical Nutrient Concentration.
A set of DRIS standards (Table 6) was also generated with the different ratios between the mean values and coefficients of variation of the nutrients, corresponding to the high performance subpopulation, with 45 quotients. In this process, the macronutrient concentration unit was always percentage (%) with respect to dry matter, while the micronutrients were handled in ppm.
Table 6 Set of DRIS standards for mid-rotation Cedrela odorata L. trees.
| Ratio | Value | C.V. | Ratio | Value | C.V. | Ratio | Value | C.V. |
|---|---|---|---|---|---|---|---|---|
| N/P | 14.24 | 25.57 | P/Mn | 20.57 | 41.48 | Mg/B | 0.01 | 46.15 |
| N/K | 3.12 | 45.37 | P/Zn | 0.01 | 34.83 | Mg/Cu | 0.10 | 52.40 |
| N/Ca | 1.38 | 39.11 | K/Ca | 0.61 | 69.86 | Mg/Fe | 0.00 | 73.52 |
| N/Mg | 11.09 | 42.94 | K/Mg | 4.59 | 61.44 | Mg/Mn | 0.01 | 63.37 |
| N/B | 0.08 | 37.71 | K/B | 0.03 | 63.75 | Mg/Zn | 0.01 | 41.40 |
| N/Cu | 0.94 | 34.03 | K/Cu | 0.39 | 79.20 | B/Cu | 14.97 | 59.26 |
| N/Fe | 0.02 | 42.25 | K/Fe | 0.01 | 54.72 | B/Fe | 0.41 | 96.41 |
| N/Mn | 0.13 | 59.41 | K/Mn | 0.06 | 105.81 | B/Mn | 2.00 | 61.12 |
| N/Zn | 0.09 | 28.34 | K/Zn | 0.04 | 66.97 | B/Zn | 1.41 | 59.41 |
| P/K | 0.22 | 35.86 | Ca/Mg | 8.25 | 23.90 | Cu/Fe | 0.02 | 41.28 |
| P/Ca | 0.11 | 45.98 | Ca/B | 0.06 | 38.60 | Cu/Mn | 0.14 | 37.33 |
| P/Mg | 0.85 | 53.64 | Ca/Cu | 0.79 | 46.57 | Cu/Zn | 0.10 | 37.62 |
| P/B | 0.01 | 53.58 | Ca/Fe | 0.02 | 77.35 | Fe/Mn | 6.99 | 57.58 |
| P/Cu | 0.07 | 52.88 | Ca/Mn | 0.10 | 52.89 | Fe/Zn | 4.90 | 43.49 |
| P/Fe | 0.00 | 28.62 | Ca/Zn | 0.07 | 29.97 | Mn/Zn | 0.81 | 35.43 |
C.V. = Coefficient of variation
Verification of critical concentrations and DRIS standards in the field
According to Table 7, when applying the fertilization experiment to the critical concentrations in the present study, the absolute control showed deficiencies of N, P, K and Mg; however, the most deficient nutrient was K and IDAP was 0.25 cm. Based on this diagnosis, a second treatment of the fertilization experiment was selected (Table 7), which provided 600 g of potassium sulfate and 600 g of urea. The foliar analysis indicated that the application of the aforementioned materials caused an increase in the foliar concentrations of N and K. When applying the generated critical concentrations to this treatment, K proved to be still the most deficient nutrient, but the N deficiency was counteracted. This treatment increased the IDAP from 0.25 cm to 1.27 cm; that is, there was an increase five times higher than that of the absolute control. Such increase means that the critical concentrations developed in the present study correctly predicted the nutritional status of the absolute control.
Table 7 Process of verification of critical nutrient concentrations for Cedrela odorata L. through a field experiment.
| Number | Treatment | Foliar concentration (%) | Diagnosis by CC | IDAP (cm year-1) | ||||||||||
|---|---|---|---|---|---|---|---|---|---|---|---|---|---|---|
| P | K | N | N | P | K | Ca | Mg | N | P | K | Ca | Mg | ||
| 1 | 0 | 0 | 0 | 1.70 | 0.13 | 0.34 | 2.69 | 0.17 | D | D | MD | S | D | 0.25 |
| 2 | 0 | 600 | 600 | 2.09 | 0.13 | 0.46 | 2.25 | 0.19 | S | D | MD | S | D | 1.27 |
| 3 | 0 | 1 340 | 600 | 2.00 | 0.14 | 0.41 | 1.93 | 0.17 | LD | LD | MD | S | D | 1.10 |
| 4 | 390 | 2 000 | 600 | 1.98 | 0.13 | 0.41 | 2.42 | 0.18 | D | LD | MD | S | D | 1.03 |
Num. = Number of treatment; IDAP = DBH Increment (cm year1); S = Enough; LD = Slightly defficient; D = Defficient; MD = Very defficient; N, P and K treatment in g de urea, Phosphoric acid and Potassium sulfate, respectively, applied to each tree.
From the diagnosis of the second treatment (Table 7), a third treatment corresponding to a higher dose of potassium sulfate (1340 g tree-1) was applied, but the fertilization level was maintained with N (Table 7).
Although the application of potassium sulfate and urea in treatment three did not manifest itself in increases in the concentrations of these nutrients, the IDAP decreased slightly with respect to treatment two (from 1.27 cm year-1 to 1.10 size-1). It is likely that this slight decrease in IDAP is due to the fact that the diagnosis of treatment two was not strictly addressed since, in addition to K (potassium sulfate), a dose of P (phosphoric acid) had to be applied. This response from the trees confirms that the set of critical concentrations generated correctly predicted the nutritional status of treatment two (Table 7).
To attend, at least partially, the diagnosis of treatment three treatment four was implemented that included 390 g of phosphoric acid (P) and 2000 g of potassium sulfate (K), while maintaining the same level of N (600 g of urea), when the dose of this nutrient should be increased according to the diagnosis of treatment three. It was not possible to correct the Mg deficiency diagnosed in treatment three, because the experiment did not include the application of Mg. Since this treatment was unable to satisfy the strong K deficiency as well as the deficiencies of N, P and Mg, the performance decreased slightly with respect to treatment three (from 1.10 to 1.03 cm year-1).
In treatment two (Table 7), by correcting K, which was the most deficient element, it was possible to have the highest foliar concentration of this nutrient while achieving the highest IDAP, which consistently demonstrates that the critical concentrations generated are effective.
When verifying the effectiveness of the DRIS standards, using the DRIS indices of the absolute control or treatment one (Table 8), it was determined that the most deficient element was K (lowest DRIS index; -27.09), followed by N (-5.74) , Mg (-3.52) and P (-1.56) (Table 8), so by applying potassium sulfate (treatment 2) and 600 g of urea it was possible to reduce the K index (-15.91) and satisfy the deficiency N (0.24), to which the tree reacted by increasing the foliar concentration of these two nutrients and the IDAP from 0.25 to 1.27 cm.year-1. This indicates that the DRIS norms generated in the present study correctly predicted the nutritional status of treatment one.
Table 8 Verification of DRIS standards in a field experiment.
| Number | Treatment | Foliar concentration (%) | DRIS Index | IDAP | ||||||||||
|---|---|---|---|---|---|---|---|---|---|---|---|---|---|---|
| P | K | N | N | P | K | Ca | Mg | N | P | K | Ca | Mg | ||
| 1 | 0 | 0 | 0 | 1.70 | 0.13 | 0.34 | 2.69 | 0.17 | -5.74 | -1.56 | -27.09 | 37.92 | -3.52 | 0.25 |
| 2 | 0 | 600 | 600 | 2.09 | 0.13 | 0.46 | 2.25 | 0.19 | 0.24 | -4.05 | -15.91 | 19.18 | 0.54 | 1.27 |
| 3 | 390 | 1 340 | 600 | 1.97 | 0.14 | 0.40 | 2.84 | 0.17 | -3.21 | -2.26 | -22.82 | 35.08 | -6.78 | 0.73 |
IDAP = DBH increment (cm year-1; 1.30 m)
In treatment 3 (Table 8) the nutrients diagnosed as deficient in treatment two were applied, maintaining the application level of 600 g of urea (N); however, the application failed to improve the DRIS index of K, but only that of P, but in addition, there was a significant deficiency of Mg, a nutrient that was not handled in the fertilization experiment, which led to a reduction in performance in regard to treatment two.
According to Table 8, the highest DRIS index of K (-15.91) corresponds to the highest IDAP (treatment 2), which may mean that K is the most deficient nutrient, as diagnosed by the DRIS standard generated in this study. With these results, it is possible to assert that the set of DRIS standards developed in the present study correctly predicts the nutritional status of C. odorata trees in half term.
Based on the process of verification of the DRIS standards at the plantation site, the most deficient nutrient is K, but there are deficiencies of P, Mg and N. On the other hand, at the study site there are soil conditions that limit the availability of some nutrients, especially P and K. Apparently there is an effect of antagonism between N and K, which in the soil compete for adsorption sites (Mengel and Kirkby, 1982), causing leaching of one of them or both.
Discussion
The critical nutritional concentrations obtained in the present study (Table 5), were in the case of N (2.106 %), a value that is in the range indicated by Drechsel and Zech (1991) for C. odorata, as an intermediate concentration interval for the species (2 years old). Ramírez et al. (2018) found foliar concentrations of N (not critical concentrations) in C. odorata trees from 2 to 17 years old, above the critical concentration of N defined in the present study. The critical concentration determined in the present study (0.156 %) is low compared to that indicated by Drechsel and Zech (1991) 0.23 %, but similar to that found by Ramírez et al. (2018). The results of the present study yielded a critical concentration of K of 0.839 %, comparable to the concentrations found by Calixto et al. (2015) in various fertilization treatments applied. However, Drechsel and Zech (1991) indicate an optimal concentration of K (0.244 %), which is very low compared to that defined in the actual study. The critical concentration of Ca found in the current study is more than six times higher than that proposed by Drechsel and Zech (1991) of 1.736 % vs. 0.179 %. In the case of Mg, the critical concentration determined in this study is similar to that recommended by Drechsel and Zech (1991) 0.24 vs 0.2163 %. For micronutrients, Drechsel and Zech (1991) report 25 ppm for Mn, 148 ppm Fe and 15 ppm Zn; the corresponding values found in this investigation are 20, 121 and 25, for Mn, Fe and Zn, respectively.
Critical concentrations correctly predict the nutritional status of C. odorata trees, although in some steps of the verification process, the fertilization treatments available within the fertilization experiment, did not allow timely correction of all the deficiencies detected. In this process, it should be noted that the inability of treatment four to correct the deficiencies of K, N and P, even when they were applied, is probably due, in the case of K, to the known effect of antagonism between N and K (Mengel and Kirkby, 1982). The permanence of P deficiency, even when this nutrient was applied in treatment four, may be due to the high calcium content (Ca) in the soil (8 840 ppm) since its pH is high (7.72), in which condition occurs the formation of calcium phosphates that precipitate at deep horizons of the soil being unavailable to the tree (Montero-Solís et al., 2019).
The DRIS set of rules correctly predicted the nutritional status; however, in treatment 3 the problem arose, apparently, of low availability of the applied nutrients (P and K). It is likely that the deficiency of K could not be corrected, because in treatment three N was also applied, a nutrient that was not deficient and that is often antagonistic with K in the soil (Mengel and Kirkby, 1982).
In the study site a generalized low availability of P is identified, which apparently occurs when this element reacts with Ca, a nutrient that has a high concentration (8 840 ppm) in the soil, accompanied by a high pH value (7.72). Under these conditions, the formation of calcium phosphates in the soil is frequent (da Silva and Fitzsimmons, 2016; Montero-Solís et al., 2019), which precipitate towards deep horizons, decreasing the availability of P.
It is important to note that the DRIS standards and critical concentrations generated in this study should be considered preliminary, since they were derived from a relatively small database (74 trees); however, despite the fact that the predictive capacity of these nutritional standards is perfectible, their verification processes indicate that their predictive right.
Conclusions
A set of critical nutrient concentrations and one of DRIS standards are presented, for foliar concentrations of 10 nutrients of mid-rotation Cedrela odorata trees (around 10 years old).
Critical nutrient concentrations and DRIS norms derived from the study correctly predict nutrient deficiencies in C. odorata trees in half shifts and are ideal for determining their nutritional status during the phenological stages corresponding to the mentioned age and diametric categories of 15 to 19 cm.
The C. odorata plantation adopted for the verification of the sets of critical concentrations and DRIS standards has severe K deficiencies and slight of N, Mg and P.
Acknowledgements
The authors thank the Consejo Nacional de Ciencia y Tecnología (Conacyt), for supporting the Masters studies program of the first autor by a grant. To Dr. Lourival Domingos Possani Postay for providing the location to carry out the experiments.
REFERENCES
Beaufils, E. and M. Sumner. 1976. Soil and plant factors in their effects on yield of sugarcane. Proceedings of The South African sugar technologists Association: 118-124. https://pdfs.semanticscholar.org/ceff/0d652ea736805de11f24b495abd4a0060487.pdf (12 de febrero de 2019). [ Links ]
Brown, A. y S. Pacheco. 2006. Ecología y producción de cedro (género Cedrela) en las Yungas australes. Ediciones del Subtrópico, Tucumán, Argentina, 224 p. https://www.researchgate.net/profile/Gustavo_Zuleta/publication/308420666_Incidencia_de_herbivoria_en_Cedrela_balansae/links/57e42d0908ae25aa0208dae4/Incidencia-de-herbivoria-en-Cedrela-balansae.pdf (15 de enero de 2018). [ Links ]
Calixto, C. G., M. A. López, A. Equihua, D. E. Lira y V. M. Cetina. 2015. Crecimiento de Cedrela odorata e incidencia de Hypsipyla grandella en respuesta al manejo nutrimental. Bosque 36(2): 265-273. Doi: 10.4067/S0717-92002015000200012. [ Links ]
Comisión Nacional para el Conocimiento y Uso de la Biodiversidad (Conabio). 2017. Portal de geoinformación. http://www.conabio.gob.mx/informacion/gis/ (3 de mayo de 2019). [ Links ]
da Silva C., B. and K. Fitzsimmons. 2016. The effect of pH on phosphorus availability and speciation in an aquaponics nutrient solution. Bioresource Technology 219: 778-781. Doi. 10.1016/j.biortech.2016.08.079. [ Links ]
Drechsel, P. and W. Zech. 1991. Foliar nutrient levels of broad-leaved tropical trees: A tabular review. Plant Soil 131: 29-46. Doi: 10.1007/BF00010417. [ Links ]
López L., M. Á. 2005. Un procedimiento alternativo al tradicional para la medición de alturas con clinómetro. Madera y Bosques 11(2):69-77. Doi:10.21829/myb.2005.1121257. [ Links ]
Medina M., M. C. y E. J. Medina M. 1992. Límite de rendimiento para dividir las dos subpoblaciones de las normas DRIS para nogal pecanero. Terra 10(2):193-200. [ Links ]
Medina-Morales, M. C. 2004. Normas DRIS preliminares para nogal pecanero. Terra Latinoamericana 22(4): 445-450. http://www.redalyc.org/pdf/573/57311096008.pdf (10 de octubre de 2018). [ Links ]
Mengel, K. and A. E. Kirkby. 1982. Principles of plant nutrition. International Potash Institute. Berne, Switzerland. 593 p. [ Links ]
Montero-Solís, F. M., M. A. López-López, M. Jiménez-Casas, V. M. Cetina-Alcalá, D. E. Platas-Rosado and C. J. López-Collado. 2019. Gliricidia sepium and Fertilization affect growth, nutrient status, and incidence of Hypsipyla grandella in Cedrela odorata plantation. Agroforestry systems, 93 (3): 813-823. Doi:10.1007/s10457-017-0175-5. [ Links ]
Moreno C., L. R., M. A. López L., E. Estañol B. y A. Velázquez M. 2002. Diagnóstico de necesidades de fertilización de Abies religiosa (H.B.K.) Schl. et Cham. en vivero mediante el DRIS. Madera y Bosques 8(1): 51-60. Doi: 10.21829/myb.2002.811305. [ Links ]
Muellner, A. N., T. D. Pennington and M. W. Chase. 2009. Molecular phylogenetics of neotropical cedreleae (mahogany family, Meliaceae) based on nuclear and plastid DNA sequences reveal multiple origins of ‘‘Cedrela odorata”. Molecular Phylogenetics and Evolution 52(2): 461-469. Doi:10.1016/j.ympev.2009.03.025. [ Links ]
Osiecka, A., P. J. Minogue and E. D. Dickens. 2019. Guide to fertilization for pine straw production on coastal plain sites. IFAS Extention, FOR 327. Florida, USA. 12 p. https://edis.ifas.ufl.edu/pdffiles/FR/FR39500.pdf (2 de junio de 2018). [ Links ]
Pennington, T. D. y J. Sarukhan 1998. Árboles tropicales de México: manual para la identificación de las principales especies. 2a edición. Universidad Nacional Autónoma de México, Fondo de Cultura Económica. México, D.F., México. pp. 294-295. [ Links ]
Ramírez, D., A. Alvarado, C. Ávila, M. E. Camacho, J. Fernández, R. Murillo, L. Salazar y C. L. Sandí. 2018. Dinámica de la concentración y acumulación de nutrimentos en los componentes de la biomasa aérea de Cedrela odorata L. en Costa Rica. Agronomía Costarricense 42(1): 21-48. Doi: 10.15517/RAC.V41I1.32196. [ Links ]
Ramírez G., G. Vera C., F. Carrillo A. y O. S. Magaña T. 2013. El cedro rojo (C. odorata) como alternativa de reconversión en terrenos abandonados por la agricultura comercial en el sur de Tamaulipas. Agricultura Técnica en México 34(2): 243-250. http://www.scielo.org.mx/scielo.php?script=sci_arttext&pid=S0568-25172008000200011 (15 de febrero de 2018). [ Links ]
R Project. 2017. The R Project for Statistical Computing. Version R-3.4.2 FOR Windows. Vienna, Austria. https://www.r-project.org/about.html (1 de octubre de 2017) [ Links ]
Russell, J. S., D. M. Cameron, I. F. Whan, D. F. Beech, D. B. Prestwidge and S. J. Rance. 1993. Rainforest trees as a new crop for Australia. Forest Ecology and Management 60(1-2): 41-58. Doi: 10.1016/0378-1127(93)90022-F. [ Links ]
Secretaría de Medio Ambiente y Recursos Naturales (Semarnat). 2016. Anuario Estadístico de la Producción Forestal 2015, Coyoacán, México. https://www.gob.mx/cms/uploads/attachment/file/282951/2016.pdf (16 de febrero de 2018). [ Links ]
Walworth, J. L. and M. E. Sumner. 1987. The Diagnosis and Recommendation Integrated System (DRIS), Advances in soil science (6). B.A. Stewart USDA Conservation & Production Research Laboratory. Bushland, TX, USA. 228 p. https://link.springer.com/chapter/10.1007/978-1-4612-4682-4_4 (5 de julio de 2017). [ Links ]
Wells, C. and L. Allen. 1985. When and where apply fertilizer? A loblolly pine management guide. Gen. Tech. Rep. SE-36. U.S.D.A. Forest Service. Asheville, NC, USA. 23 p. Doi: 10.2737/SE-GTR-36. [ Links ]
Received: June 14, 2019; Accepted: January 22, 2020
 Este es un artículo publicado en acceso abierto bajo una licencia
Creative Commons
Este es un artículo publicado en acceso abierto bajo una licencia
Creative Commons
