


Services on Demand
Journal
Article
 text in
  English (pdf)
 Article in xml format
 Article references
 Send this article by e-mail
Indicators
-
 Cited by SciELO
 -
 Access statistics
Related links
-
 Similars in
SciELO
Similars in
SciELO
Share

 Permalink
Revista mexicana de ciencias forestales
Print version ISSN 2007-1132
Rev. mex. de cienc. forestales vol.10 n.56 México Nov./Dec. 2019 Epub Mar 30, 2020
https://doi.org/10.29298/rmcf.v10i56.613
Scientific article
Modeling of the current distribution and under climate change of endemic pinyon pines of Mexico
1Centro Nacional de Investigación Disciplinaria en Conservación y Mejoramiento de Ecosistemas Forestales. INIFAP. México.
2Campo Experimental Valle de Guadiana. INIFAP. México.
At present, some endemic pines of Mexico are at risk due to several factors, either anthropogenic or related to climatic alterations. In this work the current potential distribution and under climate change scenarios was modeled for four species of pinyon pines. For this purpose, bioclimatic coverages and data on the presence of four pine-tree species were used as predictive variables. Results suggest a good prediction of geographic distribution patterns (AUC> 0.9 in all cases). The high potential distribution with the GFDL-CM3 model for the 2049-2065 horizon PCR 4.5 scenarios had species-specific modifications on its surface. The most sensitive species were P. culminicola, P. johannis and P. pinceana which showed reductions of 83.6, 59.5 and 80.0 %, respectively, compared to the current surface. In scenario RCP 8.5, the reductions of these species were 83.7, 56.9 and 79.3 %, for each one. The distribution models of P. nelsonii showed for both climate scenarios (RCP 4.5 and 8.5), increases in the high potential extension with respect to the current one up to 50.8 % and 49.5 % respectively. Climate change scenarios show that pines will be affected in their distribution in the near future due to changes in precipitation and temperature patterns.
Key words Spatial analysis; scenarios; potential distribution; MaxEnt; pinyon pines; GIS
En la actualidad algunos pinos endémicos de México están en riesgo, debido a diversos factores, tanto antrópicos como relacionados con alteraciones climáticas. En este trabajo se modeló la distribución potencial actual y bajo escenarios de cambio climático de cuatro especies de pinos piñoneros. Para ello, se utilizaron coberturas bioclimáticas y datos de presencia de los taxones considerados, como variables predictoras. Los resultados sugieren una buena predicción de los patrones de distribución geográfica (AUC> 0.9 en todos los casos). La distribución potencial alta generada con el modelo GFDL-CM3, para el horizonte 2049-2065 escenarios RCP 4.5 tuvo modificaciones especificas por taxon en su superficie. Las especies más sensibles fueron Pinus culminicola, P. johannis y P. pinceana que evidenciaron reducciones de 83.6, 59.5 y 80.0 %, respectivamente; comparados con la superficie actual. En el escenario RCP 8.5, las reducciones de estos taxa fueron de 83.7, 56.9 y 79.3 %, para cada una. Los modelos de distribución de P. nelsonii mostraron, para ambos escenarios climáticos (RCP 4.5 y 8.5), aumentos en la extensión potencial alta con respecto a la actual hasta de 50.8 % y 49.5 %, respectivamente. Los escenarios de cambio climático indican que la distribución de los pinos piñoneros será afectada en el futuro cercano por los cambios en los patrones de precipitación y temperatura.
Palabras clave Análisis espacial; escenarios; distribución potencial; MaxEnt; pinos piñoneros; SIG
Introduction
The abundance and spatial distribution of living beings on Earth is governed by the ecological amplitude or tolerance ability that each species has to environmental factors (Thuiller et al., 2012). In the case of plant communities, it has been observed that they are mainly associated with edaphic, geographical and climatic factors (Ríos et al., 2016), from which the latter are the main responsible (Berry et al., 2002). However, future projections indicate increasing trends in greenhouse gases, which will result in a warmer, wetter and more dynamic world in the 21st century, characterized by extreme events (Tebaldi et al., 2006). For this reason, the effect of climate change is expected to demand a stronger adaptive selection that leads to a distance of populations from the environments to which they are adapted (Davis and Shaw, 2001); which will modify its present distribution, or even cause the direct disappearance of some of them.
Mexico is considered as a secondary center of diversification of the genus Pinus, with 49 of the 120 species identified in the world; of which 22 are endemic, of those 10 correspond to pinyon pines (Gernandt and Pérez, 2014), and the effects of the climate would be expected to further limit their distribution.
Pinyon pine trees are of great relevance for the arid areas of the country, as, sometimes, they are the only forest resource (Rosas et al., 2015). On the other hand, they are also recognized for their wide adaptability and resistance to adverse conditions, which gives them a status of species with great potential for ecological restoration (Ríos et al., 2008). However, several of its forests have shown a decrease in the area they cover, disappearing or changing their composition (Gernandt and Pérez, 2014).
Currently, six endemic species of pine trees are in the list of endangered species of NOM-059-SEMARNAT-2010 designated in the category in danger of extinction or subject to special protection (Semarnat, 2010). The objective of the study documented here was to determine the current potential distribution and through climate change scenarios of four species of endemic pine trees in Mexico included in NOM-059-SEMARNAT-2010.
Materials and Methods
Study area
The natural pine forests in Mexico are located between the following extreme coordinates: in the north of the country: to the north: 32º43’06’’ N, 114º43’22” W; to the west: 29º03’54” N, 122°10’13” W; to the east 16°06'03” N, 91°20'06” W; and to the south 11°58'07" N, 94°26´02” W. They are present in almost all the Mexican states, except for Aguascalientes, Baja California Sur, Campeche, Quintana Roo, Tabasco and Yucatán (Figure 1). The most important orographic chains where these species are located are Sierra Madre Occidental, Sierra Madre Oriental, Neovolcánico Axis and Sierra del Sur (Inegi, 2016).
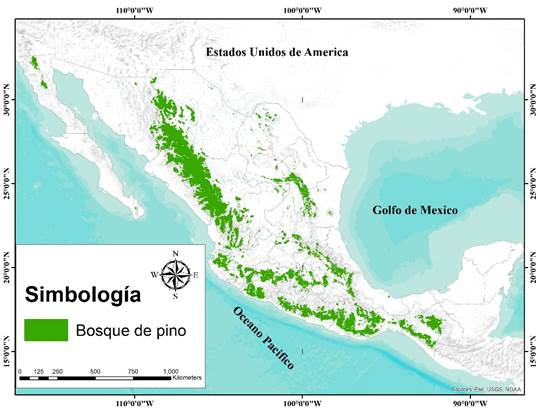
The dominant climates of pine forests are subhumid temperate [C (w), in 25 % of the total area of the country], subhumid semi-warm [(A) C, 24.5 %], semi-arid and arid (BS, 11.5 %), subhumid semi-cold (Cb, 10.5 %), warm subhumid (Aw, 6.0 %), and other diverse climates (22.5 %) (Inegi, 2016).
The altitude where these forest masses grow varies from 200 m to 4 200 m above sea level (Inegi, 2016). Extreme temperatures range from 0 to 40 °C; although, most are located in sites with records from 0 to 17 °C (Guevara and Arroyo, 2016; Inegi, 2016). In Mexico, pine forests are, especially, on igneous rocks, also on a regular basis they are located on gneisses and shales, less frequently on marls, sandstones, lutites and limestones. Most pine trees tolerate acid soils (Rzedowski, 2006). The types of soil where they mainly develop are Litosol, Eutric Regosol, Haplic Feozem, Eutric Cambisol, Chromic Luvisol, Chromic Cambisol, Humic Andosol, Dystric Cambisol, Humic Acrisol and Ocric Andosol (INIFAP-Conabio, 1995).
Data of presence of pinyon pine species
Four species of pinyon pines at risk categories were chosen, according to the NOM-059-SEMARNAT-2010: Pinus culminicola Andresen & Beaman, Pinus johannis M. F. Robert, Pinus nelsonii Shaw and Pinus pinceana Gordon. A geographic database was prepared with a total of 884 records obtained from different herbaria: Herbario CHAP de la División de Ciencias Forestales de la Universidad Autónoma Chapingo (Division of Forest Sciences of Chapingo Autonomous University); Herbario Hortorio (CHAPA) del Colegio de Postgraduados (Hortorio Herbarium (CHAPA) of the Graduate College); Herbario Metropolitano (UAMIZ) de la Universidad Autónoma Metropolitana Unidad Iztapalapa (Metropolitan Herbarium (UAMIZ) of the Autonomous Metropolitan University Iztapalapa Campus); Herbario Nacional Forestal, “Biól. Luciano Vela Gálvez” (INIF) del Instituto Nacional de Investigación Forestal, Agrícola y Pecuaria INIFAP - Cenid-Comef (National Forest Herbarium, “Biól. Luciano Vela Gálvez ”(INIF) of the National Institute of Forestry, Agricultural and Livestock Research INIFAP - Cenid-Comef); Herbario CIIDIR del Centro Interdisciplinario de Investigación para el Desarrollo Integral Regional, Unidad Durango del Instituto Politécnico Nacional (CIIDIR Herbarium of the Interdisciplinary Research Center for Regional Integral Development, Durango Campus of the National Polytechnic Institute); Herbario CFNL de la Facultad de Ciencias Forestales de la Universidad Autónoma de Nuevo León (CFNL Herbarium of the School of Forest Sciences of the Autonomous University of Nuevo León); Herbario XAL of the Instituto de Ecología, A. C. (XAL Herbarium of the Institute of Ecology, A. C.) and Herbario ENCB of the Escuela Nacional de Ciencias Biológicas of the Instituto Politécnico Nacional (ENCB Herbarium of the National School of Biological Sciences of the National Polytechnic Institute). In addition, digital herbariums and outstanding electronic pages of large collections of plants such as the Herbario Nacional de México (MEXU) of the Universidad Nacional Autónoma de México (National Herbarium of Mexico (MEXU) of the National Autonomous University of Mexico); the Herbario Virtual de la Comisión Nacional para la Conservación y Uso de la Biodiversidad (HVC) (Virtual Herbarium of the National Commission for the Conservation and Use of Biodiversity (HVC)) and the Red de Herbarios del Noreste de México (Herbanwmex) (Network of Herbaria of the Northeast of Mexico (Herbanwmex)) were consulted. Other sources of data were the Inventario Nacional Forestal y Suelos (INFyS) (National Forest and Soil Inventory (INFyS)) of the Comisión Nacional Forestal (Conafor) (National Forestry Commission (Conafor)) and scientific literature.
Climatic variables
Climatic, topographic and edaphological coverage were used, with a resolution of 926 m. 19 layers were used in raster format: temperature and precipitation of the 1902-2011 climate period, from WorldClim (Fernández et al., 2019). The altitude, exposure and slope coverage were obtained from the processing of the Continuous Model of Mexican Elevations 3.0 (CEM, for its acronym in Spanish), available on the official website of the National Institute of Statistics and Geography (Inegi, 2018) and the building was generated from the vector layer of Edaphology of INIFAP-Conabio (1995).
For the distribution model with climate change projections, the general circulation model (MCG, for its acronym in Spanish) GFDL-CM3 (Geophysical Fluid Dynamics Laboratory Climate Model version 3) of the United States of America was considered, under the scenario of greenhouse gas emissions (GHG) and Representative Concentration Pathways (CPR) 4.5 and 8.5, as well as the horizon of the medium future (2045-2069). CPR refers to radiative forcing expressed in W m-2 and it is assumed that it varies with increasing GHG. These covers were obtained from the page of the Information Technology Unit for Atmospheric and Environmental Sciences of UNAM (Fernández et al., 2015).
Modeling of the current potential distribution and under climate change scenarios
The current potential distribution models and under climate change scenarios of the stone species were generated with the MaxEnt 3.4.1 program (Maximum Entropy) (Phillips and Dudik, 2008), software that estimates the probability of the presence of a species seeking the distribution of maximum entropy (as uniform as possible), based on environmental variables (covariates) and occurrence data (Phillips et al., 2006). The probability is expressed in terms of "gain", which is calculated as the logarithm of the number of cells in the grid, minus the average of the negative logarithmic probabilities of the locations used to adjust the model (Phillips et al., 2006; Phillips and Dudík, 2008).
During the execution of the models, the parameters predetermined by the MaxEnt program were maintained, as suggested by Phillips et al. (2006). A replica of the model for each species was made, by random selection of 75 % of the occurrence locations for the training of the model and the remaining ones (25 %) as test data for validation.
Cut threshold for category definition
To generate the prediction models, the cut-off threshold was determined. The value established for the present study corresponds to the following categories: 0 as null, ≤ 0.30 low, 0.30 - 0.60 average and ≥ 0.60 high. The analysis and interpretation of the models generated by MaxEnt was executed with the ArcMap 10.4 software.
Evaluation of distribution models
The prediction quality of the distribution models was determined with the technique of evaluation of the characteristic operated by the receiver (ROC: Receiver Operating Characteristic), from the analysis of the area under the curve (AUC: Area Under the Curve). The AUC is the graphic representation of the discriminative capacity of a model for all possible cut-off points and can be interpreted as the highest probability that a randomly selected presence point is located in a raster cell, with a high probability value for the presence of the species.
The values of the area under the curve are categorized as follows: Excellent (AUC> 0.9), Good (0.8 <AUC <0.9), Acceptable (0.7 <AUC <0.8), Bad (0. 6 <AUC <0.7) and Invalid (0.5 <AUC <0.6) (Araujo et al., 2005; Elith et al., 2006). In addition, the Confidence Interval was calculated for each of the estimates at a 95 % probability. Statistical analyzes were performed with software R version 3.4.2.
Results and Discussion
Validation of the models
The generated models suggest a good prediction of the current geographic distribution patterns and under scenarios for the four taxa of pine trees under study. The AUC values of the training and validation data were estimated above 0.9 (Table 1). According to Elith et al. (2006), models with AUC values of 0.75 are useful for predicting species distribution; in that sense, the AUC values greater than 0.91, obtained in this work, indicate that the models are highly described by the bioclimatic variables. The highest AUC (0.99) was recorded for the most geographically restricted species, P. nelsonii. The validity of the models was checked with the statistics used. In all cases, the AUC was above 90 % and there was significance (p-value <0.05) (Table 1).
Table 1 Statistical parameters for the validation of the potential distribution models of four species of pinyon pines.
| Species | Current | RCP 4.5 | RCP 8.5 | ||||||
|---|---|---|---|---|---|---|---|---|---|
| AUC | P-value | IC 95 % | AUC | P-value | IC 95 % | AUC | P-value | IC 95 % | |
| Pinus culminicola Andresen & Beaman | 0.98 | <0.05 | 0.86 | 0.95 | <0.05 | 0.87 | 0.95 | <0.05 | 0.74 |
| Pinus johannis M. f. Robert | 0.97 | <0.05 | 0.81 | 0.96 | <0.05 | 0.81 | 0.96 | <0.05 | 0.61 |
| Pinus nelsonii Shaw | 0.98 | <0.05 | 0.92 | 0.92 | <0.05 | 0.92 | 0.93 | <0.05 | 0.71 |
| Pinus pinceana Gordon | 0.95 | <0.05 | 0.94 | 0.91 | <0.05 | 0.95 | 0.92 | <0.05 | 0.87 |
AUC= Area Under the Curve, IC 95 %= 95 % Confidence Interval
Contribution of the variables to the modeling of the species
In the current models, the variables that most influenced the modeling of the presence of P. culminicola were temperature (58.1 %) and precipitation (26.3 %); while, in P. johannis, P. nelsonii and P. pinceana were precipitation (38.4 %, 61.1 % and 42.0 %, respectively) and altitude (29.9 %, 20.2 % and 32.2 %, respectively); the rest of the proportions corresponded to the variables, but to a lesser extent. With the RCP 4.5 scenario, the proportions were: in P. culminicola the temperature, with 54.3 %; and precipitation, with 17.6 %. In P. johannis, P. nelsonii and P. pinceana corresponded to altitude (50.7 %, 40.2 % and 53.2 %, respectively) and precipitation (27.7 %, 33.7 % and 24.7 %, respectively). With the RCP 8.5 scenario, for P. culminicola were: temperature (53.3 %) and precipitation (18.2 %), in P. johannis, P. nelsonii and P. pinceana were the altitude (51.2 %, 40.4 % and 53.5 %, respectively) and precipitation (27.0 %, 33.5 % and 25.2 %); the rest of the proportions fell on the other variables, but on smaller values.
The importance of the variables in the models is coincident with that indicated by Rojas et al. (2012) and Mateo et al. (2013), who pointed out that the climate is fundamental and widely used in modeling potential geographic distributions.
Modeling of the current potential distribution
P. pinceana has a larger area of ideal high surface and, to a lesser extent, P. johannis, P. nelsonii and P. culminicola.
Table 2 shows the potential distribution area with category: High, Medium and Low of the four pinyon pines in Mexico.
Table 2 Current potential distribution areas of pinyon pines (hectares).
| Species | High | Medium | Low | Total |
|---|---|---|---|---|
| Pinus culminicola Andresen & Beaman | 126 792 | 266 320 | 8 002 135 | 8 395 246 |
| Pinus johannis M. f. Robert | 495 291 | 1 260 637 | 10 726 812 | 12 482 741 |
| Pinus nelsonii Shaw | 222 843 | 1 484 916 | 4 877 643 | 6 585 402 |
| Pinus pinceana Gordon | 2 081 718 | 8 144 249 | 25 961 331 | 36 187 297 |
The ideal areas for P. culminicola and P. nelsonii are mainly located in the states of Nuevo León, Coahuila, Tamaulipas, San Luis Potosí and minimum areas that are limited to Querétaro, Hidalgo, Tlaxcala and Puebla. It is estimated that P. johannis develops in Coahuila, Zacatecas, Guanajuato, Tamaulipas, Hidalgo, Nuevo León and Coahuila, and to a lesser extent, in other states. The distribution of P. pinceana recorded the greatest interval of all species, since it extends to Coahuila, Durango, San Luis Potosí, Zacatecas, Nuevo León, Guanajuato and Chihuahua and, to a lesser extent, in Querétaro and Hidalgo (Figure 2).
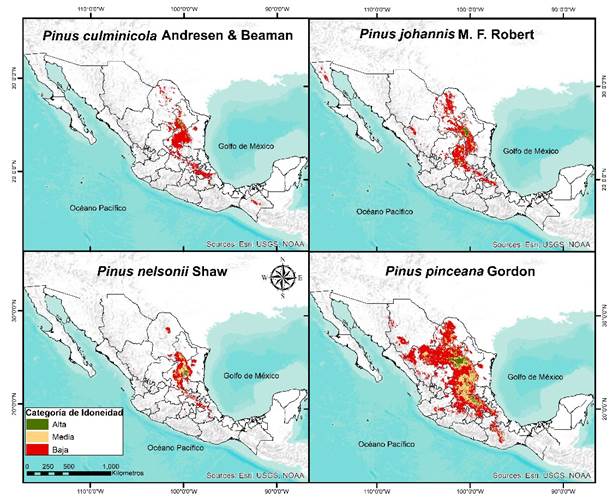
Categoría de Idoneidad = Suitability category; Alta = High; Media = Medium; Baja = Low.
Figure 2 Current potential distribution models of endemic pine trees in Mexico.
P. pinceana has a little more than 2 000 ha of high potential (Table 2), an estimate that differs considerably from the results obtained by Aguirre and Duivenvoorden (2010), who modeled the distribution of 56 species of pines in Mexico, including the species mentioned, and they used the MaxEnt Maximum Entropy algorithm. They obtained an area with high fitness of 15 910 750 ha, while Treviño (2018), calculated 1 026 800 ha.
For P. nelsonii, P. culminicola and P. johannis the results obtained in this study were 200 000 ha, 126 000 ha and 495 000, respectively, which contrasts with the results of Aguirre and Duivenvoorden (2010) who reported 11 147 600, 679 160 and 26 559 170 ha. Comparative differences in the potential areas of the studies can be attributed to the method applied in each study.
The results of modeling coincide with those of Favela (2010), who described that P. culminicola is located at high elevations of 3 000-3 650 masl; also, Contreras et al. (2012) confirms that the climates where it grows are cold, with an average monthly temperature of 10 °C during the warmer months and an annual rainfall of 401.3 mm. Romero et al. (2000) indicate that P. johannis thrives at altitudes of 2 400 to 2 800 m with annual rainfall of 300 to 400 mm. According to Suzan et al. (2002), P. nelsonii is distributed between 1 900 and 2 300 masl, in areas with annual rainfall between 300 and 600 mm; it is located on mountain feet from arid to semi-arid environments (Perry, 1991; Farjon and Styles, 1997). Estrada et al. (2014) indicated that P. pinceana is located in an altitudinal range of 1 500 to 2 300 m, in places with an annual rainfall between 350 and 600 mm (Martínez et al., 2015). According to Barrera et al. (2018) the pine trees have wide latitudinal and altitudinal distribution, and occupy different climatic and edaphic regimes due to the interaction of different environmental factors.
Modeling of the potential distribution under climate change scenarios
The GFDL-CM3 model estimated increases in temperature ranges and decreased precipitation, relative to the current ranges in the potential distribution of pinyon pine trees due to the phenomenon of climate change (Table 3). According to the results, in the RCP 4.5 scenario, the simulated temperature range for the pine trees was 10 to 25 °C, while for the RCP 8.5 between 11 and 26 °C. The precipitation in RCP 4.5 was 153 to 2 584 mm and in RCP 8.5 125 to 2 605 mm. Regarding the humidity conditions, P. culminicola and P. pinceana are the species with the distribution in areas of less precipitation (Table 3).
Table 3 Extreme intervals of mean temperature and annual precipitation of different scenarios of climate change with the GFDL-CM3 model, 2045-2069 horizon, of the distribution of the four pinyon pine species.
| Species | RCP 4.5 | RCP8.5 | ||
|---|---|---|---|---|
| Mean T (°C) | Annual P (mm) | Mean T (°C) | Annual P (mm) | |
| Pinus culminicola Andresen & Beaman | 10-25 | 224-876 | 11-26 | 185-839 |
| Pinus johannis M. f. Robert | 12-24 | 244-708 | 13-25 | 189-657 |
| Pinus nelsonii Shaw | 12-25 | 244-860 | 13-27 | 211-822 |
| Pinus pinceana Gordon | 13-24 | 153-1 317 | 14-26 | 125-1 252 |
T (°C) =Temperature; P (mm) = Precipitation
Tables 4 and 5, respectively, show the potential distribution of the four pinion species with the GFDL-CM3 model with the climate change scenarios for the mid-future horizon (2045-2069) RCP 4.5 and RCP 8.5. In the first, in descending order of greater potential high and medium areas, P. pinceana, P. nelsonii, P. johannis and P. culminicola stand out. The first species in Coahuila, Nuevo León, Zacatecas, Guanajuato, San Luis Potosí, Tamaulipas, Hidalgo, Querétaro and Puebla. The second in Nuevo León, Coahuila, Zacatecas, Tamaulipas, Guanajuato, San Luis Potosí, Chihuahua and Hidalgo. The third in Coahuila, Zacatecas, Nuevo León and San Luis Potosí, and the fourth, in Nuevo León, Coahuila, State of Mexico, Puebla and Zacatecas.
Table 4 Potential surfaces of pinyon species, with RCP 4.5 climate change scenarios with medium future horizon (2045-2069) (in hectares).
| Species | High | Medium | Low | Total |
|---|---|---|---|---|
| Pinus culminicola Andresen & Beaman | 20 833 | 141 669 | 4 071 883 | 4 234 385 |
| Pinus johannis M. f. Robert | 200 568 | 461 420 | 2 157 451 | 2 819 440 |
| Pinus nelsonii Shaw | 333 077 | 704 926 | 192 3053 | 2 961 056 |
| Pinus pinceana Gordon | 415 604 | 1 059 232 | 383 5702 | 5 310 538 |
Table 5 Potential surfaces of pinyon species, with RCP 8.5 climate change scenarios with médium future horizon (2045-2069) (in hectares).
| Species | High | Medium | Low | Total |
|---|---|---|---|---|
| Pinus culminicola Andresen & Beaman | 20 667 | 146 930 | 4 295 105 | 4 462 702 |
| Pinus johannis M. f. Robert | 213 503 | 506 978 | 2 175 017 | 2 895 498 |
| Pinus nelsonii Shaw | 332 902 | 726 098 | 96 | 1 059 096 |
| Pinus pinceana Gordon | 430 863 | 1 050 628 | 3 955 678 | 5 437 168 |
The spatial distribution of the pinyon pines with this scenario (RCP 4.5), for the mid-2045-2069 horizon, together, showed significant surface decreases with respect to the current one. For example, P. pinceana would be reduced to 85.3 % and P. johannis 77.4 % (Figure 3). These data are consistent with the results of the work of Gómez and Arriaga (2007), who indicate that they are species vulnerable to climate change.
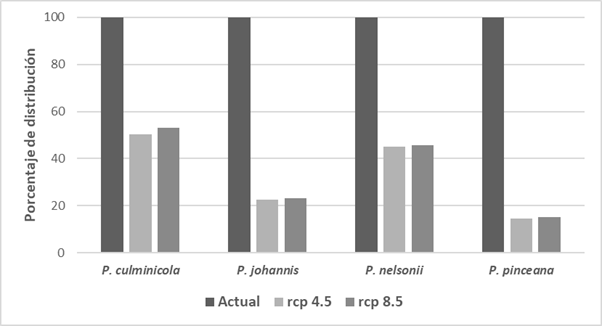
Porcentaje de distribución = Percentage distribution
Figure 3 Predicted changes of the species of pine trees with reference to the current potential distribution in the 2045-2069 horizon considering the RCP scenarios 4.5 and 8.5.
In the 8.5 RCP scenario in descending order of higher potential high and medium areas, P. pinceana, P. nelsonii, P. johannis and P. culminicola stand out. The first species would be located mainly, by its surface, in Coahuila, Nuevo León, Zacatecas, Guanjuato, San Luis Potosí, Tamaulipas, Hidalgo, Puebla and Querétaro. The second in Coahuila, Nuevo León, Zacatecas, Tamaulipas, Guanajuato, Chihuahua, San Luis Potosí, Hidalgo and Durango. The third in Coahuila, Nuevo León, Zacatecas, Puebla and San Luis Potosí; and the fourth, in Nuevo León, Coahuila, State of Mexico, Puebla, Zacatecas and Baja California.
Modeling with the RCP 8.5 emission scenario suggests losses similar to the RCP 4.5 scenario. As a whole, there were significant reductions with respect to the current potential of P. pinceana would be reduced to 85.0 % and P. johannis, 76.8 % (Figure 3).
Conclusions
The estimated changes in temperature and precipitation of the GFDL-CM3 model RCP 4.5 and RCP 8.5 will cause an alteration in the distribution of the pinyon pine trees for the 2045-2069 horizon, according to the results of this work. The potential distribution of the species under study is expected to be favored by climate change, as the estimates made show this.
Referencias
Aguirre, G. J. and J. F. Duivenvoorden. 2010. Can we expect to protect threatened species in protected areas? A case study of the genus Pinus in Mexico. Revista Mexicana de Biodiversidad 81: 875-882. [ Links ]
Araujo M., B., R. Pearson, W. Thuiller and M. Erhard. 2005. Validation of species- climate impact models under climate change. Global Change Biology 11: 1504-1513. Doi:10.1111/j.1365-2486.2005.01000.x. [ Links ]
Barrera Z., E., D. Granados S., R. L. Granados V. y M. Luna C. 2018. Caracterización de cuatro bosques de pino piñonero del estado de Zacatecas, México. Revista Chapingo Serie Ciencias Forestales y del Ambiente, 24(3): 275-296. Doi:10.5154/r.rchscfa.2017.03.018. [ Links ]
Berry, P. M., T. P. Dawson, P. A. Harrison and R. G. Pearson. 2002. Modeling potential impacts of climate change on the bioclimatic envelope of species in Britain and Ireland. Global Ecology and Biogeography 11: 453-462. Doi:10.1111/j.1466-8238.2002.00304.x. [ Links ]
Contreras L., J. A., D. Lazcano. and A. J. Contreras B. 2012. Herpetofauna of the Cerro El Potosi Natural Protected Area of Nuevo Leon, Mexico: Status of the Ecological and Altitudinal Distribution. Natural Areas Journal 32(4): 377-385. Doi: 10.3375/043.032.0405. [ Links ]
Davis, M. B. and R. G. Shaw. 2001. Range shifts and adaptative response to Quaternary climate change. Science, 292: 673-679. Doi:10.1126/science.292.5517.673. [ Links ]
Elith, J., C. Graham, R. Anderson, M. Dudik and S. Ferrier. 2006. Novel methods improve prediction of species' distributions from occurrence data. Ecography 29:129-151. Doi.org/10.1111/j.2006.0906-7590.04596.x. [ Links ]
Estrada C., A. E., J. A. Villareal Q., M. M. Salinas R., C. M. Cantú A. y H. González R. 2014. Coníferas de Nuevo León. Universidad Autónoma de Nuevo León, Facultad de Ciencias Forestales. Linares, NL, México.145 p. [ Links ]
Farjon, A. and T. B. Styles. 1997. Pinus (PINACEAE). Flora Neotropica, Monograph 75. Organization for Flora Neotropica. The New York Botanical Garden, New York, NY, USA. 291 p. [ Links ]
Favela L. , S. 2010. Population variation in the endemic Pinus culminicola detected by RAPD. Polibotánica. 30: 55-67. [ Links ]
Fernández E., A., J. A. Zavala H., R. Romero C., A. C. Conde Á. y R. I. Trejo V. 2015. Actualización de los escenarios de cambio climático para estudios de impactos, vulnerabilidad y adaptación. En: Atlas Climático Digital de México. Centro de Ciencias de la Atmósfera, Universidad Nacional Autónoma de México. Instituto Nacional de Ecología y Cambio Climático, Secretaría de Medio Ambiente y Recursos Naturales. INDAUTOR 04-2011-120915512800-203. http://atlasclimatico.unam.mx/AECC/servmapas/ (19 de enero de 2019). [ Links ]
Gernandt S., D. y J. A. Pérez de la R. 2014. Biodiversidad de Pinophyta (coníferas) en México. Revista Mexicana de Biodiversidad, Supl. 85:126-133. Doi:10.7550/rmb.32195. [ Links ]
Guevara M., C. E. y Arroyo C. 2016. Pendiente, escala: 1:4 000 000. Comisión Nacional para el Conocimiento y Uso de la Biodiversidad. Ciudad de México, México. http://www.conabio.gob.mx/informacion/gis/ (19 de enero de 2019). [ Links ]
Gómez M., L. and L. Arriaga. 2007. Modeling the effect of climate change on the distribution of oak and pine species of Mexico. Conservation Biology 21: 1545-1555. Doi:10.1111/j.1523-1739.2007.00814.x. [ Links ]
Instituto Nacional de Estadística y Geografía (Inegi) . 2018. Modelo Digital de Elevación. Escala 1:50 000. http://www.beta.inegi.org.mx/app/geo2/elevacionesmex/ (15 de octubre de 2018). [ Links ]
Instituto Nacional de Estadística y Geografía (Inegi). 2016. Conjunto de Datos Vectoriales de Uso de Suelo y Vegetación. Escala 1:250 000. Serie VI (Capa Unión), escala: 1:250 000. México. http://www.conabio.gob.mx/informacion/gis/ (25 de octubre de 2018). [ Links ]
Instituto Nacional de investigaciones Forestales y Agropecuarias - Comisión Nacional para el Conocimiento y Uso de la Biodiversidad (INIFAP-Conabio). 1995. Edafología. Catálogo de metadatos geográficos. Escala 1:1 000 000. México, D.F., México. n/p. [ Links ]
Martínez A., J. G., C. Sánchez C., R. Martínez G., G. Sánchez R., I. Trejo, A. Mora O. y E. Alanis. 2015. Primer Registro de Pinus Pinceana (Pinaceae) para Tamaulipas. Aspectos Ecológicos y Estructurales. Botanical Sciences 93: 357-260. Doi:10.17129/botsci.87. [ Links ]
Mateo R., G., M. de la Estrella, A. M. Felicísimo, J. Muñoz and A. Guisan. 2013. A new spin on a compositionalist predictive modelling framework for conservation planning: A tropical case study in Ecuador. Biological Conservation 160: 150-161. Doi:10.1016/j.biocon.2013.01.014. [ Links ]
Perry, J. 1991. The pines of Mexico and Central America. Timber Press. Portland, OR, USA. 231 p. [ Links ]
Phillips S., J. and M. Dudik. 2008. Modeling of species distributions with Maxent: new extensions and a comprehensive evaluation. Ecography 31:161-175. Doi:10.1111/j.0906-7590.2008.5203.x. [ Links ]
Phillips S., J. , R. P. Anderson and R. E. Schapire. 2006. Maximum entropy modeling of species geographic distributions. Ecological Modelling 190: 231-259. Doi: 10.1016/j.ecolmodel.2005.03.026. [ Links ]
Ríos, E., R. Hoogh y J. Navar. 2008. Ensayo de especies con pinos piñoneros en el nordeste de México. Revista Chapingo, Serie: Ciencias Forestales y del Ambiente 14(2): 97-104. [ Links ]
Ríos A., A., C. Alfonso C., V. Aguirre H., G. Ángeles P., M. M. Mendoza D., V. Rodríguez R., E. Roldán F. y R. Clarck T. 2016. Abundancia y distribución del género Pinus en Calpulálpam de Méndez, Sierra Juárez, Oaxaca. Madera y Bosques 22(3): 61-74. Doi:10.21829/myb.2016.2231457. [ Links ]
Rojas S., O. R., V. Sosa and J. F. Ornelas. 2012. Forecasting cloud forest in eastern and southern Mexico: conservation insights under future climate change scenarios. Biodiversity and Conservation 21: 2671-2690. Doi:10.1007/s10531-012-0327-x. [ Links ]
Romero, M., A. M. Luna. and E. García. 2000. Phenetic analysis of the Mexican Midland, pinyon pines, Pinus cembroides and Pinus johannis. Botanical Journal of the Linnean Society 133:181-194. Doi:10.1111/j.1095-8339.2000.tb01541.x. [ Links ]
Rosas C., M., D. Granados S., R. L. Granados V. y S. Esparza G. 2015. Clasificación y ordenación de bosques de pino piñonero del estado de Querétaro. Revista Mexicana de Ciencias Forestales 7 (33): 52-73. Doi.org/10.29298/rmcf.v7i33.90. [ Links ]
Rzedowski, J. 2006. Vegetación de México. 1ra. Edición digital, Comisión Nacional para el Conocimiento y Uso de la Biodiversidad. México. https://www.biodiversidad.gob.mx/publicaciones/librosDig/pdf/VegetacionMx_Cont.pdf (17 de enero de 2019). [ Links ]
Secretaría de Medio Ambiente y Recursos Naturales (Semarnat) 2010. Norma Oficial Mexicana NOM-059-SEMARNAT-2010, Protección ambiental - Especies nativas de México de flora y fauna silvestres - Categorías de riesgo y especificaciones para su inclusión, exclusión o cambio -Lista de especies en riesgo. Diario Oficial de la Federación. 30 de diciembre de 2010. México, D.F., México. 71 p. [ Links ]
Suzán A., H., G. Sánchez R., J. G. Martínez A., S. Villa M. and M. Franco. 2002. Population structure of Pinus nelsoni Shaw, and endemic pinyon pine in Tamaulipas, Mexico. Forest Ecology and Management 165: 193-203. Doi.org/10.1016/S0378-1127(01)00617-X. [ Links ]
Tebaldi, C., K. Hayhoe, J. M. Arblaster and G. A. Meehl. 2006. Going to the extremes:an intercomparison of model-simulated historical and future changes in extreme events. Climatic Change 79: 185-211. Doi:10.1007/s10584-006-9051-4. [ Links ]
Thuiller, W., N. Gassó, J. Pino and M. Vilá. 2012. Ecological niche and species traits: key drivers of regional plant invader assemblages. Biological Invasions 14: 1963-1980. Doi:10.1007/s10530-012-0206-0. [ Links ]
Treviño, E. J. 2018. Modelo de la distribución potencial de Pinus pinceana en el noreste de México. Ciencia UNANL. http://cienciauanl.uanl.mx/?p=7772 (20 de agosto 2018). [ Links ]
Received: June 08, 2019; Accepted: October 02, 2019
 Este es un artículo publicado en acceso abierto bajo una licencia Creative Commons
