


Services on Demand
Journal
Article
 text in
  English (pdf)
 Article in xml format
 Article references
 Send this article by e-mail
Indicators
-
 Cited by SciELO
 -
 Access statistics
Related links
-
 Similars in
SciELO
Similars in
SciELO
Share

 Permalink
Revista mexicana de ciencias forestales
Print version ISSN 2007-1132
Rev. mex. de cienc. forestales vol.9 n.50 México Nov./Dec. 2018
https://doi.org/10.29298/rmcf.v9i50.262
Articles
Density management diagram for the genus Pinus in the Pueblo Nuevo ejido, Durango State
1Facultad de Ciencias Forestales. Universidad Autónoma de Nuevo León, México.
A density management diagram (DMD) was developed for the genus Pinus, from a plot of land managed by the ejido Pueblo Nuevo in Durango, whose aim is the production of sawn timber. The data were obtained from the forest inventory, provided by UMAFOR 1008, El Salto, Durango, of 196 sampling sites of which the dasometric variables were estimated: number of trees per hectare N, dominant height H0, mean square diameter dg and volume V. The diagram was developed with two base equations, representing the mean square diameter dg and Volume V. The Hart-Becking IH Spacing Index was calculated in order to be used as a reference in cuts planning, the base equations were adjusted through the non-linear regression of the nls function in the statistical software R project 3.4.0. Rstudio 1.0.143, through an iterative process, the simultaneous adjustment of the equations was performed by the FIML (full information maximum likelihood) method. The equation system was simultaneously adjusted using the MODEL procedure of the SAS/ETS® statistical system. The goodness of adjustment of the statisticians gave a determination coefficient R2= 0.7074 and a mean square error RMSE = 2.7563 for the equation of dg and R2 = 0.9947, RMSE = 7.9114 for the Volume. The Hart Index isolines reached minimum and maximum values as a percentage of the density of 16 out of 56 respectively. A cutting scheme was proposed according to the production objective: wood with dimensions for sawmill.
Keywords: Mean square diameter; cutting scheme; nls function; Hart-Becking index; forest management; timber volume
Se desarrolló un diagrama de manejo de densidad (DMD) para el género Pinus en un predio bajo manejo del ejido Pueblo Nuevo, Durango, cuyo objetivo es la producción de madera para aserrío. Los datos se obtuvieron del inventario forestal de la Umafor 1008, en El Salto, Durango y consta de 196 sitios de muestreo, de los cuales se estimó el número de árboles por hectárea N, la altura dominante H0, el diámetro medio cuadrático dg y el volumen V. El diagrama se desarrolló con dos ecuaciones base, en las que se representó el diámetro medio cuadrático y el volumen. El Índice de espaciamiento de Hart-Becking IH, se calculó como referencia en la planeación de cortas; las ecuaciones base fueron ajustadas a través de la regresión no lineal de la función nls en el software estadístico R project 3.4.0. Rstudio 1.0.143, a través de un proceso iterativo; el ajuste simultáneo de las ecuaciones se realizó por el método de FIML (full information maximum likelihood). El sistema de ecuaciones fue ajustado simultáneamente mediante el procedimiento MODEL del sistema estadístico SAS/ETS®. La bondad de ajuste de los estadísticos arrojó un coeficiente de determinación R2 = 0.7074 y un error medio cuadrático RMSE = 2.7563 para la ecuación de dg y de R2 = 0.9947 y RMSE = 7.9114 para el volumen. Las isolíneas del Índice de Hart adquirieron valores mínimos y máximos en porcentaje de la densidad de 16 de 56, respectivamente. Se planteó un esquema de cortas de acuerdo al objetivo de producción: madera con dimensiones para aserrío.
Palabras clave: Diámetro medio cuadrático; esquema de cortas; función nls; Índice de Hart-Becking; manejo forestal; volumen maderable
Introduction
The orderly use of the resources offered by the forest, and seek the satisfaction of the needs demanded by today's society, without compromising the needs of goods and services of future generations, describes sustainable forest management (Aguirre, 2015). Throughout its history, Mexico as an independent country, has faced several changes, which have led to a Sustainable Community Forest Management (Trujillo, 2009). Forestry (silviculture), with a primary purpose of guaranteeing the supply of forest raw material for the national industry, emerged with great boom in the eighties (FAO, 2004).
Conceptually, density management allows the control of forest development, competition and forest regulation in order to achieve the specific objectives of forest management (Castedo-Dorado et al., 2009). Density is a reliable indicator of the occupation of trees at a given time and place; clearly and objectively, it represents the structure of the forest areas of greatest interest (Hernández et al., 2013). If density management is the main objective of foresters to achieve a desirable condition in the forest, a density management diagram (DMD) is one of the most effective methods of design, visualization and evaluation of alternative regimes in the management of mass density (Barrio and Álvarez, 2005). DMDs are a valuable tool for the planning of silvicultural treatments that guarantee an optimal occupation of the site, according to the proposed production purposes.
The usefulness of the DMD lies in the graphic manifestation of a rapid and simple way of the evolution of the forest mass and, with it, the comparison between the different silvicultural alternatives, based on the different ends of the stand, which makes it one of the most effective methods in the representation of the density of forest stands (Castedo-Dorado et al., 2007).
Structurally, a DMD is represented in a dimensional graph with quantitative relationships that are overlapped (Newton, 2003), in which the number of trees per hectare (N) is established in the axis of the ordinates, and the dominant height (H0) in the abscissa axis; a system of two equations that refer to the mean square diameter (dg) and the volume (V), in addition to a Thickness Index that, for this case study, was the Hart-Becking Index was used.
This index is defined as the ratio expressed in percentage, between the average distance of the stand trees and their dominant height, dn dl, in which it is assumed that the average distance is dependent on the distribution of the individuals in the terrain. The Hart-Becking index is used for the characterization of the density to be independent of the quality of site and age, and because the dominant height as part of the composition of the same, defines the cutting schemes from a biological point (Diéguez et al., 2009).
The main objective of this study was to develop a density management diagram, based on the Hart-Becking Spacing Index (IH), with the purpose of using it in the decision making of forest management in natural forests of genus Pinus, Pueblo Nuevo ejido, Durango.
Materials and Methods
Study area
The study was carried out in the Pueblo Nuevo ejido located southwest of the municipality of the same name in the state of Durango, Mexico (Figure 1).
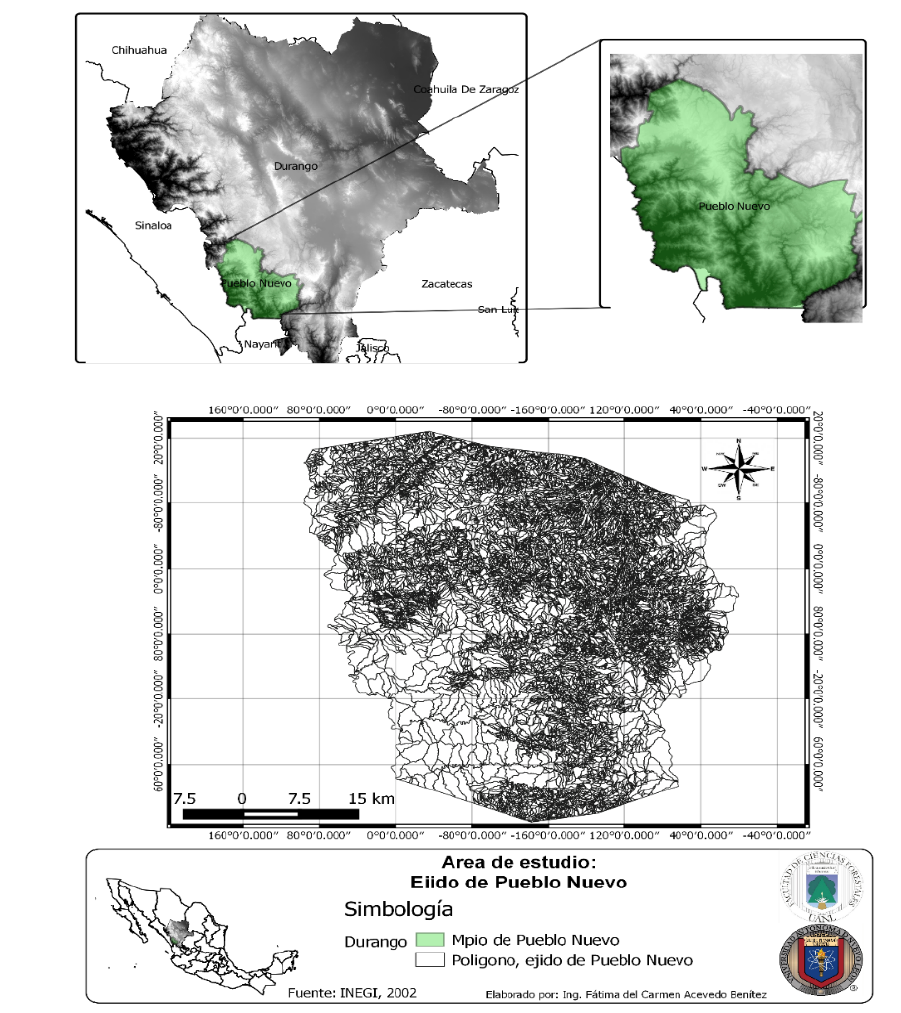
The natural forest that belongs to the ejido is made up of mixed pine-oak forest stands; however, for the present study only the data corresponding to the Pinus species present in the inventory areas were included.
The species of interest are Pinus cooperi C. E. White, P. durangensis Ehren, P. leiophylla Schltdl. & Cham., P. ayacahuite Ehren, P. teocote Schiede ex Schltdl., Quercus sideroxyla Humb. & Bonpl. and Arbutus spp. (Table 1).
Origen of the data
The data was provided by the Unidad de Manejo Forestal (UMAFOR) 1008 El Salto, Durango (Forest Management Unit (Umafor) 1008 El Salto, Durango). They refer to 196 plots of the forest inventory located in the Pueblo Nuevo ejido, Durango. According to Castedo-Dorado et al. (2007), the idea is to cover the maximum density existing in pure and regular pine stands.
From 1 000 m2 plots, the information regarding height (m) and normal diameter (cm) at 1.30 m high of each individual was taken, with a range of 7.5 to 45 cm and a minimum density of 100 trees ha-1 per plot, since the proportion of pines covers 90 % of the area of the sampling sites.
Mensuration estimations
For each selected plot, the following variables were estimated: number of trees per hectare (N), average diameter (DN), average height (H), mean square diameter (dg), dominant height (H0), basimetric area per hectare (G), total volume (V) and index of Hart-Becking (IH) whose mathematical expressions are shown in Table 2.
Table 2 Mathematical expressions of the estimated variables.
| Variable | Mathematical expression |
|---|---|
| Individual basimetric area |
|
| Tree total volume |
|
| Number of trees per hectarea |
|
| Mean height H |
|
| Basimetric area G |
|
| Mean square diameter dg |
|
| Volume V |
|
| Dominant height H0 |
|
| Mean diameter DN |
|
The descriptive statistics of the sampling plots is summarized in Table 3.
Table 3 Descriptive values of the variables of interest.
| Variable | Mean | Maximum | Minimum | SD |
|---|---|---|---|---|
| N (trees ha-1) | 559.39 | 1340 | 130 | 230.82 |
| dg (cm) | 21.01 | 45.81 | 11.58 | 5.10 |
| G (cm) | 18.26 | 107.11 | 4.51 | 9.13 |
| V (m3.ha-1) | 168.84 | 1219.805 | 20.62 | 108.2 |
| Dn (cm) | 18.95 | 45.24 | 10.48 | 4.82 |
| H (m) | 12.67 | 21.23 | 4.39 | 2.88 |
| H0 (m) | 18.81 | 25.25 | 7.33 | 3.26 |
| IH (%) | 26.62 | 56 | 16 | 7.59 |
Methodology
The methodology proposed by Barrio and Álvarez (2005) and Pérez et al. (2009); for the construction of a density management diagram (DMD) the following steps are followed:
Graphical representation of the number of trees per hectare (N) on the axis of the ordinates and the dominant height (H0) on the abscissa axis.
Thickness characterization index, in this case the Hart-Becking Index was chosen.
The Hart-Becking index is defined as the ratio between the average spacing of the trees and their dominant height (H0), expressed as a percentage; the average distance between trees depends on the theoretical distribution of these in the terrain that is assumed (Diéguez et al., 2009) according to the following formula:
Where:
IH = Hart-Becking Index expressed as a percentage (%)
K = Constant (4/3)0.25, under the assumption that it is a natural or three-tree distribution of the individuals in the forest, or if the distribution of the trees in the land assumes a square mesh (forest plantations), then the constant = 1.
N = Number of trees per hectarea
H0 = Dominant height per plot
3. A system of two non-linear equations.
The first proposed equation allows to predict the mean square diameter (dg), from the number of trees per hectare and the dominant height of the stand. This equation is based on the relationship between the average size of the trees, the density and an indicator of productivity.
The second equation estimates the productivity of the stand expressed as the relationship between the volume of mass and the volume of a representative tree (given by the product of the mean square diameter and the dominant height) and the number of feet per hectare.
Where:
dg = Mean square diameter (cm-2)
V = Mass volume (m3ha-1)
H0 = Dominant height (m)
N = Number of trees per hectarea
β0…β6 = Estimated parameters
Adjustment of equations
The DMD was built from the Hart-Becking Index, and two base functions, non-linear models that through an iterative process allow to estimate the parameters to make the representation of the graph.
The adjustment of the described models was done in the statistical software R Project 3.4.0. Rstudio 1.0.143 (R Core Team, 2017), with the nls function, which allows the iterative process to which initial starting values are added to estimate the values of β0... β6, based on a positive convergence of the process.
When performing the simultaneous adjustment of the base equations (2) and (3) as a first step, N and H0 function as exogenous variables (their values are determined completely independently of the system); V is an endogenous function (it depends on other variables, that is, the model tries to explain it) and dg is an endogenous instrumental variable (it appears on both sides of equality), due to the correlation between the components of the system (Pérez et al., 2011).
In order to evaluate the reliability of the model at a level of 95 %, the coefficient of determination of R2 adjusted and the square root of the mean square error RMSE (for its acronym in English) was estimated.
Where:
Y i = Observed value of the dependent variable
ŷ i = Predicted value of the dependent variable
y = Average value of the dependent variable
p = Number of parameters to be estimated in the adjustment
N = Number of data used in the adjustment
Due to the correlation of the components of the error existing in the variables that make up the system of the two base equations, a simultaneous adjustment of the nonlinear equations is necessary, which was achieved by means of the maximum likelihood estimation method of the FIML procedure (Full Information Maximum Likelihood). The system of equations was adjusted simultaneously using the MODEL procedure of the SAS / ETS® statistical system (SAS, 2004).
Graphic representation of DMD
Once the parameters of equations (2) and (3) have been estimated, it is possible to obtain the expressions that allow the values for the Hart-Becking Index IH, the quadratic mean diameter dg, and the volume of the V stand to be plotted.
1. The level of thickness of the mass is expressed by the Hart-Becking Index. The representation of the isolines results from clearing N from equation (1).
2. The representation of the isolines of the mean square diameter is made by means of equation (2) and is set to dg as a constant, N is cleared and values are assigned to the dominant height H0 for each value of the mean square diameter.
3. The isolines for the volume in the graph are derived from clearing the number of trees per hectare N of equation (3) and dominant height values are given for each value of volume V.
Results and Discussion
Stand data
The distribution of the data that represent a normal distribution for the adjustment of the density models is shown in Figure 2, with a mean square diameter that ranges from 11.5-45.5 cm and a dominant height that ranges from 7.3 to the 25.2 m

Adjustment parameters of the models
The adjustment parameters of the models used in the development of the DMD chart are shown below, in Table 4. The final formulas adjusted with the parameters are:
When inspecting it is posible to state that their fit was highly significant.
Table 4 Adjustment parameters of the models.
| Parameters | Estimated | Standard error | t value | Pr(>|t|) |
|---|---|---|---|---|
| β0 | 8.585482 | 2.0915 | 4.10 | *** |
| β1 | 0.87124 | 0.0721 | 12.08 | *** |
| β2 | -0.26779 | 0.0219 | -12.23 | *** |
| β3 | 0.000061 | 6.622e-6 | 9.15 | *** |
| β4 | 2.089923 | 0.0286 | 73.01 | *** |
| β5 | 0.864783 | 0.0402 | 21.53 | *** |
| β6 | 0.940937 | 5.456e-6 | 91.99 | *** |
***Probability = <0.001
Density management diagram for the genus Pinus in the Pueblo Nuevo ejido, Durango
The graphic representation of the Density Management Diagram is shown in Figure 3, in which the superposition of the key elements for the forest management of a stand through isolines allows to interpret the behavior of a forest mass, and facilitates the taking of decisions in silvicultural development. It takes the Hart-Becking Spacing Index as the first option and serves as the basis for the cut approach, since this index is independent of station quality.
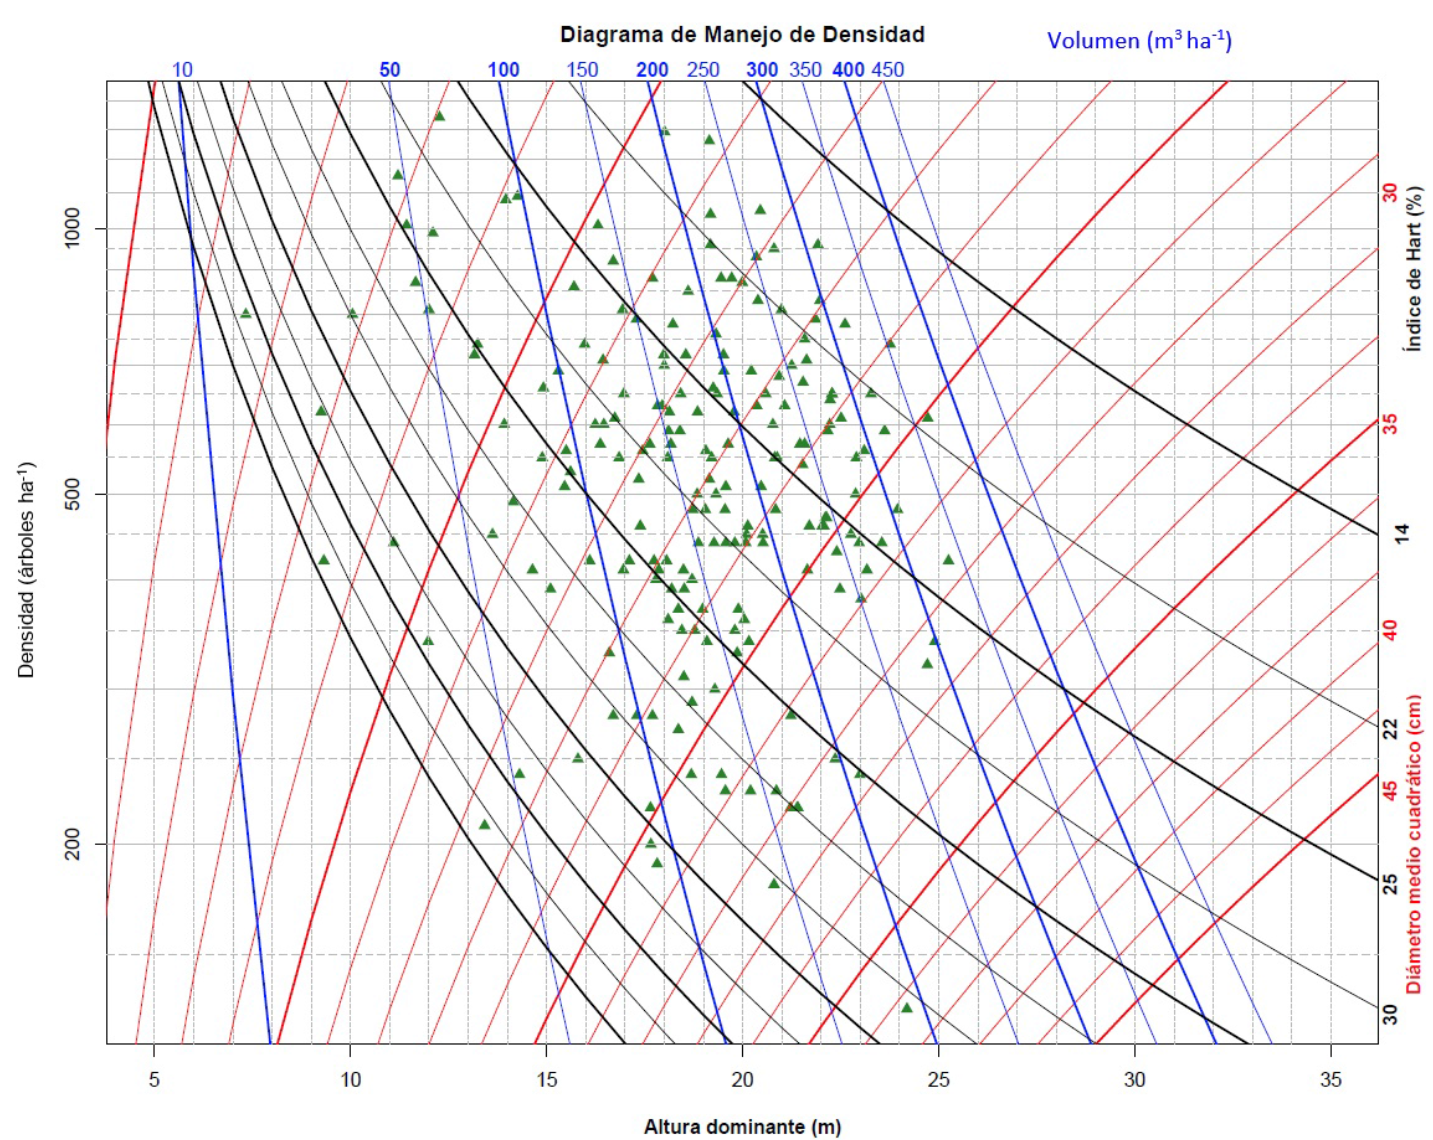
Densidad =Density; Diagrama de manejo de densidad = Density management diagram; Diámetro medio cuadrático = Mean square diameter.
Figure 1 Density management diagram for Pueblo Nuevo ejido, Durango.
The parameters obtained through the simultaneous adjustment of the equations were highly significant, which makes effective the decision making in the area of management when using DMD as a basis in the cutting scheme.
Practical application
The use of DMD allows the planning of different cutting schemes that best suit the development of the stand; in this case, it is to obtain timber with the right dimensions for sawing with a mean square diameter of 30 cm. Figure 4 illustrates the cutting scheme based on the Hart-Becking index in the form of an ascending staircase. Table 5 shows the production table derived from the diagram whose final objective is short to obtain 250 trees per hectare, making short every 3 or 4 meters without exceeding a thickness level of 30 %.
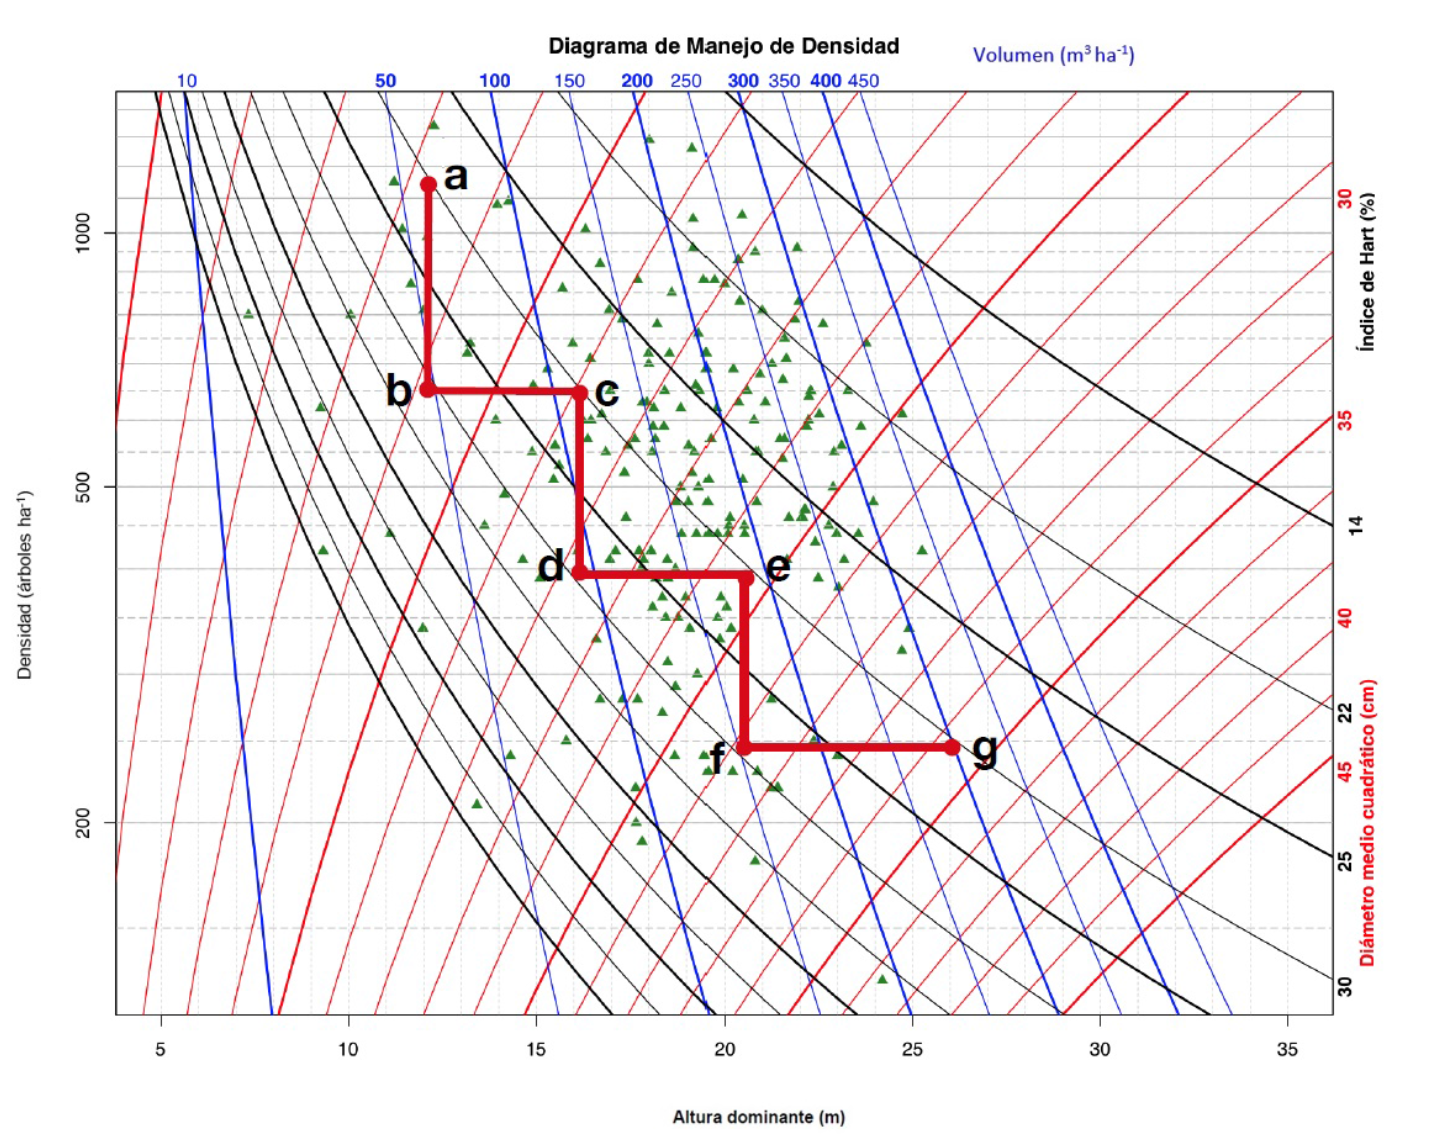
Densidad = Density; Diagrama de manejo de densidad = Density management diagram; Diámetro medio cuadrático = Mean square diameter.
Figure 4 Cutting sheme for the production of sawmill timber.
Table 5 Cutting sheme based on the DMD.
| Action | H0 | N | dg | V | IH | |||
|---|---|---|---|---|---|---|---|---|
| Before | After | Before | After | Before | After | |||
| a-b cutting | 12.5 | 850 | 500 | 12.7 | 18.5 | 64.85 | 108.96 | 31 |
| b-c cutting | 17 | 500 | 320 | 18.5 | 25.3 | 108.96 | 154.60 | 30 |
| c-d cutting | 20 | 320 | 250 | 25.3 | 30.2 | 154.60 | 188.60 | 30 |
| c. final g | 23 | 250 | - | 30.2 | - | 188.60 | - | 30 |
The development of the Diagrams of Management of Density based on the Index of Hart-Becking, allows to carry out the silvicultural planning in the determination and intensity of the cuts according to the level of desired spacing that avoid the high existence of the natural mortality and that allows an adequate occupation of the land in common agreement with what was concluded by Diéguez et al. (2009). This allows the end user to plan the cutting scheme based on two factors that are of great importance: i) the objective of cutting the stand at the end of the turn; and ii) the level of thickness desired for forest management.
According to Corral-Rivas et al. (2015) and Escobedo (2014), who developed a DMD for natural forest stands and proposed a cutting scheme based on the Reineke density index (IDRR) or maximum density, conclude that the Thickness Index ranges from 25 to 30 %, which conffirms the reliability of using only the Hart-Becking index as a basis for the production scheme.
Conclusions
The density management diagram in graphic form is a support for the density planning of the Pinus genus, whose production objective is the wood for sawing in ejido Pueblo Nuevo, Durango. The static models used for the development of the diagram facilitated the productivity planning of the ejido's management area.
The results obtained in the development of this study confirm that the graphic representation of a DMD can model the forest mass according to the different production objectives, from the superposition of lines visualized by the development scheme of a natural forest.
The dominant height that individuals have along with the Hart-Becking Index as a reference for adequate control of stand competence levels are the main variables in the determination of cuttings, since it allows the user to set their own evolution and propose the interventions in the moments in which it is considered opportune to obtain timber with good dimensions for sawmill.
Acknowledgements
To Conacyt for the financial support granted to the first author to study in the Master's program in Forest Sciences in the Facultad de Ciencias Forestales de la Universidad Autónoma de Nuevo León (the School of Forest Sciences of the Autonomous University of Nuevo Leon).
REFERENCES
Aguirre C., O. A. 2015. Manejo forestal en el siglo XX. Madera y Bosques 21 (número especial): 17-28. http://www.redalyc.org/articulo.oa?id=61743003002 (6 de mayo de 2017). [ Links ]
Barrio A., M. and J. G. Álvarez G. 2005. Development of a stand density management diagram for even-aged pedunculate oak stands and its use in designing thinning schedules. Forestry 78(3): 209-216. doi.org/10.1093/forestry/cpi033. [ Links ]
Castedo-Dorado, F., P. Álvarez-Álvarez, F. Crecente-Campo y M. Barrio-Anta. 2007. Consideración de la estabilidad de la masa en los diagramas de manejo de la densidad. Cuadernos de la Sociedad Española de Ciencias Forestales 23:63-74. [ Links ]
Castedo-Dorado, F., F. Crecente-Campo, P. Álvarez-Álvarez and M. Barrio-Anta. 2009. Development of a stand density management diagram for radiata pine stands including assessment of stand stability. Forestry 82(1): 1-16. doi.org/10.1093/forestry/cpm032. (5 de junio de 2016). [ Links ]
Corral-Rivas, S., J. G. Álvarez-González, J. J. Corral-Rivas, C. Wehenkel y C. A. López-Sánchez. 2015. Diagramas para el manejo de la densidad en bosques mixtos e irregulares de Durango, México. Bosque 36(3): 409-421. doi.org/10.4067/S0717-92002015000300008. (8 de agosto de 2016). [ Links ]
Diéguez A., U., A Rojo A., F. Castedo D., J. G. Álvarez G., M. Barrio A., F. Crecente C. y F. Sánchez R. 2009. Herramientas selvícolas para la gestión forestal sostenible en Galicia, Lugo, España. http://www.medioruralemar.xunta.es/fileadmin/arquivos/publicacions/herramientas_selvicolas.pdf (6 de septiembre de 2016). [ Links ]
Escobedo S., A. S. 2014. Diagrama de manejo de densidad para rodales naturales del ejido El Largo, Chihuahua. Tesis de Maestría. Facultad de Ciencias Forestales. Universidad Autónoma de Nuevo León. pp. 1-43. http://eprints.uanl.mx/4294/1/1080253739.pdf (17 de octubre de 2015). [ Links ]
Food and Agriculture Organization of the United States (FAO). 2004. Estado y Tendencias de la Ordenación Forestal en 17 Países de América Latina por Consultores Forestales Asociados de Honduras (FORESTA). Documentos de Trabajo sobre Ordenación Forestal. Documento de Trabajo FM/26. Servicio de Desarrollo de Recursos Forestales, Dirección de Recursos Forestales, FAO. Roma, Italia. http://www.fao.org/docrep/008/j2628s/J2628S00.htm#TopOfPage (25 de septiembre de 2015). [ Links ]
Hernández R., J., J. J. García M., H. J. Muñoz F., X. García C., T. Sáenz R. C. Flores L. y A. Hernández R. 2013. Guía de densidad para manejo de bosques naturales de Pinus teocote Schlecht et Cham. en Hidalgo. Revista Mexicana de Ciencias Forestales 4(19): 62-77. [ Links ]
Newton, P. F. 2003. Stand density management decision-support program for simulating multiple thinning regimes within black spruce plantations. Agriculture 38: 45-53. https://www.sciencedirect.com/science/article/pii/S0168169902001072 (24 de septiembre de 2015). [ Links ]
Pérez C., C., L. M. Rodríguez D., E. Fernández R., A. Merino y R. Rodríguez S. 2009. Diagramas de manejo de la densidad para plantaciones de Eucalyptus nitens Maid. en el norte de España con evaluación del carbono fijado en biomasa arbórea. In: Sociedad Española de Ciencias Forestales (ed.). 5º. Congreso Forestal Español Montes y sociedad: saber qué hacer. 21 a 25 de septiembre. Castilla y León, Ávila, España. pp. 2-13. doi.org/10.1007/s13398-014-0173-7.2 (2 de enero de 2017). [ Links ]
Pérez C., C., A. Merino and R. Rodríguez-S. 2011. A management tool for estimating bioenergy production and carbon sequestration in Eucalyptus globulus and Eucalyptus nitens grown as short rotation woody crops in north-west Spain. Biomass and Bioenergy 35(7): 2839-2851. doi.org/10.1016/j.biombioe.2011.03.020 (2 de enero de 2017). [ Links ]
R Core Team. 2017. R: A language and environment for statistical computing. R Foundation for Statistical Computing. Vienna, Austria. https://www.R-project.org/ (25 de septiembre de 2015). [ Links ]
Statistical Analysis System (SAS). 2004. SAS/ETS® 9.1 User’s guide. SAS Institute Inc. Cary, NC, USA n/p. [ Links ]
Trujillo B., J. M. 2009. El ejido, símbolo de la revolución mexicana. Problemas sociales y regionales en América Latina: Estudio de Caso. 101 p. http://www.pa.gob.mx/publica/rev_58/analisis/el%20ejido%20Jorge%20Martin%20Trujullo%20Bautista.pdf (6 de octubre de 2016). [ Links ]
Received: March 21, 2018; Accepted: September 17, 2018
 Este es un artículo publicado en acceso abierto bajo una licencia Creative Commons
