


Services on Demand
Journal
Article
 text in
  English (pdf)
 Article in xml format
 Article references
 Send this article by e-mail
Indicators
-
 Cited by SciELO
 -
 Access statistics
Related links
-
 Similars in
SciELO
Similars in
SciELO
Share

 Permalink
Revista mexicana de ciencias forestales
Print version ISSN 2007-1132
Rev. mex. de cienc. forestales vol.9 n.49 México Sep./Oct. 2018
https://doi.org/10.29298/rmcf.v9i49.171
Articles
Growth of Pinus greggii Engelm. under different routines of fertilization at the nursery
1Facultad de Ciencias Forestales. Universidad Juárez del Estado de Durango. México.
2Instituto de Silvicultura e Industria de la Madera. Universidad Juárez del Estado de Durango. México.
3Campo Experimental Valle del Guadiana. Instituto Nacional de Investigaciones Forestales, Agrícolas y Pecuarias. México.
Fertilizing the plant at the nursery favors its physiological and morphological condition, which contributes to improve its quality, a basic aspect to favor the survival and initial growth after planting. This research evaluated the effect of a controlled delivery fertilizer (Osmocote®), combined with three soluble fertilizers (Triple 19, Poly-feed® and Peters professional®) in fixed dose (200 ppm) and exponential (100, 200 y 300 ppm) in the growth and production costs of Pinus greggii at the nursery. Seven treatments were applied under an experimental randomized block design. At 134 days (4.5 months) of the fertilization trial started, the plant was 7.5 months old; at that time the height, diameter, biomass production of the root, aerial and total part, the Dickson quality index, the nutritional status and assimilation of N-P-K in the foliage of the plants and the costs of fertilization by treatment. Results indicate that treatments 1, 3 and 7 reacted better to the application of fertilizers in the assessed morphological variables; however, only treatments 3 and 7 had a better response to physiological variables, and of these, number 3 had the lowest cost due to the applied fertilization.
Key words: Plant quality; costs; soluble fertilizers; nutrition; Pinus greggii Engelm.; physiological variables; morphological variables
Fertilizar la planta en vivero favorece su condición fisiológica y morfológica, lo que contribuye a mejorar su calidad, aspecto fundamental para favorecer la supervivencia y crecimiento inicial después del plantado. En esta investigación se evaluó el efecto de un fertilizante de entrega controlada (Osmocote ®), combinado con tres fertilizantes solubles (Triple 19, Poly-feed ® y Peters professional ®) en dosis fija (200 ppm) y exponencial (100, 200 y 300 ppm) en el crecimiento y los costos de producción de Pinus greggii en vivero. Se aplicaron siete tratamientos bajo un diseño experimental de bloques al azar. A los 134 días (4.5 meses) de inició el ensayo de fertilización la planta tenía 7.5 meses de edad; en ese momento se tomaron la altura, el diámetro, la producción de biomasa de la raíz, de la parte aérea y total, el índice de calidad de Dickson, el estado nutrimental y la asimilación de N-P-K en el follaje de las plantas, así como los costos de fertilización por tratamiento. Los resultados indican que los tratamientos 1, 3 y 7 respondieron mejor a la aplicación de fertilizantes en las variables morfológicas evaluadas; sin embargo, solo los tratamientos 3 y 7 tuvieron mejor respuesta a las variables fisiológicas, y de ellos, el 3 fue el de menor costo debido a la fertilización aplicada.
Palabras clave: Calidad de planta; costos; fertilizantes solubles; nutrición; Pinus greggii Engelm.; variables fisiológicas; variables morfológicas
Introduction
For the plantations survival and satisfactory growth, it is necessary to use quality plant, which depends on its genetic origin, as well as on the characteristics of the morphological and physiological attributes developed during its production at the nursery (Landis et al., 2010). The former include the height of the aboveground part, the diameter of the root neck, the size and shape of the root system and the relationships between these variables (Prieto et al., 2009); the physiological refer to the content of lignin and carbohydrates, as well as the assimilation of nutrients, defined by their concentration and proportion of macro and micronutriments (Landis et al., 1989).
The application of fertilizers in nurseries is a common cultural practice, which contributes to obtain vigorous plant in less time and, in addition, to minimize costs (Landis et al., 2010). Nutrimental absorption is dynamic and depends on the balance between nutrients and growth patterns, and does not necessarily have a direct relationship with the concentration of the solutions (Román et al., 2001).
When fertilizers are applied in a soluble form, the assimilation of nutriments is fast, which allows a better management of nutrition, since it is more in line with the specific needs of the plant in each phase of cultivation (Peñuelas and Ocaña, 2000); on the other hand, the addition of controlled release fertilizers takes longer time to reflect and once applied they cannot be adjusted (Rose et al., 2004). The efficiency of fertilization to avoid losses is accomplished by fractionating the applied nutrients, mainly nitrogen and potassium (Carpenedo et al., 2016).
Fertilization should be based on the development of the plant in the nursery, since the required proportions of the three main macronutrients (NPK) vary depending on the growth phase, which would be: establishment phase, which ranges from germination to the appearance of the first true needles; it is followed by the rapid growth phase, when the seedling grows at an exponential rate and the stem approaches the target height; finally, the hardening phase that begins when the plant finishes growth of its aboveground part and the energy is redirected to growth in diameter and root (Dumroese et al., 2012).
Because each species may have a different response to the application of nutriments, particularly in species that demand high concentrations, it is necessary to know their particular needs (Bustos et al., 2008; Soriano, 2011). In the Guadiana Valley, state of Durango, Mexico, Pinus greggii Engelm. achieves rapid growth, in comparison with other species and is used in commercial forest plantation programs, since it also shows high tolerance to adverse soil and climate conditions (Prieto et al., 2006), so there is a need to study different aspects that favor its good management.
In addition to the technical aspects already described, it is important to evaluate the production costs of the nursery plant, as this concept often represents one of the main factors that affect the financial viability of plantations and reforestations (Hernández et al., 2015a). For this reason, and to contribute to the estimation of said viability, Hernández et al. (2015b) made a simulator that facilitates a detailed calculation of the unit costs of plant production in forest nurseries.
In this essay the answer in the growth of Pinus greggii in the nursery, was assessed in relation to the application of a fertilizer of controlled release, combined with three types of fertilizers soluble in water, in two doses. The aim was to identify a dose that improves production and increases the quality of the plants at the lowest possible cost of fertilization. It was hypothesized that combining a controlled release fertilizer, with at least one dose of water -soluble fertilizer, it is possible to favor the growth of plants and reduce production costs due to this input.
Materials and Methods
Study area
The essay was carried out in the nursery of the Facultad de Ciencias Forestales de la Universidad Juárez del Estado de Durango (School of Forest Sciences of the Juarez University of the State of Durango), located at coordinates 24°00'48.38" N and 104°41'03.64" W, at 1 860 m.
Production of the evaluated plant
Sowing was carried out the last week of November 2015, in expanded polystyrene trays of 77 cavities with 170 mL each; a mixture composed of 44 % base mix (54 % peat, 24.5 % vermiculite and 21.5 % perlite) and 56 % of composted pine bark was used as substrate.
In order to know the morphological condition of the plant at the beginning of the experimental stage, an assessment to a sample of 56 three-month old plants extracted at random from the experimental lot was made, previously to the application of the treatments; the average initial characteristics of the seedlings under evaluation were the following: 5.2 cm of height of the aboveground part, 0.82 mm of diameter to the neck and 0.175 g of dry weight.
The plant materials remained in a greenhouse for the first eight weeks, with a 720-gauge polyethylene plastic cover, protected against ultraviolet rays; the next four weeks grew in a 60 % shadow mesh environment, and finally, the last three weeks were out in the open. Table 1 shows the specific conditions of temperature, relative humidity and luminosity, which prevailed in the three conditions where the trial was developed. A Hobo® data logger U12-012 was used to record the reference variables.
Table 1 Environmental conditions prevailing during the development of the fertilization trial of Pinus greggii Engelm.
| Environmental condition |
Duration (weeks) |
Temperature (°C) |
Relative humidity (%) |
Luminous intensity (lum/ft²) |
|---|---|---|---|---|
| Greenhouse | 8 | 17.1 | 32.3 | 272.8 |
| 60 % Shade mesh | 4 | 24.2 | 42.4 | 286.2 |
| Outdoors | 3 | 24.2 | 44.4 | 646.5 |
Evaluated treatments and experimental design
During the preparation of the substrate, seven treatments were evaluated, all based on the incorporation of 6 kg m-3 of the controlled release fertilizer (from 8 to 9 months) Multicote® 18N - 6P2O5 - 12K2O + 2MgO + micro nutrients (Haifa Chemicals Ltd.). With the exception of treatment 1 (control), which only received irrigation water without fertilization, the other six treatments were supplemented with water-soluble fertilizers: Triple 19 (19 N -19 P205 -19 K2O), Poly-feed® (20 N -10 P205 -20 K2O) and Peters professional® (20 N -7 P205 -19 K2O), applied in fixed doses (200 ppm) and exponential (100, 200 and 300 ppm) (Table 2).
Table 2 Fertilization treatments evaluated during the experiment.
| Treatment | Fertilizer | N-P-K doses (ppm) Week 1-4 |
N-P-K doses (ppm) Week 5-8 |
N-P-K doses (ppm) Week 9-12 |
N-P-K doses (ppm) Week 13 |
N-P-K doses (ppm) Week 14 |
N-P-K doses (ppm) Week 15 |
|---|---|---|---|---|---|---|---|
| 1 | FEC+Water | 0-0-0 | 0-0-0 | 0-0-0 | 0-0-0 | 0-0-0 | 0-0-0 |
| 2 | FEC+Triple 19 | 200-88-166 | 200-88-166 | 200-88-166 | 200-88-166 | 200-88-166 | 200-88-166 |
| 3 | FEC+Triple 19 | 100-44-83 | 200-88-166 | 300-132-249 | 300-132-249 | 200-88-166 | 100-44-83 |
| 4 | FEC+Poly-feed® | 200-44-166 | 200-44-166 | 200-44-166 | 200-44-166 | 200-44-166 | 200-44-166 |
| 5 | FEC+Poly-feed® | 100-22-83 | 200-44-166 | 300-66-249 | 300-66-249 | 200-44-166 | 100-22-83 |
| 6 | FEC+Peters professional® | 200-30-158 | 200-30-158 | 200-30-158 | 200-30-158 | 200-30-158 | 200-30-158 |
| 7 | FEC+Peters professional® | 100-15-79 | 200-30-158 | 300-45-237 | 300-45-237 | 200-30-158 | 100-15-79 |
FEC = Controlled-release fertilizer (Multicote® 18N - 6P2O5 - 12K2O + 2MgO + micro nutriments, added to the substrate in 6 kg m-3 fixed doses for all treatments). Water-soluble fertilizers were applied in fixed and varying doses.
From the variation in the reception of luminosity by the position of the greenhouse, the essay was established under an experimental randomized block design. Each treatment had four blocks and the experimental unit consisted of a tray of 77 cavities of 170 mL; the selected plants were the 45 of the center.
The water-soluble fertilizers were applied for 15 weeks and their amounts were calculated based on the nitrogen concentration of each: 1) Fixed dose (200 ppm), permanently for 15 weeks; 2) Exponential dose, 100 ppm for the first four weeks; the next four, it was increased to 200 ppm. For four more weeks it was increased to 300 ppm; during the last three weeks of the experiment, the doses were reduced in the exponential treatments, adding 300, 200 and 100 ppm per week (Table 2). This allowed the doses to be equal in the fixed and exponential options. Between each dose change, to drain possible excess salts from previous fertilizations, the plant was just irrigated and not fertilized.
The water-soluble fertilizer was incorporated twice a week with a manual watering can; in each experimental unit (tray) 3.5 liters of water were added with the corresponding fertilizer solution. The pH of water was maintained between 5 and 6, and when it was higher than that interval it was adjusted with diluted hydrochloric acid in the irrigation water; pH was measured weekly with an Ohaus ST10 potentiometer.
Response variables
At 134 days (4.5 months) of starting fertilization, when the plants were 7.5 months old, ten plants of each experimental unit were randomly selected. From each one, the height of the aboveground part (cm) was recorded with a graduated ruler (cm); the diameter at the neck of the root (mm) with a 14388 SURTEK ® 122204 Trupper® vernier; total dry weight, the weight of the aboveground part and root were quantified with an Ohaus PA214 scale from the samples dried in an oven (FELISA® FE-291D) for 72 hours at 70 oC. With these variables, the Dickson quality index (ICD) was calculated and the concentration and content of N-P-K in the foliage of the plants was estimated with three samples composed of 5 g of needles per treatment.
The chemical analysis of the plant tissue was made in the Laboratorio de Fertilidad de Suelos y Química Ambiental del Colegio de Postgraduados Campus Montecillo, Texcoco, Estado de México (Soil Fertility and Environmental Chemistry Laboratory of the Montecillo Campus Postgraduate School, Texcoco, State of Mexico). The nitrogen content was obtained by the micro-Kjeldahl method (digestion with H2SO4), phosphorus by colorimetric determination with yellow vanadomolybdate complex and potassium with flame emission spectrophotometry, with a SprectrAA Atomic Absorption Spectrometer 220 Fast Sequential (Chapman y Pratt, 1979).
To establish if there were significant differences (p ≤ 0.05) in the morphological variables and to make the analysis of variance (ANOVA), the statistical package SAS® (Statistical Analysis System) version 9.0 (SAS, 2002) was used and when such differences were confirmed, the Tukey means test (α = 0.05) was performed (SAS, 2002).
The effect of the fertilization treatments on the nutritional status of the plants was evaluated by an ANOVA. Additionally, with the graphic vector method, these results were illustrated. The construction and interpretation of vector nomograms was made based on the methodology described by Haase and Rose (1995).
To evaluate the differences between the costs implied by the use of each fertilizer combination during plant growth, the cost of the Controlled Release Fertilizer incorporated in each treatment was considered, as well as the amount and cost of the water -soluble fertilizer, applied during each watering.
Results and Discussion
Morphological variables
The height of the plants showed a dispersion of data in a range of 29.1 to 31.6 cm with treatment 2 located in the upper statistical group (p <0.05) (Table 3). Rodríguez (2008) indicates that a plant with a stem height greater than 25 cm and a neck diameter smaller than 4 mm is more susceptible to wind damage; however, the NMX-AA-170-SCFI-2016 Mexican Standard (Secretaría de Economía, 2016) establishes that Pinus greggii, from six to eight months of age, must have a height of 25 to 30 cm, which coincides with the results obtained in the present investigation.
Table 3 Growth in height, diameter and Dickson’s Quality Index in Pinus greggii Engelm. at 134 days after starting fertilization.
| Treatment | Height (cm) |
Diameter (mm) | Dickson´s quality index |
|---|---|---|---|
| 1 | 31.3 ± 0.57 ab | 3.3 ± 0.04 b | 0.26 ± 0.0 a |
| 2 | 31.6 ± 0.53 a | 3.4 ± 0.05 ab | 0.24 ± 0.0 a |
| 3 | 31.1 ± 0.73 ab | 3.5 ± 0.05 a | 0.25 ± 0.0 a |
| 4 | 29.1 ± 0.55 b | 3.3 ± 0.03 b | 0.23 ± 0.0 a |
| 5 | 30.4 ± 0.64 ab | 3.4 ± 0.05 ab | 0.24 ± 0.0 a |
| 6 | 30.0 ± 0.49 ab | 3.2 ± 0.04 b | 0.22 ± 0.0 a |
| 7 | 30.2 ± 0.05 ab | 3.3 ± 0.05 b | 0.24 ± 0.0 a |
1 = FEC (Fast release fertilizer) + water; 2 = FEC+Triple 19, fixed dose; 3 = FEC + Triple 19, exponential dose; 4 = FEC+Poly-feed®, fixed dose; 5 = FEC+Poly-feed®, exponential dose; 6 = FEC+Peters professional®, fixed dose; 7 = FEC + Peters professional®, exponential dose. Values with different letters for the same variable, indicate significant statistical differences (p <0.05), according to Tukey.
For neck diameter, data dispersion was 3.2 to 3.5 mm, -with significant differences (p <0.05) between treatments- with treatment 3, which is located in the upper statistical group and the only one to reach the established standards in the NMX-AA-170-SCFI-2016 for Pinus greggii (Secretaría de Economía, 2016), which states that plants in the nursery must reach a minimum diameter of 3.5 mm to ensure satisfactory performance in the field (Table 3). In several species, it has been found that the diameter at the neck of the root is one of the main morphological characteristics that determines the adaptation of plants in the plantation site (Tsakaldimi et al., 2013). In the case of the Dickson Quality Index, the values oscillated between 0.22 and 0.26, without significant differences between treatments (p <0.05) (Table 3).
In the production of root biomass, the control plant was the best, despite having only been fed with the Controlled Release Fertilizer, with 26.8 % more biomass with respect to the average value of the other treatments (Table 4); Apparently, plants having insufficient nutriment supply developed more root in their search, which also recorded Soriano (2011), who described that the highest dose of fertilization in Pinus patula Schiede ex Schltdl. & Cham and P. devoniana Lindl. it disadvantaged the growth of the radical system. According to Berendse et al. (2007), as well as Camargo and Rodríguez (2006), under low fertility, the plants allocate greater biomass to the root to favor their growth.
Table 4 Production of biomass of the root, the aboveground part and total in Pinus greggii Engelm. at 134 days after starting the fertilization.
| Treatment | Root dry weight (g) | Aboveground part dry weight (g) | Total dry weight (g) |
|---|---|---|---|
| 1 | 0.79 ± 0.02 a | 2.51 ± 0.07 b | 3.30 ± 0.08 ab |
| 2 | 0.59 ± 0.02 b | 2.85 ± 0.10 ab | 3.44 ± 0.12 ab |
| 3 | 0.58 ± 0.01 b | 3.04 ± 0.10 a | 3.62 ± 0.11 a |
| 4 | 0.58 ± 0.01 b | 2.60 ± 0.08 b | 3.18 ± 0.09 b |
| 5 | 0.58 ± 0.02 b | 2.75 ± 0.09 ab | 3.33 ± 0.10 ab |
| 6 | 0.56 ± 0.02 b | 2.63 ± 0.07 b | 3.19 ± 0.09 b |
| 7 | 0.58 ± 0.01 b | 2.82 ± 0.08 ab | 3.40 ± 0.09 ab |
1 = FEC (Fast release fertilizer) + water; 2 = FEC+Triple 19, fixed dose; 3 = FEC + Triple 19, exponential dose; 4 = FEC+Poly-feed®, fixed dose; 5 = FEC+Poly-feed®, exponential dose; 6 = FEC+Peters professional®, fixed dose; 7 = FEC + Peters professional®, exponential dose. Values with different letters for the same variable, indicate significant statistical differences (p <0.05), according to Tukey.
Treatment 3 is also outstanding in the biomass of the stem and the needles; Rendón et al. (2001) indicate that the biomass generated in this part of the plant is related to its growth, since the stem works as a support and conduction organ, while the needles help metabolic activity. As the biomass of the aerial part is generally greater than that of the root, the same treatment produced the highest total biomass (Table 4).
Jacobs et al. (2009) evaluated in Quercus ilex Lour the response to the application of nitrogen in doses of 0 to 200 mg per plant and concluded that a dose of 150 mg may be enough for the growth of plants; however, a higher dose may represent the optimal value to be loaded nutritionally, without toxicity. On the other hand, Prehn et al. (2013) observed that in Guindilla trinveris Gillies ex Hook. & Arn., when applying nitrogen in increasing doses, the aerial biomass increased up to 2 g plant-1 and from then onwards, it decreased until causing its death. In the case of this essay, none of the doses had a toxic effect.
Physiological variables
The seedlings with the highest amount of nutrient reserves were those of treatment 3 while the control showed the lowest value (Table 5).
Table 5 Absolute and relative values of nutritional status of nitrogen, phosphorus and potassium of Pinus greggii Engelm. in response to fertilization routines.
| Treatment | Dry weight (mg plant-1) |
Concentration (%) |
Content (mg plant-1) |
||||
|---|---|---|---|---|---|---|---|
| N | P | K | N | P | K | ||
| 1 | 0.59 (100) | 1.202 (100) | 0.167 (100) | 0.846 (100) | 7.081 (100) | 0.984 (100) | 4.980 (100) |
| 2 | 0.83 (141) | 2.369 (197) | 0.247 (148) | 1.053 (124) | 19.770 (279) | 2.060 (209) | 8.788 (176) |
| 3 | 0.84 (142) | 2.423 (202) | 0.254 (152) | 1.191 (140) | 20.302 (287) | 2.130 (216) | 9.979 (200) |
| 4 | 0.72 (121) | 2.463 (205) | 0.224 (134) | 0.976 (115) | 17.629 (249) | 1.604 (163) | 6.987 (140) |
| 5 | 0.78 (132) | 2.459 (204) | 0.222 (133) | 1.150 (136) | 19.092 (270) | 1.724 (175) | 8.930 (179) |
| 6 | 0.73 (124) | 2.383 (198) | 0.226 (135) | 1.058 (125) | 17.446 (247) | 1.652 (168) | 7.742 (155) |
| 7 | 0.76 (129) | 2.499 (208) | 0.226 (135) | 1.226 (145) | 19.050 (269) | 1.720 (175) | 9.346 (188) |
1 = FEC (Fast release fertilizer) + water; 2 = FEC+Triple 19, fixed dose; 3 = FEC + Triple 19, exponential dose; 4 = FEC+Poly-feed®, fixed dose; 5 = FEC+Poly-feed®, exponential dose; 6 = FEC+Peters professional®, fixed dose; 7 = FEC + Peters professional®, exponential dose. Values expressed in parenthesis were calculated as (VR/VT) × 100. VR = Reference value of treatment 1; VT = Value of each treatment.
When taking as a reference the nutritional status of treatment 1, vector nomograms show that the six treatments with the addition of water-soluble fertilizer had a high consumption of nitrogen, phosphorus and potassium, which is a condition that should favor the fertilization routines, since this translates into plants with greater nutritional reserves (Uscola et al., 2015). Treatments 3 and 7 show the best ratio content-concentration-total dry biomass (Figure 1).
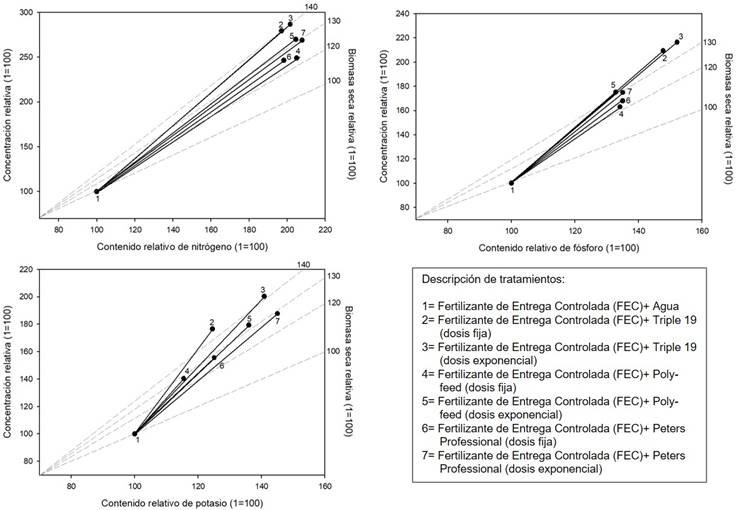
Concentración relativa = Relative concentration; Biomasa seca relativa = Relative dry biomass; Contenido relativo de nitrógeno = Relative nitrogen content; Contenido relativo de fósforo = Relative phosphorus content; Contenido relativo de potasio = Relative content of potassium; Descripción de tratamientos =Description of treatments: 1 = FEC (Fast release fertilizer) + water; 2 = FEC+Triple 19, fixed dose; 3 = FEC + Triple 19, exponential dose; 4 = FEC+Poly-feed®, fixed dose; 5 = FEC+Poly-feed®, exponential dose; 6 = FEC+Peters professional®, fixed dose; 7 = FEC + Peters professional®, exponential dose.
Figure 1 Nomograms of nutritional status of nitrogen, phosphorus and potassium of Pinus greggii Engelm., 134 days after fertilization began.
A high content of nutrient reserves, especially nitrogen, in Abies religiosa (Kunth) Schltdl. & Cham. has been related to a competitive advantage of plants in places with low fertility (Navarro et al., 2013). The same manifested Sanchez et al. (2017) and Buendía et al. (2017) when working with Pinus greggii and Pinus leiophylla Schl. & Deppe, respectively.
In low -fertility conditions, inducing high contents of nutrient reserves to favor a better performance in the field is the premise of the exponential fertilization regime proposed by Timmer (1996), which is supported based on nursery results; however, in later studies, it is convenient to evaluate if in fact the plants with better nutritional status have a favorable performance in the field, since in spite of the existence of works of this nature that show positive results with the exponential fertilization regime, as for example those of Salifu and Timmer (2003) and Duan et al. (2013), there are others such as Everett et al. (2007) that indicate the opposite. Such controversy could be based on what was indicated by Burgess (1991), who pointed out that in some species the addition of fertilizer in an exponential way does not always satisfy the needs of the plants, mainly during the initial stages of growth when the demands of nutrients are high and the supply is scarce.
Analysis of fertilization costs
2.587 kg of Controlled Release Fertilizer were used in the 2 156 individuals under evaluation (28 trays with 77 plants each); the average price per kilogram was $ 50.00 Mexican pesos. On the other hand, the total water-soluble fertilizer used during the trial was 1.638 kg of Triple 19 (19 N -19 P205 -19 K2O), 1.560 kg of Poly-feed® (20 N -10 P205 -20 K2O) and 1.560 kg of Peters professional® (20 N -7 P205 -19 K2O), each applied in eight trays of 77 plants (equivalent to two treatments per type of fertilizer), with an average cost per kilogram of Mx$21.59, Mx $36.80 and Mx $86.36, respectively. Table 6 shows the average cost per plant due to the alternative fertilization used in each treatment during the 4.5 months that the trial lasted; also, an example of the cost of fertilization for 100 000 plants is presented.
Table 6 Cost of Controlled Release Fertilizer and water-soluble fertilizer applied, by plant and for 100 000 plants, in the evaluated treatments.
| Treatment | Cost of FEC used per plant (Mx$) |
Cost of FH used per plant (Mx$) |
Cost of FEC and FH used per plant (Mx$) |
Total cost of FEC+FH for 100 000 plants (Mx$) |
|---|---|---|---|---|
| 1 | 0.051 | 0.00 | 0.051 | 5 100 |
| 2 | 0.051 | 0.057 | 0.108 | 10 800 |
| 3 | 0.051 | 0.057 | 0.108 | 10 800 |
| 4 | 0.051 | 0.093 | 0.144 | 14 400 |
| 5 | 0.051 | 0.093 | 0.144 | 14 400 |
| 6 | 0.051 | 0.218 | 0.269 | 26 900 |
| 7 | 0.051 | 0.218 | 0.269 | 26 900 |
1 = FEC (Fast release fertilizer) + water; 2 = FEC+Triple 19, fixed dose; 3 = FEC + Triple 19, exponential dose; 4 = FEC+Poly-feed®, fixed dose; 5 = FEC+Poly-feed®, exponential dose; 6 = FEC+Peters professional®, fixed dose; 7 = FEC + Peters professional®, exponential dose. Values expressed in parenthesis were calculated as (VR/VT) × 100. VR = Reference value of treatment 1; VT = Value of each treatment. Costs are based on average quotes for 2017.
The treatments with the highest cost due to fertilization were number 6 and 7, with $ 0.269 Mexican pesos per plant. On the other hand, treatment 1 was the least expensive, lacking water-soluble fertilizer, with $ 0.051 per plant, followed by treatments 2 and 3 with $ 0.108. If these costs are extrapolated to a production of 100 000 plants, there would clearly be significant statistical differences; treatment 1 would cost 5 100 Mexican pesos, while treatments 2 and 3 would cost 10 800 Mexican pesos and would increase in the other treatments, until reaching the most expensive treatments (6 and 7), with 26 900 Mexican pesos (Table 6), in a fertilization period of 4.5 months.
From the technical point of view, treatments 3 and 7 were within the same statistical group and are the two treatments that responded best to the application of controlled delivery fertilizer supplemented with water soluble fertilizers in terms of the morphological and physiological variables evaluated. However, from the financial point of view, the fertilization in treatment 3 costs less than half of the cost of treatment 7, so, taking into account both aspects, treatment 3 is considered the most recommended.
Conclusions
The nutrition of the plants was favored with the application of controlled delivery fertilizer Multicote®, supplemented with hydrosoluble fertilizers Triple 19 in exponential doses (treatment 3) or with Peters professional® in exponential doses (treatment 7); however, treatment 3 stands out because it implies less than half the cost with respect to treatment 7.
Treatment 1 only based on controlled delivery fertilizer produced high values in the morphological variables; but the results in the physiological values show deficiencies in the assimilation of nutrients.
Acknowledgements
The authors wish to express their gratitude to the Facultad de Ciencias Forestales de la Universidad Juárez del Estado de Durango (Faculty of Forest Sciences of the Juarez University of the State of Durango), for the facilities granted for the development of the trial in the facilities of the nursery.
REFERENCES
Berendse, F., H. de Kroon and W. G. Braakhekke. 2007. Acquisition, use and loss of nutrients. In Pugnaire, F. I and F. Valladares (eds.): Functional plant ecology. CRC Press. Boca Raton, FL USA. pp. 259-283. [ Links ]
Buendía V., M. V., M. A. López L., V. M. Cetina A. and L. Diakite. 2017. Substrates and nutrient addition rates affect morphology and physiology of Pinus leiophylla seedlings in the nursery stage. iForest. 10: 115-120. doi: 10.3832/ifor1982-009. [ Links ]
Burgess, D. 1991. Western hemlock and Douglas-fir seedling development with exponential rates of nutrient addition. Forest Science 37: 54-57. [ Links ]
Bustos, F., M. González, P. Donoso, V. Gerding, C. Donoso y B. Escobar 2008. Efecto de distintas dosis de fertilización de liberación controlada (Osmocote®) en el desarrollo de plantas de coigue, raulí y ulmo. Revista Bosque 29(2):155-161. [ Links ]
Camargo R., I. D. y N. Rodríguez L. 2006. Nuevas perspectivas para el estudio de la asignación de biomasa y su relación con el funcionamiento de plantas en ecosistemas tropicales. Acta Biológica Colombiana 11(Supl.1): 75-87. http://www.scielo.org.co/scielo.php?script=sci_arttext&pid=S0120-548X2006000300006 (20 de enero 2018). [ Links ]
Carpenedo A, S., M. Machado A., E. Benítez L., G. Gómez-de O. y F. Da Silva C. 2016. Volumen de contenedores y dosis de fertilizante de liberación controlada en el crecimiento de plantas de Cabralea canjerena producidas en vivero. Revista Bosque 37(2):401-407. [ Links ]
Chapman, H. D. y P. F. Pratt.1979. Métodos de análisis para suelos, plantas y aguas. Editorial Trillas. México, D.F., México. 195 p. [ Links ]
Duan, J., C. Xu, D. F. Jacobs, L. Ma, H. Wei, L. Jiang and J. Ren. 2013. Exponential nutrient loading shortens the cultural period of Larix olgensis seedlings. Scandinavian Journal of Forest Research 28(5): 409-418. [ Links ]
Dumroese, R. K., R. Jacobs y D. F. Wilkinson. 2012. Fases de cultivo: Establecimiento y crecimiento rápido. In: Contardi, L.; Gonda, H. (coords.). Producción de plantas en viveros forestales. Consejo Federal de Inversiones, Universidad Nacional de la Patagonia San Juan Bosco, Centro de Investigación y Extensión Forestal Andino Patagónico. Buenos Aires, Argentina. pp. 133-142. [ Links ]
Everett, K. T., B. J. Hawkins and S. Kiiskila. 2007. Growth and nutrient dynamics of Douglas-fir seedlings raised with exponential or conventional fertilization and planted with or without fertilizer. Canadian Journal of Forest Research 37: 2552-2562. [ Links ]
Haase, D. L. and R. Rose. 1995. Vector analysis and its use for interpreting plant nutrient shifts in response to silvicultural treatments. Forest Science 41:54-66. [ Links ]
Hernández D., J. C., J. A. Prieto R., G. Pérez V., Ch. Wehenkel, M. Pompa G., R. Lara V. y M. J. González G. 2015a. Manual del usuario del simulador para estimar costos en plantaciones forestales y reforestaciones (SIMCOPLAN) (versión v.1). Instituto de Silvicultura e Industria de la Madera. Universidad Juárez del Estado de Durango. Durango, Dgo., México. 49 p. [ Links ]
Hernández D., J. C. , J. A. Prieto R., G. Pérez V., Ch. Wehenkel, M. Pompa G., R. Lara V., C. Luján Á. y J. M. Olivas G. 2015. Manual del usuario del simulador de costos de producción de planta en viveros (SIMCOVIV) (Versión v.1). Instituto de Silvicultura e Industria de la Madera. Universidad Juárez del Estado de Durango. Durango, Dgo., México. 17 p. [ Links ]
Jacobs, D. F., K. F. Salifu y J. A. Oliet. 2009. Sobrecarga exponencial de nutrientes para la optimización de la fertilización en vivero de plantas de Quercus ilex L. In: Memorias del 5°. Congreso Forestal Español. Sociedad Española de Ciencias Forestales. Madrid, España. pp. 1-11. [ Links ]
Landis, T. D., R. W. Tinus, S. E. McDonald and J. P. Barnett. 1989. Seedling nutrition and irrigation. Vol 4. The container tree nursery manual. Agricultural Handbook 674. USDA Forest Service Washington, DC USA. 132 p. [ Links ]
Landis, T. D. , R. K. Dumroese and D. L. Haase. 2010. Seedling processing, storage, and outplanting. Vol 7. The container tree nursery manual. Agricultural Handbook 674. USDA Forest Service. Washington, DC USA. 200 p. [ Links ]
Navarro S., J.L., J.J. Vargas H., A. Gómez G., L.M. Ruíz P. y P. Sánchez G. 2013. Morfología, biomasa y contenido nutrimental en Abies religiosa con regímenes diferentes de fertilización en vivero. Agrociencia 47(7):707-721. [ Links ]
Peñuelas R., J.L. y L. Ocaña B. 2000. Cultivo de plantas forestales en contenedor. Mundi-Prensa. Madrid, España. 190 p. [ Links ]
Prehn, D., C., C. Bonomelli R. y R. San Martín. 2013. Efecto de la fertilización en Guindilla trinervis en su hábitat natural y en invernadero. Revista Bosque. 34(2):243-252. [ Links ]
Prieto R., J. A., E. Merlín B. y M. A. Perales de la C. 2006. Establecimiento de plantaciones para el cultivo de árboles de navidad en clima semiárido. Desplegable Técnica No. 7. Campo Experimental Valle del Guadiana. INIFAP. Durango, Dgo., México. 6 p. [ Links ]
Prieto R., J. A. , J. L. García R., J. M. Mejía B., S. Huchín A. y J. L. Aguilar V. 2009. Producción de planta del género Pinus en vivero en clima templado frío. Campo Experimental Valle del Guadiana INIFAP. Publicación Especial Núm. 28. Durango, Dgo., México. 49 p. [ Links ]
Rendón A., B., S. Rebollar D., J. Caballero N. y M. A. Martínez A. 2001. Plantas, cultura y sociedad. Estudios sobre la relación entre seres humanos y plantas en los albores del siglo XXI. http://investigacion.izt.uam.mx/maph/plantas1.pdf (15 de febrero 2017). [ Links ]
Rodríguez T., D. A. 2008. Indicadores de calidad de planta forestal. Mundi-Prensa. México, D. F., México. 156 p. [ Links ]
Román J., A. R., J. Vargas H., G. A. Baca C., A. Trinidad S. y M. P. Alarcón B. 2001. Crecimiento de plántulas de Pinus greggii Engelm. en respuesta a la fertilización. Ciencia Forestal en México 26(89):19-43. [ Links ]
Rose, R., D. L. Haase y E. Arellano. 2004. Fertilizantes de entrega controlada: potencial para mejorar la productividad de la reforestación. Revista Bosque 25 (2): 89-100. doi: 10.4067/S0717-92002004000200009. [ Links ]
Salifu, K. F. and V. R. Timmer. 2003. Optimizing nitrogen loading of Picea mariana seedlings during nursery culture. Canadian Journal of Forest Research 33: 1287-1294. [ Links ]
Sánchez V., O., V. M. Cetina A., M. A. López L. y L. I. Trejo T. 2017. Efecto del sistema de producción de Pinus greggii Engelm. var. australis en vivero sobre su desarrollo morfofisiológico en campo. Agroproductividad 10(8):59-64. [ Links ]
Statistical Analysis System. (SAS) 2002. SAS/STAT Computer Software. Release 9.0. SAS Institute Inc. Cary, NC USA. 5121 p. [ Links ]
Secretaría de Economía. 2016. Certificación de la operación de viveros forestales. NMX-AA-170-SCFI-2016. Diario Oficial de la Federación. 3 de noviembre de 2016. Ciudad de México, México. 190 p. [ Links ]
Soriano E., G. B. 2011. Efecto de fertilizaciones de N, P y K en la calidad de planta de P. patula y P. devoniana en vivero. Tesis de Maestría en Ciencias. Colegio de Posgraduados. Montecillo, Texcoco, Edo. de Méx., México. 78 p. [ Links ]
Timmer, V. R. 1996. Exponential nutrient loading: a new fertilization technique to improve seedling performance on competitive sites. New Forests 13:275-295. [ Links ]
Tsakaldimi, M., P. Ganatsas, and D. F. Jacobs. 2013. Prediction of planted seedlings survive of five Mediterranean species based on initial seedling morphology. New Forests 44: 327-339. [ Links ]
Uscola, M., K. F. Salifu, J. A. Oliet, and D. F. Jacobs. 2015. An exponential fertilization dose-response model to promote restoration of the Mediterranean oak Quercus ilex. New Forests 46: 795-812. [ Links ]
Received: December 15, 2017; Accepted: July 05, 2018
 Este es un artículo publicado en acceso abierto bajo una licencia Creative Commons
