


Services on Demand
Journal
Article
 text in
  English (pdf)
 Article in xml format
 Article references
 Send this article by e-mail
Indicators
-
 Cited by SciELO
 -
 Access statistics
Related links
-
 Similars in
SciELO
Similars in
SciELO
Share

 Permalink
Revista mexicana de ciencias pecuarias
On-line version ISSN 2448-6698Print version ISSN 2007-1124
Rev. mex. de cienc. pecuarias vol.14 n.3 Mérida Jul./Sep. 2023 Epub Sep 08, 2023
https://doi.org/10.22319/rmcp.v14i3.6175
Articles
Prediction of the chemical composition of pig feces and ileal digesta by near-infrared reflectance spectroscopy (NIRS)
a Universidad Nacional Autónoma de México. Facultad de Estudios Superiores Cuautitlán, México.
b Instituto Nacional de Investigaciones Forestales, Agrícolas y Pecuarias, CENID-Fisiología y Mejoramiento Animal, Km 1 Carretera a Colón, 76280 Ajuchitlán, Querétaro, México.
c Universidad Autónoma de Querétaro. Facultad de Ciencias Naturales, Querétaro, México.
Near-infrared reflectance spectroscopy (NIRS) allows the estimation of the chemical composition of various samples (ingredients, animal products, etc.); however, there is little information on its use with samples of swine ileal digesta (ID) or feces (F). Therefore, the objective was to develop prediction equations based on the partial least squares method to predict the chemical composition of the ID and F through NIRS. 110 ID and 202 F samples from digestibility experiments were used, their spectra were obtained and a multivariate model was used to develop the prediction method. The variables analyzed in ID were: crude protein (CP), leucine (Leu), lysine (Lys) and threonine (Thr) and in F: dry matter (DM), CP and energy (E). The DI values were: PC: R2 0.98, standard error of calibration (SEC) 0.330, standard error of prediction (SEP) 0.640; Leu: R2 0.95, SEC 0.040, SEP 0.102; Lys: R2 0.93, SEC 0.077, SEP 0.143; Thr: R2 0.67, SEC 0.209, SEP 0.187. F values were: PC: R2 0.98, SEC 0.95, SEP 1.19; E (kcal/kg): R2 0.94, SEC 60.8, SEP 95.3; MS: R2 0.87, SEC 0.83, SEP 1.15. The results show that the calibration robustness (SD/SEP) was good for PC, 3.34, Leu 2.07 and Lys 2.48 and fair for Thr 1.94, the prediction (RPD) was good for PC 2.11 in ID. In F the R2 were high for PC 0.98 and E 0.94. The highest robustness was for PC 5.59 and its prediction was excellent 4.16 and good for E 2.53. It is concluded that NIRS can predict PC in ID and PC and E in F. In order to improve the estimation of amino acids in ID, the causes affecting the robustness of the calibrations should be explored.
Keywords Prediction; Protein; Energy; Ileal; Fecal
La espectroscopia de reflectancia en el infrarrojo cercano (NIRS) permite estimar la composición química de diversas muestras, (ingredientes, productos de origen animal, etc.); sin embargo, existe poca información de su uso con muestras de digesta ileal (DI) o heces (H) de cerdo; por lo que el objetivo fue desarrollar ecuaciones de predicción basadas en el método de cuadrados mínimos parciales para predecir la composición química de DI y H a través de un NIRS. Se utilizaron 110 muestras de DI y 202 de H de experimentos de digestibilidad, obteniéndose su espectro y mediante un modelo multivariado se desarrolló el método de predicción. Las variables analizadas en la DI fueron: proteína cruda (PC), Leucina (Leu), lisina (Lys) y treonina (Thr) y en las H: materia seca (MS), PC y energía (E). Los valores en DI fueron: PC: R2 0.98, error estándar de calibración (SEC) 0.330, error estándar de predicción (SEP) 0.640; Leu: R2 0.95, SEC 0.040, SEP 0.102; Lys: R2 0.93, SEC 0.077, SEP 0.143; Thr: R2 0.67, SEC 0.209, SEP 0.187. En H fueron PC: R2 0.98, SEC 0.95, SEP 1.19; E (kcal/kg): R2 0.94, SEC 60.8, SEP 95.3; MS: R2 0.87, SEC 0.83, SEP 1.15. Los resultados muestran que la robustez de la calibración (DE/SEP) fue buena para PC, 3.34, Leu 2.07 y Lys 2.48 y regular para Thr 1.94, la predicción (RPD) fue buena para PC 2.11 en la DI. En H las R2 fueron altas para PC 0.98 y E 0.94. La mayor robustez fue para PC 5.59 y su predicción fue excelente 4.16 y buena para E 2.53. Se concluye que el NIRS puede predecir la PC en la DI y la PC y E en H. Para mejorar la estimación de aminoácidos en DI deben explorarse las causas que afectan la robustez de las calibraciones.
Palabras clave Predicción; Proteína; Energía; Ileal; Fecal
Introduction
Pig farms are increasingly obliged to improve their production efficiency as they are estimated to emit 9 % of total greenhouse gas emissions from livestock production; 27.4 % of this total is contributed by excreta, which is composed of 70.1 % methane and 29.9 % nitrous oxide1. Nitrous oxide can be reduced by improving feed efficiency and thus decreasing nitrogen excretion2. In this respect, the greatest mitigation potential is found in the semi-technified system, which is the result of an improvement in herd efficiency1, although such a decrease in nitrogen excretion can be brought about in any system by improving the accuracy of feed formulation3.
One tool to achieve this objective is the determination of the digestibility of the raw materials and diets used to feed pigs, especially in a production system such as the Mexican one, which depends on a wide variety of raw materials, unlike the corn-soybean meal system used in some countries such as the United States and Brazil. However, developing these studies is time-consuming and costly, mainly because of the laboratory analyses that must be performed. The National Institute for Research on Forestry, Agriculture, and Livestock (Instituto Nacional de Investigaciones Forestales, Agrícolas y Pecuarias, INIFAP) has conducted several studies on ileal digestibility of amino acids and total protein and energy4. Therefore, the ileal digesta and stool samples from these studies were used to generate the calibration model based on the partial least squares method to estimate the chemical composition of the ileal and stool contents in a near-infrared equipment.
The near infrared belongs to the electromagnetic spectrum, which is divided into regions according to the length of the emitted waves, the near infrared region (NIRS) is comprised between the wavelengths of 780 to 2,500 nm, and is characterized because its radiation does not modify the structure of matter, but produces vibration of its atoms, hence its wide use in industry and animal production5,6. H, C, N, and O atoms form the functional groups C-H, N-H and O-H, which absorb part of the emitted energy and reflect part of it, creating absorption bands. The proportion and quantity of these functional groups found in the sample make its spectrum unique7; so NIRS can accurately predict the chemical composition of scanned samples. However, before using it as a tool to predict the chemical composition of a sample, it is necessary to obtain prediction models for each type of sample and analyte to be analyzed. This process consists in associating the spectral information with the values obtained in the laboratory8. Therefore, the objective of the present work was to obtain prediction models in a NIRS apparatus to estimate the crude protein, lysine, threonine, and leucine content in ileal digesta, as well as the dry matter, protein, and energy content in pig feces.
Material and methods
The study was carried out at the National Center for Research on Animal Physiology and Improvement (Centro Nacional de Investigación en Fisiología y Mejoramiento Animal, CENID-Fisiología), in Ajuchitlán Querétaro, Mexico. Ileal digesta and stool samples were obtained from previously performed experiments9-15, ileal and fecal digestibility of dry matter (DM), energy (E), and crude protein (CP), and ileal digestibility of amino acids were determined (AA). In all experiments, the guidelines of the CIOMS16 and the Mexican Official Standard for the production, care, and use of laboratory animals were respected17.
Animals, cages, and sample collection
All pigs were housed in individual metabolic cages equipped with feeders, nipple water dispensers, and feces collection trays, all feed was in the form of meal and is described in the references cited; pigs were fed at 2.5 times their maintenance DE requirements18. The facility has a temperature control system which was maintained at 19 ± 2 °C. Ileal digesta samples were freeze-dried, and feces samples were dried in a forced-air oven at 55 °C for 48 h. Subsequently, freeze-dried digesta samples were ground through a 0.5 mm mesh, and dried stool samples, were through a 1 mm mesh in a laboratory mill (Arthur H. Thomas Co. Philadelphia, PA).
Laboratory analysis
Dry matter and crude protein analyses were performed according to AOAC official methods 934.01 and 976.0519. The digestibility markers used in the experiments were determined for chromium oxide according to Fenton20 and titanium oxide according to Myers21. The AA were determined by AOAC19 method No. 994.12, which consists of hydrolyzing the samples at 110 °C for 24 h in 6 mol/L HCl. Amino acid analysis was performed according to Henderson22 or Csapó23. Energy analyses were carried out in an adiabatic calorimetric pump (1281, Parr, Moline, IL).
Procedure for obtaining samples in NIRS equipment
The samples were placed in a quartz cup and scanned with a Nicolet 6700 FT-IR spectrophotometer (Thermo Fisher Scientific, Inc); the spectra were generated with the OMNIC™ software. The spectra were obtained in the near infrared (NIR) region (1000-2500 nm); the data absorbance was expressed as the logarithm of the reciprocal of R "(log 1/R)", where R= reflectance. The spectra thus generated were fed with the values obtained in the laboratory. The multivariate statistical model used was partial least squares, the first or second derivative, and the Savitzky-Golay filters with the TQ Analyst v8™ software. The variables entered in TQ Analyst v8 were: dry matter, protein, energy, and amino acid content. Calibration was performed with 2/3 of the samples, and validation, with 1/3, either for stool sample or ileal content. The selection of the best predictive model was based on the minimization of the standard error of prediction (SEP) and of the standard error of cross-calibration (SECV), and the maximization of the coefficient of determination (R2). In order to evaluate The predictive power of the calibration model was assessed considering the index known as RPD, i.e., the predictive deviation ratio. The predictive power of the calibration is considered as follows: if the RPD is less than 1.5, the calibration is not useful; if the RPD is between 1.5 and 2.0, the calibration may distinguish between low and high values; if the RPD is between 2.0 and 2.5, the calibration has possibilities to make quantitative predictions; if the RPD is between 2.5 to 3.0, the calibration prediction is good, and if RPD is greater than 3.0, the calibration leads to excellent predictions (Williams, 2003) quoted by Saeys24. Samples with differences of over 2.5 standard deviations were considered "outliers" and eliminated from the study.
Scanning of samples
Ileal digesta: A total of 119 ileal digesta samples were used. The mathematical analysis utilized was partial least square (PMS). The mathematical treatment was 1,4,13,6 (the numbers represent the degree of the derivative, the width of the interval over which the derivative is calculated, the smoothness level, and the order level of the polynomial).
Feces: A total of 222 samples were utilized. The statistical model used was the partial least square (PMS), and the mathematical treatment utilized was 1,4,11,5 (see explanation above).
Graphs. The graphs were made using the "ggplot2"(25) and "patchwork"(26) packages of R software27.
Results

Calibration for ileal digesta analysis
A total of 119 samples were used, of which 9 were eliminated because they were considered to be "outliers" according to the aforementioned criteria. Thus, the models were developed over 110 samples.
Protein. The mean and standard deviation (SD) for protein were 15.57 ± 2.15, ranging from 11.1 to 20.8 (Table 1). The coefficient of determination R2 was 0.98, the calibration standard error (SEC), cross-validation standard error (SECV) and prediction standard error (SEP) were 0.330, 1.020 and 0.640, respectively. Its RPD was 2.11 and the SD/SEP ratio was 3.34 (Table 2, Figure 2A).
Table 1 Statistics of the analyzed nutrients in ileal digestaa
| Item | Protein | Leucine | Lysine | Threonine |
|---|---|---|---|---|
| N | 110 | 110 | 110 | 110 |
| Mean | 15.57 | 0.85 | 0.58 | 0.71 |
| SDb | 2.15 | 0.21 | 0.29 | 0.36 |
| minimum | 11.1 | 0.33 | 0.17 | 0.32 |
| maximum | 20.8 | 1.31 | 1.82 | 2.13 |
aThe values represent the percentage content of the nutrient in the dry matter, except for energy, which is expressed in Kcal/kg.
bSD = standard deviation.
Table 2 Results of analyte calibrations in the ileal digesta
| Calibration | First | Second | ||||
|---|---|---|---|---|---|---|
| Parameter | Protein | Leucine | Lysine | Threonine | Lysine | |
| R2a | 0.98 | 0.95 | 0.93 | 0.67 | 0.92 | |
| SECb | 0.330 | 0.040 | 0.077 | 0.209 | 0.070 | |
| SECVc | 1.020 | 0.123 | 0.217 | 0.230 | 0.137 | |
| SEPd | 0.640 | 0.102 | 0.143 | 0.187 | 0.115 | |
| RPDe | 2.11 | 1.70 | 1.31 | 1.57 | 2.08 | |
| SD/SEPf | 3.34 | 2.07 | 2.00 | 1.94 | 2.48 | |
aCoefficient of determination; bStandard error of calibration; cStandard error of cross-calibration; dStandard error of prediction; eRatio of the standard deviation to the standard error of the cross-calibration; fRatio of the standard deviation to the SEP (SD/SEP).
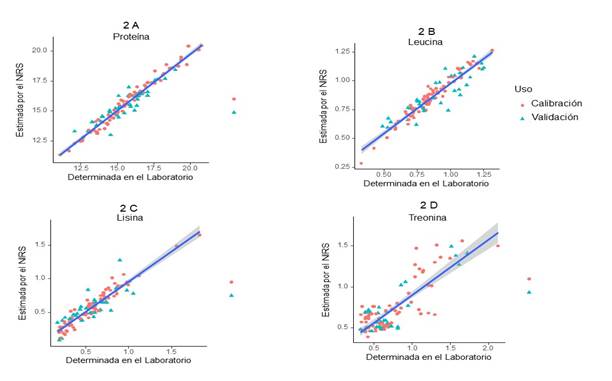
Table 2 reports the values of the equations
Figure 2 Relationship between the predicted values by NIRS and those determined in the laboratory for ileal digesta
Leucine. The mean and the standard deviation were 0.85 ± 0.21, with a range of 0.33 to 1.31 (Table 1). The coefficient of determination R2 was 0.95. The values for SEC were 0.040; for SECV, 0.123, and for SEP, 0.102. The results obtained for RPD were 1.70, and for the SD/SEP ratio, 2.07 (Table 2, Figure 2B).
Lysine. The mean and the standard deviation were 0.58 ± 0.29, with a range of 0.17 to 1.82. The coefficient of determination R2 was 0.93. The values were 0.077 for SEC, 0.217 for SECV, 0.143 for SEP, and 1.31 for RPD, and the SD/SEP ratio was 2.00.
In order to improve the lysine prediction model, a second calibration was performed for lysine only. The SD/SEP and RPD statistics improved, and there was a minimal decrease (one percentage point) in R2. The mean standard deviation, and the minimum and maximum values were the same as described in the previous paragraph; therefore, the coefficient of determination (R2) was 0.92. The results were 0.070 for SEC, 0.137 for SECV, and 0.115 for SEP. The result obtained for RPD was 2.08, and 2.48 for SD/SEP. (Table 2, Figure 2C).
Threonine. The mean and standard deviation for threonine were 0.71 ± 0.36, with a range of 0.32 to 2.13 (Table 1). The coefficient of determination R2 was 0.67. The values of SEC, SECV and SEP were 0.209, 0.230 and 0.187, respectively. Its RPD was 1.57, and the SD/SEP ratio, 1.94 (Table 2, Figure 2D).
Calibration for fecal analysis
Of the 222 samples, 20 considered "outliers" were eliminated. Table 3 shows summary statistics generated by NIRS.
Table 3 Statistics of the analyzed nutrients in the fecesa
| Item | Protein | Energy | Dry matter |
|---|---|---|---|
| N | 202 | 202 | 202 |
| Mean | 20.05 | 4444 | 93.43 |
| SD | 6.65 | 269 | 2.48 |
| Minimum | 4.50 | 3684 | 85.83 |
| Maximum | 29.20 | 4966 | 97.50 |
aThe values represent the percentage content of the nutrient in the dry matter, except for energy, which is expressed in Kcal/kg.
bSD= Standard deviation.
Protein. Its mean and standard deviation were 20.05 ± 6.65, respectively, with a range of 4.5 to 29.2 (Table 3). Its coefficient of determination R2 was 0.98. The value of SEC was 0.950; that of SECV was 1.600, and that of SEP was 1.190. The statistics for RPD and SD/SEP were above 4, i.e., of 4.16 and 5.59, respectively (Table 4, Figure 3A).
Table 4 Results of analyte calibrations in the feces
| Parameter | Protein | Energy | Dry matter |
|---|---|---|---|
| R2a | 0.98 | 0.94 | 0.87 |
| SECb | 0.950 | 60.8 | 0.830 |
| SECVc | 1.600 | 106.3 | 1.390 |
| SEPd | 1.190 | 95.3 | 1.150 |
| RPDe | 4.16 | 2.53 | 1.78 |
| SD/SEPf | 5.59 | 2.82 | 2.16 |
aCoefficient of determination; bStandard error of calibration; cStandard error of cross-calibration; dStandard error of prediction; eRatio of standard deviation to the standard error or cross-calibration; fRatio of the standard deviation to the SEP (SD/SEP).

Table 4 reports the values of the equations.
Figure 3 Relationship between the predicted values by the NIRS and those determined in the Laboratory for the feces
Energy. The mean and standard deviation were 4,444 ± 269, ranging from 3,684 to 4,966 (Table 3). The coefficient of determination R2 was 0.94. The results for errors were 60.8 for SEC, 106.3 for SECV, and 95.3 for SEP. The results obtained for RPD were 2.53, and 2.82 for SD/SEP (Table 4, Figure 3B).
Dry matter. The mean and standard deviation were 93.43 ± 2.48, with a range of 85.83 to 97.50 (Table 3). The coefficient of determination R2 was 0.87; the values of SEC, SECV, and SEP were 0.830, 1.390, and 1.150, respectively. Its RPD was 1.78, and the SD/SEP ratio was 2.16 (Table 4, Figure 3C).
Discussion
The basis of the spectroscopy technique is based on the interaction of light with the molecular composition of matter; in the near infrared (wavelengths between 800 and 2,500 nanometers), energy causes the bonds to excite and vibrate in two ways: shortening (high energy) or bending (low energy). This can be understood as follows: molecules are a set of atoms joined by bonds, and each bond vibrates at a certain frequency that depends on the chemical group involved in it; therefore, the energy of an incident light ray will be absorbed when its frequency is identical to the natural frequency of the intermolecular bond7. Thus, the arrangement of chemical bonds in a sample makes the spectra unique28. The organic bonds (C-H, N-H, O-H) react at different wavelengths and react at different wavelengths (C-H, N-H, O-H): O-H bonds react in the region between 1,450 nm and 1,900 nm; N-H bonds react in the region between 2,080 to 2,220 nm and 1,560 to 1,670 nm, and C-H bonds react in the region between 1,100, 1,600, 1,700-1,800, 2,000, and 2,200-2,400 nm7,29,30.
Protein and aminoacids
This is the first work in which the NIRS technology was used to predict protein and amino acid content in ileal digesta in pigs. The results obtained show that, based on the R2 statistic = 0.97 and the RPD value of 2.11, the calibration for crude protein is acceptable for predicting ileal digesta composition. These values are in agreement with those indicated by Saeys24, who report that the calibration to estimate pig excreta N had a R2= 0.89 and an RPD above 3.0, suggesting that NIRS can predict crude protein content. According to the RPD statistic (1.70, 1.31, and 1.57), the lysine and leucine concentration prediction is unreliable, but the calibration obtained can be used to estimate their concentration in the ileal digesta. However, in the case of threonine, the results were not favorable, as the calibration and prediction values obtained and the RPD (R2=0.67, SEP=1.87, and RPD=1.57) suggest that this is a poorly performing calibration and therefore it is not recommended. The low reliability of threonine prediction may be due to its richness in endogenous ileal protein losses, given that mucin is rich in threonine and mucin secretion is modulated by several dietary factors such as fiber and antinutritional factors31,32. Thus, the concentration of threonine is more variable than that of the amino acids lysine and leucine; this argument is supported by the ability of NIRS to predict amino acid content in wheat (213 samples), barley (185 samples), and corn (258 samples)33, since the variability in amino acid content in these samples is lower than in ileal digesta. The prediction was improved in the (second) calibration, in which only lysine was included; this was attributed to the fact that the correlations obtained were only for that amino acid ⸻a similar situation to that reported by Owens et al34, who predicted more than 20 wheat traits and obtained good predictions for only a few of them, including protein. The results of the present work for predicting stool protein content were superior to or equal to those obtained in previous studies35-38.
The range of crude protein values in pig feces (45 to 292 g/kg) is higher than that reported in previous works35,36,38, due to the diets used in them; for example, in the study by Bastianelli36, the samples came from a single experimental diet, whereas in the present study they came from several experiments and, consequently, from different diets. However, the greater variation in the data of the present work makes the resulting calibration more robust; this can be seen in the R2, which is higher than those reported in those other works (0.98 vs 0.84, 0.88, and 0.89)35,36,38) and indicates that the calibration was excellent. According to Saeys24 calibration can be used to predict the crude protein content of the stools. This is reflected in the results of the present study, where the error for prediction was 11.9 g/kg, a lower value than those reported in other studies. In addition, the calibration is considered to have an RPD statistic value of 4.15, which is higher than the value of 3 recommended by Saeys24, which indicates that the prediction is accurate and reliable.
Gross energy
The energy prediction is achieved thanks to the organic C-H bond absorption bands present in the scanned samples and corresponds to those bonds present in the carbohydrates, lipids, and protein of the food. Carbohydrates present in the feed constitute the main fraction of the pigs’ diet, and are classified into sugars (mono and disaccharides), oligosaccharides, and polysaccharides (starch and non-starch polysaccharides (NSP)). Most of the disaccharides and starch are digested and absorbed in the small intestine as shown by the work of Reis et al10; while the pig's digestive enzymes do not hydrolyze NSP, and therefore their degradation is carried out by the microflora of the cecum and colon through fermentation39.
The dietary protein source varies in its amino acid content according to the pig's stage of production. For example, piglets consume mainly animal sources such as whey proteins, fish, animal plasma, etc., which are highly digestible. As the pig’s digestive system matures, vegetable proteins (mainly from soybean meal and other oilseeds) increase until only vegetable proteins are used, their digestibility being more variable than that of carbohydrates or fats40. In ileal digesta samples, these bonds correspond mostly to the undigested bonds of the consumed feed and to the endogenous losses contributed by the animal's organism41. Substrates not absorbed in the small intestine reach the large intestine and are fermented by the microbiota or excreted in the feces42. In the case of amino acids, they can be used for microbial protein synthesis or fermented and used as a source of energy43. Therefore, the C-H bonds in the feces correspond mainly to the bonds in the microbiota and the fermentation products produced by it.
The results obtained in the calibration to predict energy were excellent; the R2 was 0.94, which indicates an excellent calibration that can be used in the prediction of the energy content of feces24. The results of the present study are consistent with other studies37,38. In addition, the robustness of the energy prediction (RPD of 2.52) means that quantitative predictions are possible.
The results regarding the predictive ability of stool protein and energy content are similar to those of Cruz-Conesa44, whose objective was to develop predictive models to estimate the chemical composition of the feces of three different poultry species: broilers, layers, and turkeys. These authors44 reported that their calibrations accounted for over 93 % of the variation, and the RPDs were greater than 3.7, concluding that NIRS is capable of estimating feces' protein and energy content.
Dry matter
The chemical composition of the samples is affected by the collection site (ileal or fecal), since, although most of the water is reabsorbed in the small intestine, the large intestine is where the digesta is dehydrated45; therefore, the feces had a higher dry matter content.
The moisture content of the samples has a direct impact on the generation of the spectrum, as water increases the absorption of light producing a higher absorption in the whole spectrum, on the other hand, the solid particles cause the light to be reflected and thus to reduce the absorption and generate higher peaks. For example, the region between 1,450 nm and 1,900 nm corresponds to the O-H chemical bonds present in water; consequently, there are more pronounced peaks in this region.
The coefficient of determination of the calibration for dry matter R2 was 0.87, which indicates that the calibration is accurate and reliable for determining the dry matter content in ileal samples according to Saeys24, with a calibration error of 8.3 g/kg DM. On the other hand, the prediction error was 11.5 g/kg, and the RPD was 1.78; this value indicates that a quantitative approximation of the dry matter in the feces samples is possible24. The relatively low prediction values obtained for dry matter compared to protein and energy values result from the fact that the scanned samples were from experiments that had previously been analyzed for digestibility, and, therefore, the samples had been stored. Although the samples were stored correctly, they may have become rehydrated with ambient moisture. This argument is supported by the work of Garnsworthy et al46, who evaluated 156 wheat grain samples and compared the dry matter values obtained by NIRS on the previously dehydrated samples versus the dry matter values obtained on the samples that were dehydrated at the time of scanning, lower values were observed in the previously dehydrated samples. Another factor is that the variation of the laboratory analysis of the dry matter was narrow (2.48 %); this small variation means that, when the samples are hydrated, they easily fall out of the calibrated range, affecting the results.
Conclusions and implications
It is concluded that NIRS can be used as a rapid and reliable analytical tool for predicting crude protein content of ileal digesta and crude protein and energy content of feces. In order to improve the estimation of amino acid content in ID, possible causes affecting the robustness of the calibrations should be explored The use of NIRS represents a reduction in the cost of experiments and less time to generate the results of the chemical content of the samples.
Acknowledgments
This study was partially funded by the National Institute for Research on Forestry, Agriculture, and Livestock (Instituto Nacional de Investigaciones Forestales, Agrícolas y Pecuarias) and the Autonomous University of Querétaro (Universidad Autónoma de Querétaro).
REFERENCES
1. Gerber PJ, Steinfeld H, Henderson B, Mottet A, Opio C, Dijkman J, et al. Enfrentando el cambio climático a través de la ganadería - Una evaluación global de las emisiones y oportunidades de mitigación. Roma: FAO; 2013. [ Links ]
2. Milgen JV, Dourmad JY. Concept and application of ideal protein for pigs. J Anim Sci Biotechnol 2015;6(1):1-11. [ Links ]
3. Andretta I, Pomar C, Rivest J, Pomar J, Lovatto PA, Neto JR. The impact of feeding growing-finishing pigs with daily tailored diets using precision feeding techniques on animal performance, nutrient utilization, and body and carcass composition. J Anim Sci 2014;92:3925-3936. [ Links ]
4. Rentería FJA, Gómez RS, López HLH, Ordaz OG, Anaya EAM, Mejía GCA, et al. Principales aportes de la investigación del INIFAP a la nutrición porcina en México: retos y perspectivas. Rev Mex Cienc Pecu 2021;12:79-110. [ Links ]
5. Givens DI, Deaville ER. The current and future role of near infrared reflectance spectroscopy in animal nutrition: a review. Aust J Agric Res 1999;50:1131-1145. [ Links ]
6. Osborne BG. Near-infrared spectroscopy in food analysis. In: Encyclopedia of analytical chemistry. John Wiley & Sons, Ltd.; 2006:1-14. [ Links ]
7. Bertrand D. La spectroscopie proche infrarouge et ses applications dans les industries de l'alimentation animale. INRA Prod Anim 2002;15(3):209-219. [ Links ]
8. Shenk JS, Westerhaus MO. The application of near infrared reflectance spectroscopy (NIRS) to forage analysis. In forage quality, evaluation, and utilization. In: Jr. GCF editor. Forage quality evaluation, and utilization. 1994:406-449.10.2134/1994. [ Links ]
9. Balderrama-Pérez VA, Gómez-Soto JG, Reis de Souza TC, Ramírez RE, Mariscal-Landín G. Is the kafirin profile capable of modulating the ileal digestibility of amino acids in a soybean meal-sorghum diet fed to pigs? Anim Nutr 2019;5:124-129. [ Links ]
10. Reis de Souza TC, Ávila AIE, Ramírez RE, Mariscal-Landín G. Effects of kafirins and tannins concentrations in sorghum on the ileal digestibility of amino acids and starch, and on the glucose and plasma urea nitrogen levels in growing pigs. Livest Sci 2019;227:29-36. [ Links ]
11. Aguilera A, Reis de Souza TC, Mariscal-Landín G, Escobar K, Montaño S, Bernal MG. Standardized ileal digestibility of proteins and amino acids in sesame expeller and soya bean meal in weaning piglets. J Anim Physiol Anim Nutr 2015;99:728-736. [ Links ]
12. Reis de Souza TC, Escobar García K, Aguilera AB, Ramirez RE, Mariscal-Landín G. Sesame meal as the first protein source in piglet starter diets and advantages of a phytase: a digestive study. S Afr J Anim Sci 2017;47:606-615. [ Links ]
13. Mariscal-Landín G, Ramírez RE, Cuarón IJA. Valor nutritivo de subproductos de cártamo para cerdos en finalización. Rev Mex Cienc Pecu 2017;8:331-340. [ Links ]
14. Mariscal-Landín G, Ramirez RE. Determinación de la digestibilidad de la proteína, aminoácidos y energía de canola integral en cerdos en crecimiento. Rev Mex Cienc Pecu 2017;8:297-304. [ Links ]
15. Luján OC. Desarrollo tecnológico para el uso del Ronozyme Proact en la producción porcina [tesis Maestría]. Universidad Nacional Autónoma de México. México: 2014 [ Links ]
16. CIOMS. International guiding principles for biomedical research involving animals. In: Organization WH editor. International guiding principles for biomedical research involving animals. Council for International Organizations of Medical Sciences ed. Geneva; 2012. [ Links ]
17. Diario Oficial de la Federación. Especificaciones técnicas para la producción, cuidado y uso de los animales de laboratorio. Norma Oficial Mexicana NOM-062-ZOO-1999. Diario Oficial de la Federación 2001(2 de agosto). [ Links ]
18. INRA. L'alimentation des animaux monogastriques: porc, lapin, volailles. Paris, France: Institut National de la Recherche Agronomique; 1984. [ Links ]
19. AOAC. Official Methods of Analysis. 17 th. ed. Arlington, VA. USA: Assoc Offic Anal Chem; 2000. [ Links ]
20. Fenton TW, Fenton M. An improved procedure for determination of chromic oxide in feed and feces. Can J Anim Sci 1979;59:631-634. [ Links ]
21. Myers WD, Ludden PA, Nayigihugu V, Hess BW. Technical Note: A procedure for the preparation and quantitative analysis of samples for titanium dioxide. J Anim Sci 2004;82:179-183. [ Links ]
22. Henderson JH, Ricker RD, Bidlingmeyer BA, Woodward C. Rapid, accurate and reproducible HPLC analysis of amino acids. Amino acid analysis using Zorbax Eclipse AAA columns and the Agilent 1100 HPLC. Agilent technologies 2000(Part No.5980-1193E):10 pag. Agilent technologies home page at: http://www.agilent.com/chem/supplies. [ Links ]
23. Csapó J, Loki K, Csapó-Kiss Z, Albert C. Separation and determination of the amino acids by ion exchange column chromatography applying post-column derivatization. Acta Agr Kapos 2005;9:33-51. [ Links ]
24. Saeys W, Darius P, Ramon H. Potential for on-site analysis of hog manure using a visual and near infrared diode array reflectance spectrometer. J Near Infrared Spectrosc 2004;12:299-309. [ Links ]
25. Wickham H. Elegant Graphics for data analysis. Nueva York: Springer-Verlag; 2016. 260 Pag. doi:10.1007/978-3-319-24277-4. [ Links ]
26. Patil, I. Visualizations with statistical details: The 'ggstatsplot' approach. J Open Source Softw 2021;6:3167. doi:10.21105/joss.03167. [ Links ]
27. R Core Team. R: A language and environment for statistical computing. Vienna, Austria. R Foundation for Statistical Computing. 2021. [ Links ]
28. Tester RF, Karkalas J, Qi X. Starch-composition, fine structure and architecture. J Cereal Sci 2004;39:151-165. [ Links ]
29. Saeys W, Xing J, de Baerdemaeker J, Ramon H. Comparison of transflectance and reflectance to analyse hog manures. J Near Infrared Spectroscopy 2005;13:99-107. [ Links ]
30. Wehling RL. Infrared spectroscopy. Food analysis. Boston, MA Springer; 2010:407-420. [ Links ]
31. Montagne L, Piel C, Lallès JP. Effect of diet on mucin kinetics and composition: nutrition and health implications. Nutr Rev 2004;62(3):105-114. [ Links ]
32. Mariscal-Landín G, Reis de Souza TC, Hernández DAA, Escobar GK. Pérdidas endógenas de nitrógeno y aminoácidos en cerdos y su aplicación en la estimación de los coeficientes de digestibilidad ileal de la proteína y aminoácidos de las materias primas. Téc Pecu Méx 2009;47:371-388. [ Links ]
33. Fontaine J, Schirmer B, Hörr J. Near-infrared reflectance spectroscopy (nirs) enables the fast and accurate prediction of essential amino acid contents. 2. Results for wheat, barley, corn, triticale, wheat bran/middlings, rice bran, and sorghum. J Agric Food Chem 2002;50:3902-3911. [ Links ]
34. Owens B, McCann MEE, McCracken KJ, Park RS. Prediction of wheat chemical and physical characteristics and nutritive value by near-infrared reflectance spectroscopy. Br Poult Sci 2009;50:103-122. [ Links ]
35. Schiborra A, Bulang M, Berk A, Susenbeth A, Schlecht E. Using faecal near-infrared spectroscopy (FNIRS) to estimate nutrient digestibility and chemical composition of diets and faeces of growing pigs. Anim Feed Sci Technol 2015;210:234-242. [ Links ]
36. Bastianelli D, Bonnal L, Jaguelin-Peyraud Y, Noblet J. Predicting feed digestibility from NIRS analysis of pig faeces. Animal 2015;9:781-786. [ Links ]
37. de la Roza-Delgado B, Modroño SFV, Martínez-Fernández A, Soldado A. Suitability of faecal near-infrared reflectance spectroscopy (NIRS) predictions. Spanish J Agric Res 2015;13:1-7. [ Links ]
38. Nirea KG, Pérez de Nanclares M, Skugor A, Afseth NK, Meuwissen THE, Hansen JØ, et al. Assessment of fecal near-infrared spectroscopy to predict feces chemical composition and apparent total-tract digestibility of nutrients in pigs. J Anim Sci 2018;96:2826-2837. [ Links ]
39. Velayudhan DE, Kim IH, Nyachoti CM. Characterization of dietary energy in swine feed and feed ingredients: a review of recent research results. Asian Australas J Anim Sci 2015;28:1-13. [ Links ]
40. Aluthge ND, Van Sambeek DM, Carney-Hinkle EE, Li YS, Fernando SC, Burkey TE. Board invited review: The pig microbiota and the potential for harnessing the power of the microbiome to improve growth and health. J Anim Sci 2019;97(9):3741-3757. [ Links ]
41. Stein HH, Sève B, Fuller MF, Moughan PJ, de Lange CFM. Invited review: Amino acid bioavailability and digestibility in pig feed ingredients: Terminology and application. J Anim Sci 2007;85:172-180. [ Links ]
42. Jha R, Fouhse JM, Tiwari UP, Li L, Willing BP. Dietary fiber and intestinal health of monogastric animals. Front Vet Sci 2019;6:48. [ Links ]
43. Lin R, Liu W, Piao M, Zhu H. A review of the relationship between the gut microbiota and amino acid metabolism. Amino Acids 2017:1-8. [ Links ]
44. Cruz-Conesa A, Ferré J, Pérez-Vendrell AM, Callao MP, Ruisánchez I. Use of visible-near infrared spectroscopy to predict nutrient composition of poultry excreta. Anim Feed Sci Technol 2021;283:115-169. [ Links ]
45. Thiagarajah J, Verkman A. Water transport in the gastrointestinal tract. In: Johnson LR editor. Physiology of the gastrointestinal tract. Fifth ed. Amsterdam: Academic Press; 2012:1757-1780. [ Links ]
46. Garnsworthy PC, Wiseman J, Fegeros K. Prediction of chemical, nutritive and agronomic characteristics of wheat by near infrared spectroscopy. J Agric Sci Cambridge 2000;135:409-417. [ Links ]
Received: March 16, 2022; Accepted: February 21, 2023
 Este es un artículo publicado en acceso abierto bajo una licencia Creative Commons
