


Services on Demand
Journal
Article
 text in
  English (pdf)
 Article in xml format
 Article references
 Send this article by e-mail
Indicators
-
 Cited by SciELO
 -
 Access statistics
Related links
-
 Similars in
SciELO
Similars in
SciELO
Share

 Permalink
Revista mexicana de ciencias pecuarias
On-line version ISSN 2448-6698Print version ISSN 2007-1124
Rev. mex. de cienc. pecuarias vol.13 n.2 Mérida Apr./Jun. 2022 Epub June 20, 2022
https://doi.org/10.22319/rmcp.v13i2.5977
Technical notes
Panting frequency and score in beef cattle in intensive finishing during summer in the dry tropics
a Universidad Autónoma de Sinaloa. Facultad de Medicina Veterinaria y Zootecnia. México.
Panting frequency and score are indicative of cattle well-being in intensive finishing feedlots. A six-week-long descriptive observational study was done of intensive finishing beef cattle during summer in the dry tropics in northwest Mexico. Data were collected on pen type, observation time (0800, 1200 and 1600 hours), panting frequency and score, environmental temperature, relative humidity and animal phenotypic predominance (i.e. Bos taurus or Bos indicus). The temperature and humidity index (THI) was calculated. Panting frequency was recorded as the number of animals exhibiting this behavior per pen, and panting scored on a five-point scale. Three categories of phenotype were assigned (no hump, medium hump and large hump), greater hump size being indicative of greater B. indicus influence. Panting frequency was highest at 1200 and 1600 h (P<0.01), when THI values consistently exceeded 84 units. Panting score tended to be higher (P<0.01) in pens with less space for individual animals, at later observation times, and in animals with no hump. Panting frequency and score in beef cattle in intensive feedlots was influenced by time of day, pen design and a predominantly B. taurus phenotype.
Key words Heat stress; Bovines; Intensive finishing
Para determinar la frecuencia y el puntaje de jadeo en bovinos productores de carne en finalización intensiva durante la séptima a la doceava semana del verano, se llevó a cabo un estudio observacional descriptivo con duración de seis semanas. Se eligieron 12 corrales de tres diferentes dimensiones. A las 0800, 1200 y 1600 horas se registraron la frecuencia y puntaje de jadeo, temperatura ambiental y humedad relativa; además, se calculó el índice de temperatura y humedad (ITH). La frecuencia se registró como el número de bovinos que manifestaron esta expresión en cada corral. Para registrar el puntaje de jadeo se utilizó una escala de cinco puntos. Los bovinos se asignaron a tres categorias: sin giba, con giba media y giba grande en correspondencia con la predominancia fenotipica de Bos taurus o Bos indicus. La mayor frecuencia de jadeos se observó a las 1200 y 1600 h (P<0.01), cuando el valor de ITH superó las 84 unidades. Se observó efecto (P<0.01) del diseño del corral, hora del día y tamaño de la giba sobre el puntaje de jadeo. En la manifestación de la frecuencia y puntaje de jadeo en bovinos productores de carne en corral de engorda intensiva, influyó la hora del día, el diseño del corral y la mayor predominancia fenotípica de Bos taurus.
Palabras clave Estrés por calor; Bovinos; Finalización intensiva
Industrial beef production focuses on efficiency and production unit profitability which depend on reproductive management strategies, genetic improvement technologies, exogenous growth promoters, vaccines and antibiotics, processed feed, and ration formulation1. In Mexico, beef production is the main livestock activity, contributing 29.8 % of the value of national livestock production in 2018, equivalent to 134.4 billion Mexican pesos2.
In intensive beef cattle finishing pens, several common factors concur which affect animal thermal balance. These include animal genotype, body condition, fat cover, coat color and degree of adaptation to the environment3. This concurrence needs to be considered when assessing animal welfare indicators and their relationship to beef productive parameters in intensive finishing4. For example, animal production indicators can decline sharply in warm regions due mainly to animal stress caused by high temperatures coupled with high relative humidity5. In cattle, heat stress occurs when environmental temperature exceeds animals’ thermoneutral zone, preventing them from dissipating excess heat6. Optimum cattle performance occurs in a thermoneutral zone of 20 °C, which can vary from 10 to 26 °C; for example, in young animals the comfort zone ranges from 7 to 26 °C while the range for mature cows and heavy cattle is from -17 °C in winter to 23 °C in summer. Most cattle types have difficulty tolerating temperatures above 27 °C, especially if relative humidity (RH) exceeds 40 %7.
Ruminants are homeothermic animals. Maintaining homeostasis in temperatures outside a species’ thermoneutral zone requires physiological and behavioral changes. When environmental temperature rises, the immediate physiological response in cattle manifests as increased respiratory rate, decreased feed intake and greater water intake6. Under extreme conditions, cattle can die from heat stress8. Both respiratory rate and panting are appropriate indicators for measuring heat stress intensity in cattle8,9. In addition, highly productive cattle have a high metabolic rate, making them more susceptible to heat stress6. The present study objective was to quantify panting frequencies and scores in beef cattle in intensive finishing during summer in the dry tropics.
This descriptive observational study was done in a Livestock Production Unit (LPU), in Los Becos, south of the city of Culiacán, Sinaloa, Mexico (24° 38’ 58” N; 107° 17’ 10” W; average altitude= 70 m amsl). According to the Köppen classification, climate in the Culiacán Valley is classified as BS1(h')w(w)e. The “B” refers to dry climates, and the “BS1” classification indicates a type of dry steppe climate with moderate precipitation; this classification is between very arid climates (BW) and humid ones (A or C). The symbol “(h')” indicates a warm climate with an average annual temperature above 22 °C and an average temperature of 18 °C in the coldest month. The “w(w)” means rainfall occurs during the summer months; indeed, in the wettest month of the warmest season rainfall is 10 times greater than in the driest month, and only 5 % of annual rainfall occurs in the winter. Finally, the symbol “e” indicates the presence of extreme thermal oscillation, from 7 to 14 °C, between average annual monthly temperatures. In summary, BS1(h')w(w)e means the study area is in a very hot semi-dry climate with extreme summer rains, and winter precipitation representing less than 5 % than the annual total10,11.
The experimental period was in the summer. Based on historical climatological records for the Culiacán Valley12, a six-week-long period was selected spanning from the seventh to the twelfth week of summer, that is, 4 wk in August and 2 wk in September. These months have the highest average rainfall of the year (209.2 and 141.6 mm), high average RH (75 and 75 %) and extreme average temperature (34.8 and 34.4 ° C).
The cattle were housed in pens of three different dimensions used for beef production at the LPU. For study purposes these were labeled as type 1, 2 and 3 pens (Table 1).
Table 1 Characteristics of intensive finishing pens at LPU in the dry tropics
| Characteristics | Pen type | ||
|---|---|---|---|
| 1 | 2 | 3 | |
| No. of pens | 4 | 4 | 4 |
| Animals | 67 | 71 | 89 |
| Dimensions, m | 22.67 x 38.98 | 22.92 x 40.36 | 32.1 x 41.60 |
| Available surface, m2 | 883.67 | 925.03 | 1335.07 |
| Living space, m2/animal | 13.14 | 13.13 | 15.16 |
| Available shade, m2 | 134.75 | 137.57 | 192.32 |
| Available shade, % | 15.29 | 14.87 | 14.40 |
| Shade area, m2/animal | 2.01 | 1.95 | 2.18 |
| Shade orientation | N - S | N - S | E - W |
| Feeder length, m | 22.39 | 22.90 | 32.05 |
| Feeder availability, cm/head | 33.4 | 32.2 | 36.0 |
| Water trough length, m | 6.0 | 6.0 | 6.0 |
| Water trough availability, cm/head | 8.9 | 8.5 | 6.7 |
LPU= Livestock production unit.
Temperature and RH were measured using two digital thermohygrometers (Model No. VA-EDT- 1-55ª, Avaly Taylor, Mexico City, Mexico) placed in the feeding area of each pen type. The temperature and humidity index (THI) was calculated using the formula:
All the documented pens contained only uncastrated males (average LW= 450 kg). The animals were fed the finishing program diet utilized at this LPU. Four pens of each of the three sizes (n= 12) were included in the study. Observation visits were made to the pens from Monday to Friday throughout the study period. Observations were randomized within each pen type such that six pens were observed daily (two per type). All observations were made by a single previously-trained person. Environmental temperature and RH were recorded at 0800, 1200 and 1600 h. Panting frequency was recorded as the number of panting animals in a pen at the time of observation. An established methodology using a 0-4 scale was applied to score panting severity in individual animals (Table 2, Figure 1)13,14.
Table 2 Scale for scoring panting in beef cattle in intensive finishing pens
| Score | RR/min | Description |
|---|---|---|
| 0 | Max 40 | Normal respiration, no panting |
| 1 | 41 - 70 | Light panting, mouth closed, no saliva; chest movement easily observed |
| 2 | 71 - 120 | Panting, open-mouth, some salivation. Neck extended and head generally up |
| 3 | 121 - 160 | Panting, open-mouth, some salivation. Neck extended and head generally up |
| 4 | >160 | Mouth open, tongue completely extended, long periods of salivation |
Source: Mader et al (2002) and Mader et al (2006).
RR= respiration rate.
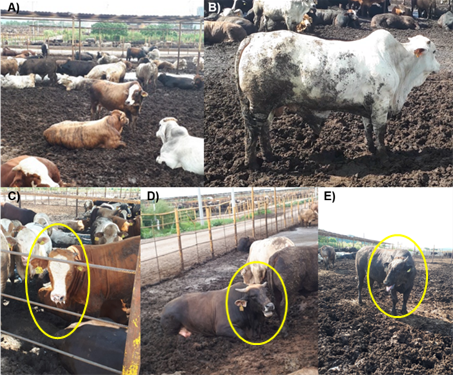
Animals were assigned to one of three estimated phenotypic predominance categories generally suggestive of their predominant species (Bos taurus or Bos indicus). Classifications were made based on the presence of a hump and its size: no hump, medium hump (8-14 cm) and large hump (>15 cm)15. Based on the number of animals in each phenotype category, panting was recorded in six animals per pen, divided proportionally among the categories present at the time of observation in each pen.
The panting frequency observation unit was the pen and recorded values were converted to rates using the formula16:
Where
The transformed rates did not meet normality criteria. The technique of Herrera and Barreras17, using the RANK procedure18, was applied to calculate ranges and an ANOVA applied to these with the GLM procedure, stated in this general linear model:
Where:
Comparison of means for pen type and observation time was done with a Dunn test (Bonferroni)18. Panting score was analyzed using a χ2 test, with 5x3 contingency tables: five panting score levels (0 to 4); three pen types (1, 2 and 3); three observation times (0800, 1200 and 1600 h); and three phenotype categories (no hump, medium hump, and large hump). Highly significant statistical differences resulted, therefore, χ2 tests were run for each panting score and each factor. The results are expressed as the percentage of observations per column and the number of total observations in parentheses.
During the experimental period, average temperature was 34.6 °C, average RH was 67.3 % and the average THI value was 87.3 units (Table 3). The latter indicates that throughout the experimental period the animals were in the Emergency category (THI > 84 units)13.
Table 3 Average temperature, relative humidity and temperature/humidity index values during experimental period (summer)
| Temperature °C | RH1, % | THI2 | ||||||||
|---|---|---|---|---|---|---|---|---|---|---|
| Week3 | Min. | Max. | Mean | Min. | Max. | Mean | Min. | Max. | Mean | Category |
| 1 | 25.0 | 40.6 | 33.4 | 50 | 85 | 66.8 | 75 | 98 | 85.4 | Emergency |
| 2 | 27.6 | 41.2 | 34.5 | 51 | 81 | 66.0 | 79 | 96 | 87.1 | Emergency |
| 3 | 26.6 | 43.1 | 35.2 | 48 | 81 | 64.6 | 77 | 99 | 87.6 | Emergency |
| 4 | 23.9 | 45.8 | 33.9 | 52 | 85 | 66.3 | 74 | 101 | 86.1 | Emergency |
| 5 | 24.4 | 43.1 | 35.2 | 54 | 93 | 71.6 | 75 | 100 | 89.0 | Emergency |
| 6 | 27.1 | 46.3 | 35.3 | 60 | 81 | 69.3 | 78 | 103 | 88.9 | Emergency |
| Overall4 | 23.9 | 46.3 | 34.6 | 48 | 93 | 67.3 | 74 | 103 | 87.3 | Emergency |
1 RH = Relative humidity; 2 THI= Temperature/humidity index; Min.= minimum; Max.= maximum.
3Per week, n=90. 4Overall, n=540.
Results for average temperature and THI per observation time in each pen type show that these parameters varied (P<0.01) in response to pen type and observation time (Table 4). The pen type/observation time interaction also affected temperature and THI values (P<0.01), indicating the presence of microclimates within pens that affect animal physiology. These values also highlight the persistently high temperatures and THI that constitute the Emergency category, and the consequent daily cumulative caloric load experienced by animals in the finishing pens.
Table 4 Average environmental temperature and temperature/relative humidity index (THI) values per observation time and pen type
| Observation time | Pen type | Temperature, °C | THI |
|---|---|---|---|
| 0800 | 1 | 31.1 | 84.2 |
| 2 | 31.4 | 84.7 | |
| 3 | 28.8 | 80.8 | |
| 1200 | 1 | 37.9 | 90.9 |
| 2 | 37.2 | 89.9 | |
| 3 | 35.2 | 87.0 | |
| 1600 | 1 | 36.0 | 89.0 |
| 2 | 35.6 | 88.4 | |
| 3 | 35.5 | 88.1 | |
| SME | 0.39 | 0.55 | |
| Time | 0.01 | 0.01 | |
| Pen type | 0.01 | 0.01 | |
| Time x Pen type | 0.01 | 0.01 |
SME= Standard mean error (n= 60).
Recording and interpretation of temperature and THI values are used as a way of quantifying the degree of heat stress experienced by cattle in a feedlot19; this is logical since heat stress severity depends largely on diurnal fluctuations in environmental temperature20. The maximum temperature values recorded throughout the day in the present study exceeded the high critical temperature limit for cattle (Table 4). In addition, observation time clearly affected panting frequency during the present study, with much higher frequencies (P<0.01) at 1200 and 1600 h than at 0800 h (Figure 5). This coincides with THI values in excess of 84 units, the lower limit for the Emergency category. These results are vital to evaluating animal well-being because conditions outside the thermoneutral zone compromise cattle thermal comfort in intensive finishing systems21. Cattle physically suffer from loss of thermal balance which can undermine productive function because an animal’s physiological response is restricted in unfavorable climatic conditions during intensive confinement5,6,8. This negatively affects beef cattle well-being in intensive finishing environments.
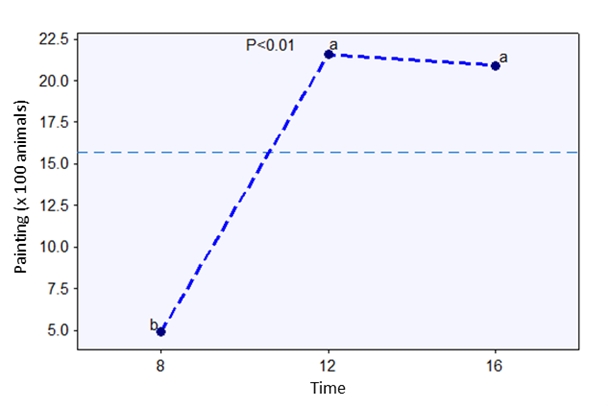
ab Different lowercase letters indicate significant difference (P≤0.01).
Figure 5 Panting frequency in finisher beef cattle during summer in a dry tropical climate, by observation time.
Among domestic animals, cattle are particularly vulnerable to environment thermal conditions, a situation exacerbated under feedlot conditions5. Tropical regions characterized by high temperature and high RH also pose considerable challenges to animal thermoregulation22. The present results confirm previous reports of the relationship between environmental conditions and heat stress in cattle. In a study of native South African beef cattle in finishing feedlots during the summer months of February and March at temperatures ranging from 17 to 38 °C, panting frequency increased between 1200 and 1400 h, indicating that the cattle were under heat stress23.
Environmental temperature and RH can also affect respiratory rate in cattle, providing another indicator of heat stress. One study of Angus × Charolais cattle found fluctuating respiratory rates when average environmental temperature was reduced from 23.7 to 14.5 °C, and average RH increased from 57.5 to 60.5% in a feedlot between July and October24. A study done in the tropics of Peru, with 34.1 °C maximum temperature and 81.2 % RH, reported that respiratory rate indicated heat stress in Nellore and Nellore x Swiss Brown cattle25. In four breeds studied in Mexico (Criollo, Holstein, Jersey and Charolais x Brahman) during the warm months of May to September, respiratory rate increased when environmental temperature rose from 36.2 to 40.3 °C and RH from 70 to 85 %, and THI values were greater than or equal to 72 units26. Increased panting has also been reported in Angus cattle in a feedlot as high temperature and RH humidity increased during the year27.
Panting is an indicator of caloric load and is associated with heat stress and declining animal well-being in feedlots. Breeds derived from B. taurus can be more susceptible to thermal stress, while B. indicus breeds are more thermotolerant and therefore more adaptable to hot climates28. Intensive beef cattle production in Mexico involves various breeds, resulting in the coexistence of a diversity of phenotypes in finishing pens. For this reason, data on phenotypic expressions (i.e. hump size) were included in the panting score (PS) evaluation (Table 5).
Table 5 Panting score of beef cattle (n) in intensive finishing in summer by pen type, observation time and hump size
| Panting score | P | |||||
|---|---|---|---|---|---|---|
| 0 | 1 | 2 | 3 | 4 | ||
| Pen type | ||||||
| 1 | 32.3ab (413) | 33.3 (545) | 36.5a (62) | 31.8 (27) | 45.0a (36) | 0.009 |
| 2 | 31.0b (396) | 33.0 (540) | 39.4a (67) | 30.6 (26) | 33.7ab (27) | |
| 3 | 36.7a (469) | 33.7 (550) | 24.1b (41) | 37.6 (32) | 21.3b (17) | |
| Observation time | ||||||
| 0800 | 63.1a (806) | 17.0c (277) | 2.9b (5) | 5.9b (5) | 8.7c (7) | 0.0001 |
| 1200 | 11.0c (141) | 45.6a (746) | 51.2a (87) | 45.9a (39) | 31.3b (25) | |
| 1600 | 25.9b (331) | 37.4b (612) | 45.9a (78) | 48.2a (41) | 60.0a (48) | |
| Hump size | ||||||
| No hump | 24.8b (317) | 29.7b (486) | 55.9a (95) | 49.4a (42) | 62.5a (50) | 0.0001 |
| Medium | 48.8a (624) | 51.4a (840) | 40.0b (68) | 42.4a (36) | 32.5b (26) | |
| Large | 26.4b (337) | 18.9c (309) | 4.1c (7) | 8.2b (7) | 5.0c (4) | |
abc Different letter superscripts within pen type, observation time and hump size, and within each panting score column indicate significant difference (P<0.05).
Of the total number of animals with a PS of 4, a higher proportion (P<0.01) were in type 1 pens (45 %) than in type 3 pens (21.3 %). In contrast, most (P<0.01) of the animals with a PS of 2 were housed in type 1 (36.5 %) and 2 (39.4 %) pens, with fewer in in type 3 pens (24.1 %). Finally, animals with a PS of 0 were more frequent (P<0.01) in type 3 pens (36.7 %) than in type 2 pens (31.0 %). In terms of numbers of panting animals, there was no difference between pen types. However, THI values in type 3 pens were generally lower than in type 1 and 2 pens (Table 4). The slightly lower occurrence of high PS scores, and lower THI values, in type 3 pens suggest that these pens provide somewhat better microclimatic conditions than type 1 and 2 pens. This may be related to their greater shaded area (2.18 [type 3] vs 2.01 [type 2] vs 1.95 [type 1] m2/animal), and greater living area (15.16 [type 3] vs 13.14 [type 2] vs 13.13 [type 1] m2/animal), as well as their East-West orientation.
Cattle can withstand adverse weather conditions, but shading intensive finishing feedlots reduces the impact of heat stress, mitigating its negative physiological effects and improving cattle production performance6,8. Previous reports have found panting rate can be reduced by providing adequate shade (3 - 5 m2/head for animals > 400 kg LW, in intensive finishing) and living space (15 - 19 m2/animal), consequently improving panting scores and well-being in feedlot cattle24,27,29. This is especially the case in geographical areas with extreme weather conditions where heat is most intense from 1200 h onwards9.
In terms of observation time, the highest frequency (63.1 %) of animals with a PS of 0 was recorded at 0800 h, which was higher (P<0.01) that at 1600 h (25.9 %) and 1200 h (11.1 %). Animals with a PS of 1 were more frequent (P<0.01) at 1200 h (45.6%) than at 16:00 h (37.4 %) and 8:00 h (17.0 %). In the PS 2 and 3 categories no difference was observed in panting frequency between 1200 h and 1600 h, although it was lower (P<0.01) at 0800 h. Animals with a PS of 4 were more frequent (P<0.01) at 1600 h (60.0 %) than at 1200 h (31.3 %) and 0800 h (8.7 %). In the present results, higher THI values (which increase throughout the day) were clearly related to higher panting scores. Since exposure of beef cattle in intensive finishing systems to extreme heat and humidity can reduce animal productivity and well-being26, the present results highlight the need for adequate shade and living space areas in feedlots.
Phenotype, as a proxy for cattle species, did effect animal response to the evaluated environmental conditions. At low panting scores (PS 0 and 1), animals with a medium hump were more frequent (P<0.01) than those with no hump or a large hump. In the PS 2, 3 and 4 categories, animals with a large hump were much less frequent (P<0.01) than those with a medium or no hump. Under the evaluated conditions animals with a substantial B. taurus genetic predominance (i.e. no hump or medium hump) exhibited physiological difficulties in adapting to the rainy summer conditions in the dry tropics with THI values far in excess of 75 units. In contrast, the B. indicus animals (i.e. large hump) were more tolerant of these conditions, manifesting much lower panting scores. These results support reports that genetic differences between breeds influence heat tolerance and can notably modify animal behavior under adverse physiological parameters30.
Time of day, pen type and a phenotypic predominance of B. taurus affected panting frequency and panting score in beef cattle housed in intensive finishing pens. The persistently high THI values in the summer in the study region compromised physiological stability of the evaluated finisher cattle. Animals with a predominantly B. taurus phenotype were most strongly affected, but housing characteristics (e.g. living space, shaded area and drinker availability per animal) had a greater capacity to exacerbate the adverse conditions during summer, worsening the already negative impacts of extreme heat conditions on animal well-being.
Literatura citada
1 Drouillard JS. Current situation and future trends for beef production in the United States of America - A review. Asian-Australas J Anim Sci 2018;37(7):1007-1016. doi: 10.5713/ajas.18.0428. [ Links ]
2 FIRA. Panorama Agroalimentario. Carne de bovino. 2019.: : https://www.fira.gob.mx/InvYEvalEcon/EvaluacionIF . Consultado Nov 30, 2020. [ Links ]
3 Lees AM, Sejian V, Wallage AL, Steel CC, Mader TL, Lees JC, Gaughan JB. The impact of heat load on cattle: review. Animals 2019;9(6):322. doi: 10.3390/ani9060322. [ Links ]
4 Temple D, Manteca X. Animal welfare in extensive production system in still an area of concern. Front Sustain Food Syst 2020;4:545902. doi: 10.3389/fsufs.2020.545902. [ Links ]
5 Renaudeau D, Collin A, Yahav S, Basilio V, Gourdine JL, Collier RJ. Adaptation to hot climate and strategies to alleviate heat stress in livestock production. Animal 2012;6(5):707-728. doi:10.1017/S1751731111002448. [ Links ]
6 Bernabucci U, Lacerera N, Baumgard LH, Rhoads RP, Ronchi B, Nardone A. Metabolic and hormonal acclimation to heat stress in domesticated ruminants. Animal 2010;4(7):1167-1183. doi: 10.1017/S175173111000090X. [ Links ]
7 Mader T, Griffin D, Hahn L. Managing feedlot heat stress. Institute of Agriculture and Natural Resourcer. University of Nebraska, Lincoln, USA: 2007. http://extensionpublications.unl.edu/assets/html/g1409/build/g1409.htm. [ Links ]
8 Brown-Brandl TM, Eigenberg RA, Nienaber JA, Hahn GL. Dynamic response indicators of heat stress in shaded and non-shaded feedlot cattle, part 1: Analyses of indicators. Biosyst Eng 2005;90(4):451-462. doi: 10.1016/j.biosystemseng.2004.12.006. [ Links ]
9 Gaughan JB, Mader TL. Body temperature and respiratory dynamics in un-shade beef cattle. Int J Biometeorol 2014;58(7):1443-1450. doi: 10.1007/s00484-013-0746-8 [ Links ]
10 García E. Modificaciones al sistema de clasificación climática de Köppen. Universidad Nacional Autónoma de México. México. 2004; ISBN: 970-32-1010-4. [ Links ]
11 Estación climatológica de la Escuela de Biología de la Universidad Autónoma de Sinaloa. Universidad Autónoma de Sinaloa.: : http://www.uas.edu.mx/servicios/clima/ . Consultado Sept 22, 2019. [ Links ]
12 CONAGUA. Comisión Nacional del Agua. Servicio Meteorológico Nacional. Normales climatológicas del Estado de Sinaloa. Periodo 1951-2010.: https://smn.conagua.gob.mx/es/informacion-climatologica-por-estado?estado=sin [ Links ]
13 Mader TL, Davis MS, Brown-Brandl T. Environmental factors influencing heat stress in feedlot cattle. J Anim Sci 2006;84(1):712-719. doi: 10.2527/2006.843712x . [ Links ]
14 Mader TL, Holt SM, Hahn GL, Davis MS, Spiers DE. Feeding strategies for managing heat load in feedlot cattle. J Anim Sci 2002;80(9):2373-2382. doi: 10.1093/ansci/80.9.2373. [ Links ]
15 Méndez RD, Meza CO, Berruecos JM, Garcés P, Delgado EJ, Rubio MS. A survey of beef carcass quality and quantity attributes in Mexico. J Anim Sci 2009;87(11):3782-3790. doi:10.2527/jas.2009-1889. [ Links ]
16 Daniel WW. Bioestadística base para el análisis de las ciencias de la salud. Cuarta ed., México, DF: Editorial Limusa S.A. de C.V. 2002. ISBN: 968-18-6164-7. [ Links ]
17 Herrera HJG, Barreras SA. Manual de procedimientos: Análisis estadístico de experimentos pecuarios (utilizando el Programa SAS). Segunda ed. Colegio de Postgraduados, Campus Montecillo. México. 2005. ISBN: 968-839-300-2. [ Links ]
18 SAS Institute. Statistical Analysis Software. SAS/STAT System for Windows 9.0. Cary, NC, USA. SAS Institute Inc. 2002. ISBN: 978-1-60764-599-3. http://www.sas.com/en_us/software/analytics/stat.html# [ Links ]
19 Gaughan JB, Mader TL, Holt SM, Lisle A. A new heat index for feedlot cattle. J Anim Sci 2008;86(1):226-234. ISSN: 1525-3163 doi: 10.2527/jas.2007-0305. [ Links ]
20 Silanikove N. Effects of heat stress on the welfare of extensively managed domestic ruminants. Livest Prod Sci 2000;67(1):1-18. doi: 10.1016/S0301-6226(00)00162-7. [ Links ]
21 Arias RA, Mader TL, Escobar PC. Factores climáticos que afectan el desempeño productivo del ganado bovino de carne y leche. Arch Med Vet 2008;40(1):7-22. ISSN: 0301-732X doi: 10.4067/S0301-732X2008000100002. [ Links ]
22 Da Silva RG, Guilhermino MM, De Morais DAEF. Thermal radiation absorbed by dairy cows in pasture. Int J Biometeorol 2010;54(1):5-11. doi 10.1007/s00484-009-0244-1. [ Links ]
23 Blaine KL, Nsahlai IV. The effects of shade on performance, carcass classes and behaviour of heat-stressed feedlot cattle at the finisher phase. Trop Anim Health Prod 2011;43(3):609-615. doi: 10.1007/s11250-010-9740-x. [ Links ]
24 Miltlöhner FM, Morrow JL, Dailey JW, Wilson SC, Galyean ML, Miller MF, McGlone JJ. Shade and water misting effects on behavior, physiology, performance, and carcass traits of heat-stredded feedlot cattle. J Anim Sci 2001;79(9):2327-2335. doi: 10.2527 / 2001.7992327x. [ Links ]
25 Unchupaico PI, Bazán AL, Quispe EC, Ancco GE. Temperatura ambiental y su efecto sobre parámetros fisiológicos en vacas Nellore y cruces bajo condiciones del trópico peruano. Rev Inv Vet Perú 2020;31(1):e17549 http://dx.doi.org/10.15381/rivep.v31i1.17549. [ Links ]
26 Espinoza VJ, Ortega PR, Palacios EA, Guillén TA. Tolerance to heat and atmospheric humidity of different breeds groups of cattle. Rev MVZ Córdoba 2011;16(2):2302-2309. doi:10.21897/rmvz.288. [ Links ]
27 Sullivan ML, Cawdell-Smith AJ, Mader TL, Gaughan JB. Effect of shade area on performance and welfare of short-fed feedlot cattle. J Anim Sci 2011;89(9):2911-2925. doi: 10.2527/jas.2010-3152. [ Links ]
28 Hansen PJ. Physiological and cellular adaptations of zebu cattle to thermal stress. Anim Reprod Sci 2004;82-83:349-360. doi:10.1016/j.anireprosci.2004.04.011. [ Links ]
29 Gaughan JB, Bonner S, Loxton I, Mader TL, Lisle A, Lawrence R. Effect of shade on body temperature and performance of feedlot steers. J Anim Sci 2010;88(12):4056-4067. doi:10.2527/jas.2010-2987. [ Links ]
30 Valente ÉEL, Chizzotti ML, Ribeiro OCV, Castlho GM, Domingues SS, Castro R A, Machado LM. Intake, physiological parameters and behavior of Angus and Nellore bulls subjected to heat stress. Semina: Ciências Agrárias, Londrina 2015;36(6):4565-4574. doi: 10.5433/1679-0359.2015v36n6Supl2p4565. [ Links ]
Received: April 06, 2021; Accepted: August 14, 2021
 Este es un artículo publicado en acceso abierto bajo una licencia Creative Commons
