


Services on Demand
Journal
Article
 text in
  English (pdf)
 Article in xml format
 Article references
 Send this article by e-mail
Indicators
-
 Cited by SciELO
 -
 Access statistics
Related links
-
 Similars in
SciELO
Similars in
SciELO
Share

 Permalink
Revista mexicana de ciencias pecuarias
On-line version ISSN 2448-6698Print version ISSN 2007-1124
Rev. mex. de cienc. pecuarias vol.11 suppl.2 Mérida Mar. 2020 Epub June 30, 2020
https://doi.org/10.22319/rmcp.v11s2.4693
Articles
Environmental suitability areas for [Bouteloua curtipendula (Michx.) Torr.] in Mexico due to climate change effect
a Universidad de Guadalajara. Centro Universitario de Ciencias Biológicas y Agropecuarias. Camino Ramón Padilla Sánchez No. 2100 Nextipac, 44600, Zapopan, Jalisco, México.
The grasslands are exposed to climate change effects that will be observed along the next decades. This will change the plant communities, modifying in turn the services and products supplied by these areas. The influence of the climate as a primary productivity determinant for ecosystems has led to research on the impact of climate change on plant communities with the use of simulation models. The species of Bouteloua genus are among the most important ones in Mexico’s grasslands due to their quality as forage for livestock and their ecological characteristics -the most prominent being the sideoats gramma [Bouteloua curtipendula (Michx.) Torr.]-. The objective was to analyze the areas with environmental suitability for B. curtipendula as an effect of climate change in Mexico. The reference and the future climate were analyzed through the General Circulation Models (GCM) HadGEM and GFDL, with the RCP4.5 and RCP8.5 for the period 2041-2060 and 2061-2080; for the niches of potential distribution modelling, georeferences from 407 collection sites and 29 environment variables were used with the MaxEnt model. Both GCMs predict that the potential area for B. curtipendula will experience an initial decrease of 3.1 to 14.4 %, although later it will recover and even reach an increase of 1.4 %. The annual temperature, the May to October precipitation, and the December to April moisture index, were the main environmental variables accounting for the potential distribution of the species.
Key words Bouteloua curtipendula; Environmental suitability; Descriptors; Ecological niche; MaxEnt; General circulation models; Climate change
Las áreas de pastizal están expuestas a los efectos del cambio climático que se presentarán en las siguientes décadas, lo que provocará cambios en las comunidades vegetales, modificando a su vez los servicios y productos. La influencia del clima como determinante de la productividad primaria en los ecosistemas ha llevado a la realización de estudios para evaluar el impacto del cambio climático en comunidades vegetales mediante el uso de modelos de simulación. Las especies del género Bouteloua están entre las más importantes en los pastizales de México, por su calidad forrajera y sus características ecológicas; entre ellas sobresale el zacate Banderita [Bouteloua curtipendula (Michx.) Torr.]. El objetivo del presente estudio fue delimitar las áreas con aptitud ambiental de B. curtipendula por efecto del cambio climático en México. El análisis del clima futuro se hizo con los modelos de circulación general (MCG) HadGEM-ES y GFDL-CM3, con los RCP4.5 y RCP8.5, para los periodos 2041-2060 y 2061-2080; para modelar los nichos potenciales de distribución se usaron datos de 407 sitios georreferenciados de colecta y 29 variables ambientales; mediante el modelo MaxEnt ambos MCG pronostican que el área con aptitud ambiental para B. curtipendula tendrá una disminución inicial entre 3.1 a 14.4 %, aunque después se recuperará e incluso aumentará hasta un 1.4 %. Las variables ambientales que más contribuyeron a explicar la distribución potencial de la especie fueron la oscilación térmica anual, la precipitación en el periodo mayo a octubre y el índice de humedad de diciembre a febrero.
Palabras clave Bouteloua curtipendula; Aptitud ambiental; Descriptores; Nicho ecológico; Maxent; Modelos de circulación general; Cambio climático
Introduction
The grazing area in Mexico covers more than 45 % of the national territory, with a larger proportion in the northern region of the country where it reaches 70 %1. However, these grassland areas are exposed to the effects of changing climate conditions that will occur in the following decades according to various studies, bringing about changes in plant communities, as well as the products and services they provide2,3. The influence of climate as a determinant of primary productivity of ecosystems has led to studies in order to assess the impact of climate change on plant communities using simulation models. Some studies carried out in Mexico have shown that the ambient temperature will increase between 1.8 and 4.5 °C during the period 2040-2100, while the precipitation will decrease from 2 to 12 %4,5,6.
The species of the genus Bouteloua are some of the most important ones in the grasslands of Mexico, due to their forage quality and their ecological characteristics, among which the grass known as sideoats gramma [Bouteloua curtipendula (Michx.) Torr.] is prominent; this species has been included in some programs for the improvement of pastures, due to its outstanding features as fodder, and improved varieties have been released in Mexico7,8 and in the United States9. In addition, B. curtipendula has a wide variability of the polymorphism that could give it an advantage in terms of adaptability to the effects of climate change10.
Some studies have reported that the structure of the plant communities depends largely on the weather conditions, among which the precipitation and the temperature stand out as determinants11,12,13; at the same time, it has been found that chronic drought strongly reduces the coverage of grasses while it increases the coverage of shrub species in some areas of the Chihuahuan Desert13.
Other results14 show that there is little evidence that changes in precipitation will influence the competitive effects of individual plants in a grassland area with dominance of Bouteloua curtipendula, Bouteloua hirsuta and Schizachyrium scoparium, and that their intraspecific and interspecific interactions are what can modify the colonization of spaces with inadequate agro-ecological characteristics. The objective of this research was to analyze the areas with environmental suitability for B. curtipendula by effect of climate change in Mexico; using two general circulation models (GCM) under the representative concentration pathway of greenhouse gases (RCP4.5 RCP8.5) for the periods 2041-2060 and 2061-2080.
Material and methods
Databases and environmental information systems
The research was based on the analysis of data of the baseline climate and modeling of future climates, obtained from the Global Climate Data portal of WorldClim.org. The data for the 1950-2000 period were used for the reference climate, and the data utilized for the future climate were those corresponding to the periods 2041-2060 and 2061-2080, henceforth referred to as periods 2050 and 2070, respectively, with a spatial resolution of 30 arc seconds15.
The HadGEM-IS and GFDL-CM3 GCMs were utilized; the first was selected because one of the variables it considers is the vegetation type and includes the native grassland as part of the vegetation cover of the planet16; the second, because version CM3 not only includes emerging issues of climate change but also has an improved spatial resolution and pays special attention to the simulation of precipitation in tropical areas17. The simulation utilized representative concentration pathways (RCP) of greenhouse gases18 4.5 and 8.5 to analyze a low and a high scenario; the RCP2.6 was not used because the trends show that this scenario is hard to achieve19. The weather data were processed by the ArcGIS software; maps with climate and bioclimate variables were subsequently generated using the Idrisi Selva software and were utilized to analyze the areas with environmental suitability for B. curtipendula with Maximum Entropy Species Distribution Modeling (MaxEnt).
Potential distribution of B. curtipendula
The following adjustments were made in order to run the MaxEnt model: use of 25 % of the data for testing, the test 10 replications with cross-validation, and a maximum of 2,000 iterations. These adjustments used 410 geo-referenced data obtained from four sources: (a) direct collection, (b) collection from other researchers, (c) data contained in the herbarium specimens of the Biology Institute of the University Center for Biological and Agricultural Sciences of the University of Guadalajara, and (d) collections’ data published on the website of the Global Biodiversity Information Facility20.
The environmental variables utilized were: annual precipitation, May-October precipitation, November and April precipitation, December-February precipitation, precipitation in the wettest month, precipitation in the driest month, maximum annual temperature, maximum temperature May-October, maximum temperature between November and April, mean annual temperature, average temperature in May-October, average temperature in November-April, average temperature of the warmest month, average temperature of the coldest month, annual minimum temperature, minimum temperature in May-October, minimum temperature in November-April, May-October photoperiod, November-April photoperiod, annual humidity index, May-October humidity rate (estimated as the ratio of precipitation to evapotranspiration), November-April humidity rate, December-February humidity rate, annual thermal oscillation, May-October thermal oscillation, November-April thermal oscillation, December-February thermal oscillation, and soil texture.
Areas with probability of environmental suitability
The model for the prediction of areas with environmental suitability for B. curtipendula obtained with MaxEnt was used with the Idrisi system 17.021 with the generated a map with the threshold values corresponding to the 10th percentile22. For the calculation of the surface with environmental suitability of the species, the areas occupied by the bodies of water and urban centers were not considered; these thematic layers were obtained by means of the use of the soil chart and the vegetation23.
Fit of the model
The ecological niche model employed by MaxEnt predicts the rate of occurrence (Receiver operating characteristic, ROC) of the species as a function of the environmental predictors in each locality24 represented by each cell of the mesh of approximately 900 x 900 m in the geographic scale of 30 arc sec.; in turn, the area under the curve (AUC) can be interpreted as the fit of the model, in which a value of 1.0 would be a perfect classifier and a random classifier would have a value of 0.525; therefore, the values close to 1.0 show greater fit of the model to the data.
Results and discussion
Analysis of the potential distribution niche
The average AUC values obtained for baseline climate and climate change scenarios were higher than 0,933 in all cases (Table 1), which is why the data obtained are considered to have a high degree of reliability in assessing the environmental suitability for B. curtipendula24,25. These results agree partially with those of a research conducted in grasslands of United States26, where the analysis for B. curtipendula with 1,251 sampling data reflects a value of the AUC of 0.946; the higher value of the AUC of this study may be due to the use of a greater number of geographic references. On the other hand, in the 10 replicas of the model used in this investigation it was found that the lowest value of AUC was of 0.915 to a high of 0.976, the standard deviation was <0.013 in all cases; therefore, the results are believed to be reliable. Because both GCMs yielded similar data in the prediction of areas with potential suitability, subsequent investigations may use either one of them.
Table 1 Average values of the area under the ROC curve, obtained in 10 replications, and average standard deviation, in the analysis of potential distribution of Bouteloua curtipendula in Mexico
| GCM | Average AUC | Higher AUC | Lower AUC | Standard deviation |
|---|---|---|---|---|
| Reference climate | 0.934 | 0.955 | 0.920 | 0.011 |
| GFDL-CM3 RCP4.5 2050 | 0.933 | 0.953 | 0.915 | 0.011 |
| GFDL-CM3 RCP4.5 2070 | 0.955 | 0.966 | 0.928 | 0.013 |
| GFDL-CM3 RCP8.5 2050 | 0.956 | 0.969 | 0.932 | 0.011 |
| GFDL-CM3 RCP8.5 2070 | 0.935 | 0.953 | 0.920 | 0.011 |
| HadGEM-ES RCP4.5 2050 | 0.957 | 0.975 | 0.932 | 0.012 |
| HadGEM-ES RCP4.5 2070 | 0.937 | 0.960 | 0.923 | 0.012 |
| HadGEM-ES RCP8.5 2050 | 0.956 | 0.976 | 0.928 | 0.013 |
| HadGEM-ES RCP8.5 2070 | 0.934 | 0.951 | 0.920 | 0.010 |
GCM= General circulation models; AUC= Area under the curve.
Changes in the mean annual temperature and accumulated precipitation
In the analysis of the average annual temperature, the two GCMs used in this research predict average increases of 2.8 and 3.4 °C for the 2050 period and of 3.4 and 5.0 °C for the 2070 period with the RCP4.5 and RCP8.5, respectively. With regard to the annual cumulative precipitation, the two models predict a decrease of 3.12 and 6.5 % in the 2050 climate, and of 7 and 14.4 % in the 2070 climate. It is important to note that changes in the temperature and the precipitation will be different in each geographical area, with a general trend toward a more accentuated change in arid and semi-arid areas than in temperate and tropical zones of Mexico.
Areas with environmental suitability for B. curtipendula
Figure 1 shows that the species is found naturally in an extension of 548,719 km2 (Table 2), located in central and northern Mexico; from the southeastern part of the state of Chihuahua to the northern part of Michoacán and Guerrero, in the areas of native grassland located in the Mexican plateau and the Transversal Volcanic Axis. The low presence of the species and the scarcity of surfaces with environmental fitness in the low areas and coastal plains in the coasts of the Pacific Ocean, Gulf of Mexico and Caribbean Sea are notorious.
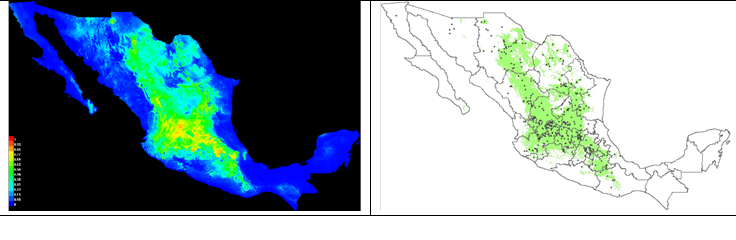
Left side: a map of the MaxEnt model; the red color represents greater probability of occurrence, and the blue color, areas where occurrence is less likely. Right side: Map based on the previous one, with the surface of limited environmental fitness in the 10th decile of the value of probability; the dots indicate the sites of collection of the species.
Figure 1 Current suitability area with environmental B. curtipendula in Mexico
Table 2 Surface area with current environmental suitability for Bouteloua curtipendula in Mexico and variation with the general circulation models (GCMs)
| Climate/MCG | Surface with environmental suitability (km2) | % In relation to the reference climatology |
|---|---|---|
| Reference | 548,719 | 100.0 |
| GFDL-CM3 RCP4.5 2050 | 509,152 | 92.8 |
| GFDL-CM3 RCP4.5 2070 | 505,516 | 92.1 |
| GFDL-CM3 RCP8.5 2050 | 521,876 | 95.1 |
| GFDL-CM3 RCP8.5 2070 | 557,293 | 101.6 |
| HadGEM-ES RCP4.5 2050 | 506032 | 92.2 |
| HadGEM-ES RCP4.5 2070 | 520457 | 94.8 |
| HadGEM-ES RCP8.5 2050 | 528419 | 96.3 |
| HadGEM-ES RCP8.5 2070 | 552,799 | 100.7 |
The results obtained with the algorithm MaxEnt are influenced by environmental data used27,28; Figure 1 (right hand side) shows the homogeneous area with the greatest aptitude for the environmental baseline climate, while Figure 2 depicts the areas with environmental suitability for future periods and the analyzed RCP.
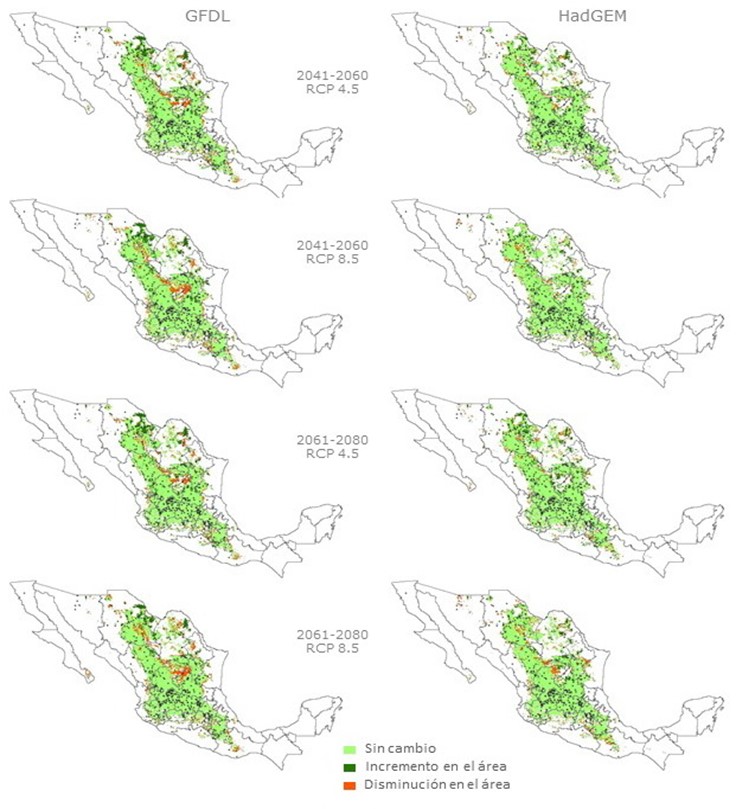
Figure 2 Areas with environmental suitability for B. curtipendula and changes estimated for the periods 2041-2060 and 2061-2080, with RCP4.5 RCP8.5, and in relation to the baseline climate
The GCMs converge in the prediction of a slight decrease of the surface area with environmental suitability for B. curtipendula for the two future climates (except in the RCP8.5 in 2070); the decline in the registered surface area is primarily located in the eastern part of the state of Chihuahua, north of Durango, in the northeast of Coahuila and in small areas distributed in the center and the south of the Mexican Republic (Figure 2). In the 2070 period, an average increase of 1.6 % of the surface area is predicted to occur in RCP8.5 (Table 2), located primarily in the northeast of Chihuahua and north-central Coahuila, in addition to small areas scattered in other areas adjacent to the area with current environmental suitability. This phenomenon can be influenced by the type of metabolism of the species and in this case the physiology of B. curtipendula is of type C426, which is more efficient in the use of water and high temperatures3,29.
Ecological descriptors of the geographical distribution of B. curtipendula
The thermal oscillation and rainfall were the ecological descriptors that contributed most to the potential distribution of the grass B. curtipendula in Mexico (Table 3) in all environmental scenarios. Other studies have also shown the influence of precipitation and temperature in this species3,13. When analyzing the thermal oscillation separately from the other variables (Figure 3), a sharp increase in the probability of occurrence of B. curtipendula with 14 to 20 degrees of difference between maximum and minimum temperatures (the thermal oscillation) was observed.
Table 3 Relative contribution (%) of the environmental variables that have the greatest influence on the environmental suitability for Bouteloua curtipendula in Mexico
| Environmental variable | Reference climate | RCP 4.5 | RCP 8.5 | ||||||
|---|---|---|---|---|---|---|---|---|---|
| 2050 1 |
2050 2 |
2070 1 |
2070 2 |
2050 1 |
2050 2 |
2070 1 |
2070 2 |
||
| ATO | 29.9 | 21.5 | 22.8 | 20.8 | 23.8 | 27.8 | 31.6 | 32.1 | 30.5 |
| Nov-Apr PP | 14.6 | 9.2 | 8.4 | 8.4 | 8.3 | 7.9 | 7.6 | 7.2 | 6.7 |
| May-Oct PRE | 11.1 | 17.1 | 15.6 | 18.8 | 14.6 | 19.3 | 23.8 | 20.1 | 25.5 |
| Dec-Feb TO | 8.2 | 10.3 | 12.8 | 11.8 | 12.6 | 11.2 | 13.9 | 11.5 | 14.3 |
| Dec-Feb IH | 7.2 | 9.8 | 8.0 | 11.1 | 9.8 | 13.7 | 8.6 | 13.9 | 11.1 |
| May-Oct MT | 2.6 | 3.7 | 1.6 | 2.2 | 1.8 | 2.5 | 1.7 | 2.3 | 1.5 |
ATO= annual thermal oscillation; PRE= precipitation; PP = photoperiod; TO= thermal oscillation; IH= index of humidity; MT= minimum temperature.
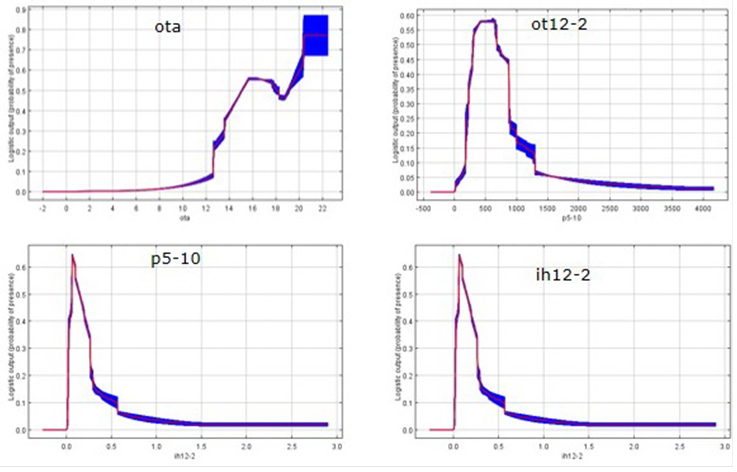
The left-hand side: changes in the prediction of each variable in the sample average. Right side: changes in the prediction of environmental variables separately. The shaded area represents the standard deviation. (ATO, annual thermal oscillation; p5-10, May-Oct precipitation; TO12-2, Dec-Feb thermal oscillation; IH12-2, December-February humidity rate).
Figure 3 Environmental variables that influence the probability of presence of B. curtipendula
The annual precipitation in was one of the main ecological descriptors in the distribution of B. curtipendula, not directly but indirectly, through the rate of annual and seasonal humidity, which are the variables that contribute to explain the presence of the species. Based on Figure 3 it can be inferred that B. curtipendula is more likely to occur in areas with indices of annual humidity of 0.2 and 0.5, above which point this likelihood decreases quickly as the index approaches a value of 1.0; depending on these levels of humidity, B. curtipendula is distributed naturally in arid and semi-arid zones30,31 and is less frequent in sub-humid and humid areas of Mexico. The contribution of the moisture content in the months of December to February indicates that B. curtipendula requires moisture in order to stay in its own ecological niche, as may be corroborated by the fact that the precipitation in the period between December and February contributed to the 5.4 % in the species' distribution, to even a greater extent than the annual cumulative precipitation which reached a value of 3.0 %. In this regard, in a research on B. curtipendula conducted in the Chihuahuan desert, precipitation was the key factor accounting for the net primary productivity, mainly when the rain is distributed in small but frequent events during the summer32. A similar situation has been presented with respect to other species, as reported in a study carried out in Western Africa to model the occurrence of 302 species of grasses, according to which precipitation is the variable that most often affects the distribution of grass species in grasslands11. Other studies also report that the precipitation is the determining factor in the distribution of grasses at the local and regional scales33; they also mention that for 30 species native to the Great Plains of the United States the environmental descriptor that contributed the most to the probability of occurrence of B. curtipendula was the mean annual temperature26, which may be explained by taking into account the latitude that causes very low temperatures with respect to the areas of distribution of this species in Mexico. When the contribution of annual rainfall is analyzed separately, the greatest probability of occurrence of this grass is on the sites with precipitations of 450 to 750 mm¸ smaller or larger precipitations reduce the likelihood of the occurrence of this species.
With regard to the photoperiod, the contribution was 9.0 and 14.6 %, in the months from May to October and November to April, respectively (Table 3), with higher probabilities of presence in ranges from 12:30 to 13:00 h in the months of May to October, and from 1100 to 1130 h in the months of November to April (Figure 3); it should be noted that B. curtipendula has a wide genetic variation that allows it to adapt to a variety of settings33,34, which explains its present in sites as extreme as Canada and Argentina29,35.
Conclusions and implications
The two models agree in the prediction that for the periods 2050 and 2070, there will be an increase of 2.8 to 5.0°C in the annual average temperature, and a decrease of 3.1 to 14.4 % in accumulated precipitation. The effect of these changes on the surface area with environmental suitability for B. curtipendula will have slight negative long-term consequences, because the species will have a lower presence in the period 2050 for both RCPs, and in the 2070 climate, only for the RCP4.5. However, it will recover in the 2070 period in the RCP8.5 and a mean increase of 0.9 % of the surface area with environmental suitability has been predicted in relation to the reference climate. The decline in the area with environmental suitability is located primarily in the states of Chihuahua, Durango and Coahuila and, to a lesser extent, in small areas of central and southern Mexico. The expected increase in area with environmental suitability will occur primarily in the northeast of Chihuahua and in north-central Coahuila. The environmental variables that contributed the most to explain the presence of B. curtipendula in Mexico were: annual thermal oscillation, precipitation in the period from May to October, thermal oscillation in the period from December to February, and humidity from December to February.
Acknowledgments
Thanks to Dr. Carlos Morales Nieto for access to the database of the collections he carried out; and to the authorities of the Los Altos University Center of the University of Guadalajara, for the facilities provided for this research.
REFERENCES
1. SIAP- SAGARPA. Servicio de Información Agroalimentaria y Pesquera, Secretaría de Agricultura, Ganadería, Desarrollo Rural, Pesca y Alimentación, México. http://www.siap.gob.mx/. Consultado Feb 12, 2015. [ Links ]
2. Reeves MC, Moreno AL, Bagne KE, Running SW. Estimating climate change effects on net primary production of rangelands in the United States. Climate Change 2014;126:429-442. doi: 10.1007/s10584-014-1235-8. [ Links ]
3. Polley HW, Derner JD, Jackson RB, Wilsey BJ, Fay PA. Impacts of climate change drivers on C4 grassland productivity: scaling driver effects through the plant community. J Experim Botany 2014;65:3415-3424. doi:10.1093/jxb/eru009. [ Links ]
4. Durán PN, Ruíz CJA, González EDR, Ramírez OG. Impact of climate change on grasses cultivation potential of three altitudinal strata-agricultural lands of Mexico. African J Agric Res 2014;9:1396-1406. [ Links ]
5. Ruíz CJA, Medina GG, Ramírez DJL, Flores LHE, Ramírez OG, Manríquez OJD, et al. Cambio climático y sus implicaciones en cinco zonas productivas de maíz en México. Rev Mex Cienc Agr 2011; Publ Esp 2:309-323. [ Links ]
6. Zarazúa-Villaseñor P, Ruíz-Corral JA, González-Eguiarte DR, Flores-López HE, Ron-Parra J. Impacto del cambio climático sobre la agroclimatología del maíz en Ciénega de Chapala, Jalisco. Rev Mex de Cienc Agr 2011; Publ Esp 2:351-363. [ Links ]
7. Corrales LR, Morales NCR, Melgoza CA, Sierra TJS, Ortega GJA, Méndez ZG. Caracterización de variedades de pasto banderita [Bouteloua curtipendula (Michx.) Torr.] recomendadas para rehabilitación de pastizales. Rev Mex Cienc Pecu 2016;7(2):201-211. [ Links ]
8. Beltrán LS, García DCA, Loredo OC, Núñez QT, González ELA, García DCA, Hernández AJA, et al. Navajita Cecilia y Banderilla Diana: Pastos nativos sobresalientes para el Altiplano de San Luis Potosí. INIFAP-CIRNE-Campo Experimental San Luis, Folleto Técnico # 33. 2007. [ Links ]
9. NRCS. “El Reno” sideoatas grama Bouteloua curtipendula (Michc.) Torr. USDA-Natural Resources Conservation Service: Manhattan KS, USA. 2011. [ Links ]
10. Morales NC, Quero CA, Le BO, Hernández GA, Pérez PJ, González MS. Caracterización de la diversidad del pasto nativo Bouteloua curtipendula Michx. Torr. mediante marcadores de AFLP. Agrociencia 2006;40:711-720. [ Links ]
11. Bocksberger G, Schnitzler J, Chatelain C, Daget P, Janssen T, Schmidt M, Thiombiano A, Zizka G. Climate and the distribution of grasses in West Africa. J Veget Sci 2016;27:306-317. [ Links ]
12. Pérez RIM, Roumet C, Cruz P, Blanchaird A, Autran P, Garnier E. Evidence for “a plant comunity economics spectrum” driven by nutrient and water limitations in a Mediterranean rangeland on Southern France. J Ecol 2012;100:1315-1327. [ Links ]
13. Báez S, Collins SL, Pockman WT, Johnson JE, Small EE. Effects of experimental rainfall manipulations on Chihuahuan desert grassland and shrubland comunnities. Oecol 2013;172:1117-1127. DOI 10.1007/s00442-2552-0. [ Links ]
14. Adler PB, Leiker J, Levine JM. Direct and indirect effects of climate change on a prairie plant community. PloS ONE 2009;4(9):e6887. doi:10.1371/journal.pone.0006887. [ Links ]
15. Hijmans RJ, Cameron SE, Parra JL, Jones PG, Jarvis A. Very high resolution interpolated climate surfaces for global land areas. Internat J Climat 2005;25:1965-1978. [ Links ]
16. Collins WJ, Bellouin N, Doutriaux-Boucher M, Gedney N, Halloran P, Hinton T, et al. Development and evaluation of an Earth-System model - HadGEM2. Geosci Model Dev 2011;4:1051-1075. [ Links ]
17. Donner LJ, Wyman BL, Hemler RS, Horowitz LW, Ming Y, Zhao M, et al. The dynamical core, physical parameterizations, and basic simulations characteristics of the atmpospheric component AM3 of the GFDL global coupled model CM3. J Climate 2011;24:3484-3519. [ Links ]
18. Van Vuuren BDP, Edmonds J, Kainuma M, Riahi K, Thomson A, Hibbard K, et al. The representative concentration pathways: an overview. Climatic Change 2011;109:5-31. DOI 10.1007/s10584-011-0148-z. [ Links ]
19. UNEP. The Emissions Gap Report. United Nations Environment Programme (UNEP), Nairobi. 2016. [ Links ]
20. GBIF (Global Biodiversity Information Facility). GBIF.org (11th February 2017). GBIF Ocurrence Download http://doi.org/10.15468/dl.gfgh2t. [ Links ]
21. Eastman JR. Idrisi Selva Manual Version 17. Worcester, Mass., USA: Clark Labs, Clark University; 2012. [ Links ]
22. Norris D. Model thresholds are more important than presence location type: Understanding the distribution of lowland tapir (Tapirus terrestris) in a continuous Atlantic forest of southeast Brazil. Tropical Conserv Sci 2014;7(3):529-547. [ Links ]
23. INEGI (Instituto Nacional de Estadística Geografía e Informática). Guía para interpretación cartográfica: Uso de suelo-vegetación Serie III. México. DF. 2009. [ Links ]
24. Merow C, Smith MJ, Silander JA. A practical guide to MaxEnt for modeling species distributions: what it does and why inputs and settings matter. Ecography 2013; 36:1058-1069. [ Links ]
25. Phillips SJ, Dudik M, Schapire RE. Maximum entropy modeling of species geographic distributions. Ecolog Model 2006;190:231-259. [ Links ]
26. Martinson EJ, Eddy ZB, Commerford JL. Biogeographic distributions of selected North American grassland plant species. Physical Geo 2011;32(6):583-602. Doi: 10.2747/0272-3646.32.6.583. [ Links ]
27. Elith J, Phillips SJ, Hastie T, Dudik M, Chee YE, Yates CJ.. A statistical explanation of MaxEnt for ecologists. Diversity Distrib 2011;17:43-57. [ Links ]
28. Phillips SJ, Dudik M. Modeling of species distributions with Maxent: new extensions and a comprehensive evaluation. Ecography 2008;31:161-175. [ Links ]
29. Schellenberg MP, Biligetu B, McLeod GJ, Wang Z. Phenotypic variation of side-oats grama grass [Bouteloua curtipendula (Michx.) Torr.] collections from the Canadian prairie. Can J Plant Sci 2012;92:1043-1048. [ Links ]
30. UNEP. World Atlas of Desertification. 2nd ed. United Nations Environment Programme: Oxford University Press, England. 1997. [ Links ]
31. Robertson TR, Bell CW, Zak J, Tissue DT. Precipitation timing and magnitude differentially effect aboveground annual net primary productivity in three perennial species in a Chihuahuan dessert grassland. New Phytol 2009;181:230-242. [ Links ]
32. Edwards TJ, Smith SA. Phylogenetic analysis reveals the shady history of C4 grasses. PNAS 2010;107:2532-2537. [ Links ]
33. Morales NCR, Avendaño AC, Melgoza CA, Gil VKC, Quero CA, Jurado GP, et al. Caracterización morfológica y molecular de poblaciones de pasto banderita (Bouteloua curtipendula) en Chihuahua, México. Rev Mex Cienc Pecu 2016;7(4):455-469. [ Links ]
34. Chadwick AC. Bouteloua curtipendula. In: U.S. Department of Agriculture, Forest Service, Rocky Mountain Research Station, Fire Sciences Laboratory (Producer) 2003. http://www.fs.fed.us/database/feis/ . Accesed Apr 5, 2017. [ Links ]
35. Siqueiros DME, Ainouche M, Columbus JT, Ainouche A. Phylogeny of the Bouteloua curtipendula complex (Poaceae: Chloridoideae) based on nuclear ribosomal and plastid DNA sequences from diploid taxa. Sistem Bot 2013;38(2):379-389. [ Links ]
Received: November 12, 2017; Accepted: July 12, 2018
 Este es un artículo publicado en acceso abierto bajo una licencia Creative Commons
