


Services on Demand
Journal
Article
 text in
  English (pdf)
 Article in xml format
 Article references
 Send this article by e-mail
Indicators
-
 Cited by SciELO
 -
 Access statistics
Related links
-
 Similars in
SciELO
Similars in
SciELO
Share

 Permalink
Revista mexicana de ciencias pecuarias
On-line version ISSN 2448-6698Print version ISSN 2007-1124
Rev. mex. de cienc. pecuarias vol.11 suppl.2 Mérida Mar. 2020 Epub June 30, 2020
https://doi.org/10.22319/rmcp.v11s2.4681
Articles
Water temperature effect on the reaction rate constant of pollutants in a constructed wetland for the treatment of swine wastewater
a Instituto Nacional de Investigaciones Forestales, Agrícolas y Pecuarias (INIFAP). Campo Experimental Centro-Altos de Jalisco. Tel: 01 800 0882222. AV. Biodiversidad 2470. 47600 Tepatitlán de Morelos. Jalisco, México.
b INIFAP. Sitio Experimental La Campana. Chihuahua, México.
c INIFAP. Campo Experimental Santiago Ixcuintla. Nayarit, México.
d INIFAP. Centro Nacional de Investigación Disciplinaria en Fisiología y Mejoramiento Animal. Querétaro, México.
Temperature is an important factor in the processes that are carried out in biological systems. In wetlands, the capacity to remove pollutants is limited by environmental factors. The objective was to determine the effect of water temperature on the rate constant for the removal of pollutants in wastewater from pig farms. The evaluation was carried out in a surface flow constructed wetland (SFCW) consisted of a 9 m long and 3 m wide channel covered with a high density geo-membrane (4 mm). The SFCW bed consisted of a 30 cm layer of sand and clay; native vegetation from the study area was used. The hydraulic retention time (HRT) was 10 d, and 12 experimental runs were carried out between January 2014 and December 2015. The results showed an average removal rate of the chemical oxygen demand (COD) of approximately 75 and 74 % for 2014 and 2015 respectively; the average removal rate of ammonia nitrogen (NH3-N) of 65 and 69 %, while the average total nitrogen (TN) removal rate was 69 and 63 % and the total phosphorus (TP) removal rate was 75 and 73 % in 2014 and 2015, respectively. The water temperature along the experimental phase ranged from 13 to 22 °C. The removal of NH3-N showed the highest dependence on water temperature with values of R2 = 0.8787 in 2014 and R2 = 0.8957 in 2015. The volumetric reaction constant (kv d-1) in 2014 ranged from 0.041 to 0.185 d-1 with an average temperature in the wetland of 13 to 21 °C. While k presented an average value of 2.60 cm d-1 in 2014, and in 2015 the observed value was 3.22 cm d-1. It was evident that the value of kv augmented as the water temperature increased, which indicates that this factor has a direct effect on the removal of the NH3-N.
Key words Temperature; Reaction rate constant; Wetlands; Swine wastewater
La temperatura es un factor importante en los procesos que se llevan a cabo en los sistemas biológicos. En los humedales la capacidad de remoción de contaminantes está delimitada por factores ambientales. El objetivo fue determinar el efecto de la temperatura del agua sobre la constante de velocidad de reacción de contaminantes en un humedal de flujo superficial construido (HFSC) para la remoción de contaminantes en aguas residuales porcícolas. El HFSC consistió en un canal de 9 m de longitud por 3 m de ancho, recubierto con geo-membrana de alta densidad (4 mm). El lecho del HFSC consistió en una capa de 30 cm de arena y arcilla, con vegetación nativa del área de estudio. Se llevaron a cabo 12 corridas experimentales entre enero de 2014 y diciembre de 2015, con un tiempo de retención hidráulico (TRH) de 10 días. La remoción promedio de la demanda química de oxígeno (DQO) fue de 75 y 74 %, el promedio de remoción de nitrógeno (amonio) NH3-N de 65 y 69 %, mientras que el nitrógeno total (NT) presentó promedio de remoción de 69 y 63 %, mientras que la remoción del fósforo total (PT) presentó valores de 75 y 73 % en 2014 y 2015 respectivamente. La temperatura del agua durante la fase experimental osciló entre 13 y 22 °C. La remoción del NH3-N mostró la mayor dependencia de la temperatura del agua con valores de R 2=0.8787 en 2014 y R 2=0.8957 en 2015. La constante de reacción volumétrica (k v d-1) en 2014 osciló de 0.041 a 0.185 d-1 con una temperatura promedio en el humedal de 13 a 21 °C. Mientras k presentó un valor promedio de 2.60 cm d-1 en 2014, y en 2015 el valor obtenido fue de 3.22 cm d-1. Fue evidente que el valor de k v aumentó conforme la temperatura del agua se incrementó, lo cual indica que este factor tiene un efecto directo en la remoción del NH3-N.
Palabras clave Temperatura; Constante de reacción; Humedales; Aguas residuales porcícolas
Introduction
In Mexico, the increase in the discharge of wastewater from various activities has caused certain receptor bodies of water to exhibit different types and levels of pollution, generating a strong impact on the reduction of this resource which, unless treated with viable alternatives for its recovery, may cause irreversible damage1.
Approximately 420 m3 of wastewater are generated every second in Mexico; of these, 250 m3 s-1 are municipal, and 170 m3 s-1 are non-municipal; less than 25 % of the latter, the most polluting of which are issued by pig farms, receive no treatment2. For this reason, special attention has been given to the use of effective, environment-friendly technologies to remove the pollutants present in waste water, especially the nutrients such as nitrogen and phosphorus3,4. Conventional wastewater treatment technologies are generally effective. However, many of these technologies involve high installation costs and use large amounts of energy.
Certain researchers have proposed the use of constructed wetlands (CWs) as a viable alternative for removing nutrients from livestock wastewater5,6. The processes carried out in these systems are sundry, but the main nutrient removal processes are the growth of the microbial biomass and the adsorption of the nutrients by the vegetation5,7. The efficiency of the CWs in the removal of pollutants has been widely researched by several authors8-11. Constructed wetland can reach levels of ammonium removal of 80 to 99 %12,13,14.
The most important factors to be considered in the design of a wetland for its proper operation are the inflow, the load of organic matter, and the hydraulic retention time (HRT)15,16,17, although temperature is the primordial factor, as biological systems are involved18,19,20.
According to certain authors6, the efficiency of the wetland is segmented into seasonal cycles, and the effect of the temperature on the biotic reactions is greater at low temperatures (>15 °C) than at high temperatures (<20 °C). However, if the inflow and the concentrations in the wetland also vary seasonally, their affect will blend together with that of temperature21. The temperature also influences the denitrification process in the wetlands, which occurs under conditions of anoxia in the sediment or in anoxic micro-sites in the film adhered to the substrate or the tissue of plants21. Through this mechanism, nitrates can be removed in the wetlands22,23. In shallow wetlands, the process or degree of denitrification can reportedly be increased, due to the proximity of the nutrients in the sediment-water component24. For this reason, denitrification has been regarded as a very viable method for removing nitrogen from the wetlands23.
In a study carried out in Tennessee, USA, to assess the effect of vegetation and the HRT on pollutant removal capacity in wetlands, the average removal rate was found to be higher when using 6 days of HRT, compared to 2 days. Wetlands with vegetation exhibited favorable results; with 6 days of HRT, removal averages of 67 % were reported for the removal of ammonia nitrogen (NH3-N), and values ranging between 42 and 67%, for the chemical oxygen demand (COD); synthetic wastewater was utilized to simulate agricultural runoffs25. The capacity to remove total nitrogen (TN), NH3-N, total phosphorous (TP) and COD using a sub-surface wetland in domestic wastewater was assessed in Hong Kong. Two WRTs (5-10 days) and wetlands with and without vegetation were used. The results showed greater removal in wetlands with vegetation using the two retention times. A 68 and 72 % COD removal rate was obtained in wetlands with vegetation; the removal rates were 92 and 95 % for NH3-N, 65 and 62 % for TN, and 67 and 52 % for TP for days 10 and 5, respectively. The quality of the water obtained in the effluent met the standards of Hong Kong for use in recreational parks26. Another author27 researched the factors that affect phosphorus retention in a surface flow constructed wetland using wastewater from surface runoffs. The research was performed under cold environmental conditions in Norway. The results showed an average 21 to 44 % reduction of phosphorus. However, the removal percentage was observed to increase with a greater hydraulic load; the statistic results showed that the removal was influenced by different variables, such as the concentration of phosphorus in the influent, the time of the year, the phosphorus content of the suspended solids, and the sedimentation rate of phosphorus.
Constructed wetlands have also been utilized to treat wastewater from pig farms. In southern China, 2 SFWs were established using Vetiveria zizanioides in one, and Cyperus alternifolius in the other. The objective was to research the efficiency of the wetlands in the removal of organic matter from the wastewater from pig farms through the seasonal changes during four years. The removal of COD and the biological oxygen demand (BOD5) was 70 and 80 % in the spring, using two days of HRT. The removal rate was also reported to have reached up to 90 % in the summer, and to have dropped to 50 % for COD and 60 % for BOD5 in the fall. No significant differences were found between the two wetlands under experimentation; however, the difference between seasons of the year was significant28.
The availability and quality of water is a primordial need. However, there are risk factors associated to human activities and environmental factors, such as climate change29-32. The effects of extreme climate events are predicted to be reflected at once, primarily in food safety, as well as the availability of water for the various human activities29,32,33. The efforts to preserve this resource involve the use of alternative treatments that have a low installation cost and are environment friendly. Studies on the effect of the operational factors on the efficiency of the SFCW are numerous and sundry. However, so far, information about the SFC's pollutants removal efficiency related with the water temperature is scarce. The objective of this study was to determine the reaction rate constant of NH3-N, as well as to identify the seasonal effect of the water temperature on the removal rate of the COD, NH3-N, TN and TP contained in wastewater from pig farms through the use of a surface flow constructed wetland at pilot scale, in an effort to determine the functionality of this system under the climate conditions of the Highlands of Jalisco.
Material and methods
Characteristics of the farm
The research was carried out at the Santa María farm, located in the municipality of Arandas, in the state of Jalisco, 11 km to the northeast of the city of Arandas. The pig farm has 12 stalls, housing a total population of 12,000 pigs with some variations. For the intake process by the pigs and the cleaning of the pig pens, an average of 120,000 L d-1 of potable water are used and subsequently piped into a biodigester for decomposition of the organic matter; the effluent of the biodigester is then routed to a sedimentation lagoon.
Design of the system
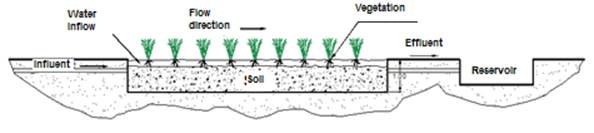
The variables considered in its design and construction were substrate, vegetation and water retention time. The surface flow wetland was built as a 9 m long x 3 m wide canal (Figure 1), with a 30 cm thick layer of a mixture of yellow sand and tezontle (volcanic rock) as support material for the vegetation and an approximately 5 % slope. The wetland was built with a (4 mm thick) high-density polyethylene geo-membrane, metal poles and a mesh as support for the channel. Vegetation (Thypa sp. and Scirpus sp.) from the surroundings of the farm was transplanted into the system and was maintained for a period of two months until it adapted to its new substrate.
Operation of the system
The wastewater used in his research was taken from the sedimentation lagoon at the outlet of the anaerobic digester. Because the concentration of the organic matter in the lagoon was approximately 7,160 mg L-1 of COD, it was necessary to dilute it with well water in order to obtain the desired concentration for the research. The water from the lagoon and from the well was pumped into a 2,500 L storage cistern equipped with fluxometers for regulating the amount of water required by each influent and thus obtaining the desired COD concentration. The cistern had an electric mixing motor connected to a pair of blades that were kept in constant motion.
Experimental design
The organic matter content and the temperature of the water were regarded as independent variables. The dependent variables were: the COD, NH3-N, TN and TP. Twelve experimental runs were carried out with a water retention time of 10 days and an organic load of 835 ± 64 mg L-1 of COD in 2014 and 774 ± 26 mg L-1 of COD in 2015.
Sampling and simple analysis
Samples were collected at the inlet and outlet the wetland, at 5-day intervals, and, on a weekly basis, from the sedimentation lagoon. The measured parameters were: Temperature (°C) (NMX-AA-007-SCFI-2000), COD (HACH 800 Method), TN (HACH 10072 Method), NH3-N (HACH 10031 Method) y TP (HACH 10127 Method). The equipment used consisted of a HATCH DRB 200 reactor and a HACH DR 2800 spectrophotometer.
Statistical analysis
An ANOVA was performed in order to determine the significant differences between the two years of the study period at a 0.05 confidence interval.
Estimation of the reaction rate constant and the temperature coefficient for NH3-N
The biological reactions occurring in the wetlands are generally described as first-order reactions. The first-order models usually work well in the long term21. In this study, the monthly averages of the concentrations of the constituents were determined for the assessment of the reaction rates.
The following first-order equation for a piston flow was utilized to describe the removal rate of NH3-N:
Where:
C e is the average NH3-N concentration in the effluent (mg L-1);
C 0 is the average concentration of the nutrient in the influent (mg L-1), and
k v is the volumetric removal rate constant (d-1).
The values of k v were estimated using the following equation:
According to others authors30, the areal removal rate constant is expressed as follows:
Where:
k is the temperature dependent removal rate constant in a given area (cm d-1);
Ɛ is the porosity constant of the fraction of space through which water can flow in the wetland (and which has been estimated for the several types of wetlands: 0.75 for the surface flow wetland, and 0.4 for the sub-surface flow wetlands);
h is the depth of the system21,34.
Equation 1 can be modified substituting k v by using Equation 2, as follows:
Where:
HLR is the hydraulic load (cm d-1).
The effect of temperature on k v or k can be summarized using the Arrhenius equation:
Where;
K v20 is the volumetric removal constant at 20 °C (d-1); θ is the temperature coefficient, and T is the temperature of the water (°C). The slope ln(θ) and the intersection of the line ln(k v ) were estimated by charting ln(k v ) vs (T-20) and through a linear regression analysis. The coefficient of determination (R2) was estimated in order to assess the adjustment of all the regressions.
Results and discussion
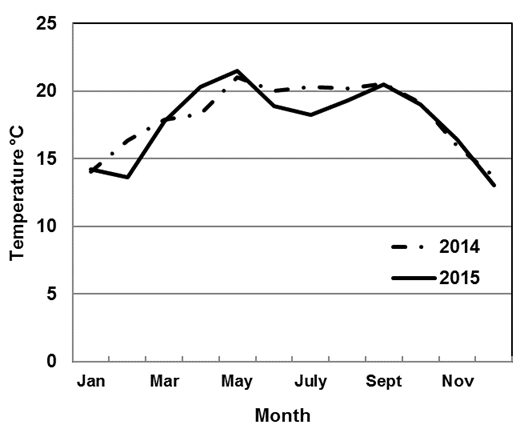
The average temperature of the water in the influent of the wetland in the year 2014 was 18.1 ± 2.2 °C, while in 2015 the average temperature was 17.7 ± 2.6 °C. Figure 2 shows the behavior of the monthly average of the temperature. In 2014, the lowest temperature (°C) was observed in December (13.6 °C), while the highest occurred in May (21 °C). The same behavior was observed in 2015, with the lowest temperature occurring in December, with an average value of 13 °C, and the highest temperature was observed in May (21.5 °C). In the year 2014 there was a stage during which the variability remained without significant changes (June - September), and then the temperature descended gradually until reaching the minimum level in the month of December. It may also be observed that the changes in temperature were more drastic in 2015 during the same months (June - September), reaching a minimum in December. Therefore, it is important to consider the seasonality, with the consequent influence of the rainy season on the low temperature of the water -a condition to be expected.
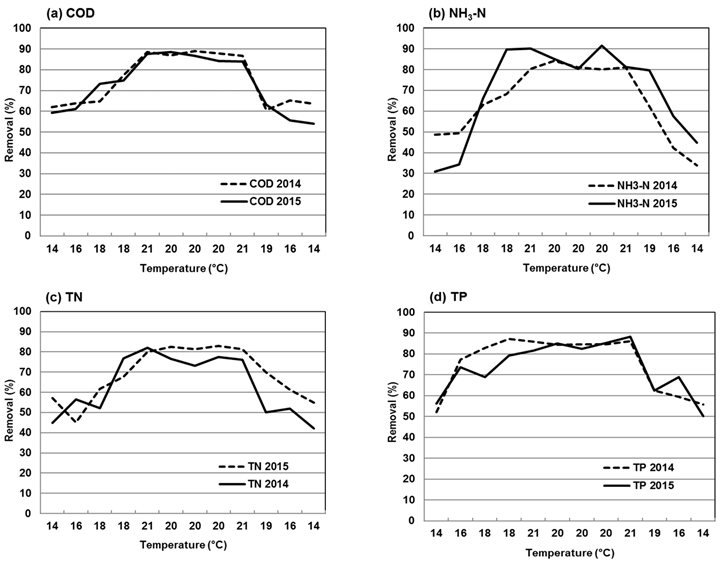
The results of the efficiency of the SFCW for the removal of the organic matter are shown in Figure 3a. As may be observed, the average removal rate of COD in the year 2014 was 75 ± 12 %, while in 2015 the average was slightly lower, with a value of 74 ± 13 %. The minimum removal rate in 2014 (37 %) occurred in January, with an average temperature of the water of 14 °C, and the maximum removal rate (76 %) was reached in May, with an average temperature of the water of 21 °C. The minimum removal rate in 2015 (54 %) occurred in December, when the average temperature of the water was 13 °C. The maximum value (89 %) was obtained in June, when the average temperature was 19 °C. The removal rate of COD was stable during the years of study. Notably, for instance, in winter the removal rate was approximately 60 %, increasing by approximately 10 % in spring; the system may be observed to have attained its maximum capacity in the summer, with a COD removal rate of approximately 88 %, while in the fall, it ranged between 60 and 70 %.
There was no significant difference (P>0.05) in the COD removal rate between 2014 and 2015. The regression analysis between the temperature of the water and the COD removal rate yielded a R 2 value of 0.661 in the year 2014, and of 0.626 in 2015 (Figure 4a). In general, in the various studied years, the relationship between the COD removal rate and the temperature was moderately strong. The results obtained in this research agree with those of other researches28; those authors studied the efficiency of a wetland in removing organic matter and nutrients from an effluent of a pig farm and they determined a COD removal rate of 90 %; however, the levels obtained the rest of the year were lower than those estimated by this research.
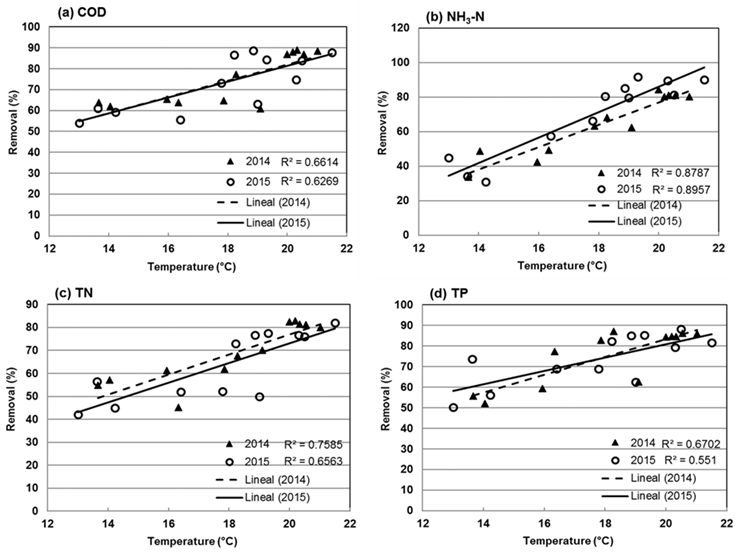
Figure 4 Linear regression and determination coefficient between the pollutant removal rate and the water temperature (a) COD, (b) NH3-N, (c) TN and (d) TP in 2014 and 2015
Although the results of the removal rate coincide, there are differences in the HRT, as these authors used only two days, whereas in the present research the HRT was 10 d -a considerable difference (8 d) in the time of exposure to the nutrient in the system. Another difference in regard to the present research was the COD concentration in the influent; those authors used concentrations of 1,000 to 1,400 mg L-1, whereas in the present research the influent showed little variability, having been 835 ± 64 mg L-1 in 2014 and 774 ± 26 mg L-1 in 2015. The authors ascribed the efficiency of the wetland to several factors, such as the season of the year, as the maximum removal rates in the assessed parameters were attained in the summer.
On the other hand, other techniques have been utilized to try to increase the removal rate of pollutants in wetlands; several authors32 assessed the effect of the application of oxygen to a surface flow wetland, obtaining an increase of 20 % in the organic matter removal rate. However, other processes, such as nitrification, were also negatively affected, as no significant NH3-N removal rate increase (27-48 %) was obtained in the wetland.
The results for NH3-N removal are shown in Figure 3b. In 2014, the mean annual NH3-N removal rate was 65 ± 17 %. The lowest removal rate (34 %) was observed in December, when the average temperature was 14 °C. The maximum NH3-N removal rate (84 %) was obtained in June, with a mean temperature of 20 °C. In 2015, the average removal rate was 69 ± 22 %. The minimum value observed (31 %) occurred in January, with a temperature of 14 °C, while the maximum value (92 %) was obtained in August, with a mean temperature of 19 °C. The variance analysis showed a significant difference (P<0.05) between the NH3-N removal rate at different temperatures in 2014. That same year, a significant ratio (P<0.05) was estimated between the temperature and the NH3-N removal efficiency, with a R 2 of 0.895. For the year 2015, the linear regression showed a R 2 of 0.878 (Figure 4b). NH3-N removal was lower than 70 % when the temperature of the water was below 20 °C. Conversely, when the temperature was equal to or higher than 20 °C, the removal rate increased gradually until reaching levels above 80 % in almost all the cases, amounting to a 10 % increase for each added degree of water temperature.
The NH3-N reduction obtained in this research differed from that obtained in other studies. Other researches14 reported a 52 % removal rate. Other studies12 obtained a 100% NH3-N removal rate; however, these studies were performed at pilot scale with controlled environmental conditions, which influenced the results. The results obtained in this research were similar to those obtained by other authors13, as a NH3-N removal rate of approximately 85 % was estimated when assessing the efficiency of a surface flow wetland in southern Texas, USA, during the summer of 2008.
These results also agree with those mentioned by different authors35-38 who highlight the importance of temperature in ammonium removal from the wetlands. According to them, at low temperatures (5-10 °C), biological processes such as denitrification can be drastically inhibited. In general, the processes that take place in the nitrogen cycle are inhibited under cold climate conditions, as the amount of available oxygen diminishes considerably, and therefore the concentration of bacteria also decreases under extreme temperature conditions38. The arguments mentioned by these authors coincide with the results obtained in this research, as the NH3-N reduction was greater at higher temperatures and dwindled considerably in the cold season.
Figure 3c shows variability in the TN removal rate for the years 2014 and 2015. In 2014, the average TN removal rate showed a value of 69 ± 13 %. The minimum removal rate (45 %) occurred in February with a mean temperature of 16 °C. The maximum removal rate (82 %) was observed in June, when the mean temperature was 20 °C. In 2015, an average removal rate of 63 ± 15 % was obtained. The minimum value was observed in December (42 %), corresponding to a mean temperature of the water of 13 °C, while the highest value (82 %) occurred in May, with an average temperature of 22 °C. The mean TN removal rate obtained in this research is below that reported by other studies22 where averages of 95 to 98 % TN removal were obtained. However, their experiments used wastewater from aquaculture and from a combination of different types of wetlands. Other factors like the design of the wetland are important and have a direct impact on the efficiency of the system; for example, the results of other studies20 have suggested that HRT is one of the most important factors for TN removal; they proved that the TN removal rate can increase to up to 99 % with a 6 to 8-day HRT.
The statistical analysis showed that there are no significant differences (P>0.05) between the TN mean removal rates for the years 2014 and 2015. As for the effect of the temperature on the efficiency of TN removal, in the year 2014 a high determination coefficient (R 2=0.758) was obtained, while in 2015 this coefficient decreased slightly (R 2 =0.656), indicating a moderately strong relationship between the temperature and the TN removal rate, with a 95% confidence interval (Figure 4c).
Figure 3d shows the variability of the TP removal rate in the years of the study. The mean TP removal rate in 2014 was 75 ± 13 %, while in 2015 it was estimated in 73 ± 12 %. In the year 2014, the minimum value was obtained in January (52%), with a mean temperature of the water of 14 °C. The maximum removal rate (75 %) was observed in April, with a mean temperature of 18 °C. In 2015, the mean removal rate was 73 ± 17 %. The minimum value (50 %) occurred in December with a mean temperature of 13 °C, and the maximum value (88 %) was obtained in September, with a mean temperature of 20 °C. The statistical analysis showed that there are no significant differences between the two years analyzed in this study (2014 and 2015). Figure 4d shows the linear regression of the obtained data; in the year 2014, the determination coefficient was R 2 =0.670, indicating a moderately strong relationship between the TP removal rate and the temperature of the water in the wetland. As for the year 2015, the regression analysis yielded a determination coefficient of R 2=0.551. The results obtained in this research are above those reported in other studies, where a TP removal rate of 45 % was estimated39. Another author27 also reported a lower TP removal rate than the one obtained in the present study: he estimated an acceptable TP removal rate of 21 to 44 % in temperatures below 10 °C. This agrees with the results obtained by various authors, according to whom the P removal rate is less affected by the temperature due to the prevalence of the adsorption processes and sedimentation, as opposed to the biological processes. A large number of wetlands have been proven to operate less efficiently in a cold climate than in temperate climates38. Studies carried out in China at an ambient temperature of 4 °C and in Norway at 20 °C exhibited an acceptable reduction of pollutants when the wetland was artificially isolated from nature36.
Reaction rate constant and coefficient of temperature of ammonia nitrogen
Figures 5a and 5b show the relationship between k v and the monthly temperature of the water in the system for NH3-N during the years 2014 and 2015. The volumetric reaction rate constant (k v d -1) in 2014 ranged between 0.041 and 0.185 d-1 at mean temperatures of 13 °C to 21°C in the wetland. It was evident that the k v value increased exponentially with the increased temperature of the water. On the other hand, in 2014 k exhibited a mean value of 2.60 cm d-1, and in the year 2015 the estimated value was 3.22 cm d-1. The results obtained for k in the research were below those reported by another study11 carried out in Taiwan, where a value of k=6.26 cm d-1 was estimated in a surface flow wetland. However, the NH3-N concentration in the influent demonstrated a significant variability during the study (1-26 mg L-1). Conversely, in the present study, the NH3-N concentration remained constant, with little variability (33 ± 2.4 mg L-1 in 2014 and 36 ± 4.5 mg L-1 in 2015).

Conclusions and implications
This study proved the capacity of a SFCW for the reduction of pollutants like COD, NH3-N, TN and TP in wastewater from a pig farm. During the study period (2014 and 2015), the wetland showed an acceptable efficiency in the reduction of the assessed pollutants; however, in the specific case of NH3-N, the estimated removal rate was less than 60 % in the season with the lowest temperature, and above 75 % in the warm season, evidencing seasonal patterns in the removal rate. Unlike the case of NH3-N, the COD and TP removal rates exhibited little variability during the period in which the system operated. The removal rate of ammonium exhibited the greatest dependency on the temperature of the water. When the temperature of the water was above 17 °C, the vegetation grew faster, which also increased microbial activity and the NH3-N removal rate, and was significantly higher than when the temperature of the water was below 17 °C. It is recommended to evaluate other parameters such as the air temperature, the precipitation and the evaporation directly at the site in order to assess their effect on the behavior of the wetland.
Literatura citada
1. Rodríguez M, Jácome A, Molina J, Suárez J. Humedal de flujo vertical para tratamiento terciario del efluente físico-químico de una estación depuradora de aguas residuales domésticas. Ing Inv Tec 2013;14(2):223-235. [ Links ]
2. Romo CIA. Evaluación de la remoción de contaminantes procedentes de aguas residuales de origen porcícola mediante un humedal artificial en serie [tesis de licenciatura]. Universidad Politécnica de Pachuca, Zempoala, Hidalgo; 2015. [ Links ]
3. Díaz FJ, O′Geena A, Dahlgrena RA. Agricultural pollutant removal by constructed wetlands: Implications for water management and design. Agr Water Manage 2012;(104):171-183. [ Links ]
4. Jordan TE, Whighama DF, Hofmockel KH, Pittek MA. Nutrient and sediment removal by a restored wetland receiving agricultural runoff. J Environ Qual 2003;(32):1534-1547. [ Links ]
5. Vymazal J. Constructed wetlands for wastewater treatment. Water 2010;2(3):530-549. [ Links ]
6. Kadlec RH, Reddy KR. Temperature effects in treatment wetlands. WaterEnviron Res 2001;73(5):543-557. [ Links ]
7. Dong X, Reddy GB. Soil bacterial communities in constructed wetlands treated with swine wastewater using PCR-DGGE technique. Bioresource Technol 2010;101(4):1175-1182. [ Links ]
8. Hammer DA. Constructed wetlands for wastewater treatment-Municipal, industrial and agricultural. 1ra ed. Inc, Michigan, USA: Lewis Publishers; 1989. [ Links ]
9. Kadlec RH, Hey DL. Constructed wetlands for river water quality improvement. Water Sci Technol 1994;29(4):159-168. [ Links ]
10. Jing SR, Lin YF, Lee DY, Wang TW. Nutrient removal from polluted river water by using constructed wetlands. Bioresource Technol 2001;76(2):131-135. [ Links ]
11. Jing SR, Lin YF. Seasonal effect on ammonia nitrogen removal by constructed wetlands treating polluted river water in southern Taiwan. Environ Pollut 2004;(127):291-301. [ Links ]
12. Drizo A, Frost CA, Smith KA, Grace J. Phosphate and ammonium removal by constructed wetlands with horizontal subsurface flow, using shale as a substrate. Water Sci Technol 1997;35(5):95-102. [ Links ]
13. De La Mora-Orozco C. Nutrient Removal Prediction Using Hyperspectral Reflectance Indices and Modeling for a Pilot Constructed Channel Treatment Wetland [doctoral thesis]. Kingsville, Texas, USA: Texas A&M University-Kingsville; 2009. [ Links ]
14. Cameron K, Madramootoo C, Crolla A, Kinsley C. Pollutant removal from municipal sewage lagoon effluents with a free-surface wetland. WaterRes 2003;37(12):2803-2812. [ Links ]
15. Bastian RK, Shanaghan PE, Thompson BP. Use of wetlands for municipal wastewater treatment and disposal-regulatory issues and EPA policies. In: Hammer DA editor. Constructed wetlands for wastewater treatment-Municipal, industrial and agricultural. Chelsea, Michigan USA: Lewis Publishers; 1991. [ Links ]
16. Jing SR, Lin YF, Wang TW, Lee DY. Microcosm wetlands for wastewater treatment with different hydraulic loading rates and macrophytes. J Environ Qual 2002;(31):690-696. [ Links ]
17. Kuschk P, Wiener A, Kappelmeyer U, Weibrodt E, Kästner M, Stottmeister U. Annual cycle of nitrogen removal by a pilot-scale subsurface horizontal flow in a constructed wetland under moderate climate. Water Res 2003;37(17):4236-4242. [ Links ]
18. Hill DT, Payton JD. 1998. Influence of temperature on treatment efficiency of constructed wetlands. Transaction of ASAE 1998;41(2):393-396. [ Links ]
19. Akratos CS, Tsihrintzis VA. Effect of temperature, HRT, vegetation and porous media on removal efficiency of pilot-scale horizontal subsurface flow constructed wetlands. Ecol Eng 2007;(29):173-191. [ Links ]
20. Akratos CS, Papaspyros JNE, Tsihrintzis VA. Total nitrogen and ammonia removal prediction in horizontal subsurface flow constructed wetlands: Use of artificial neural networks and development of a design equation. Bioresource Technol 2009;100(2):586-596. [ Links ]
21. IWA. Special Group on Use of Macrophytes in Water Pollution Control, Constructed Wetlands for Pollutant Control. Scientific and Technical Report No 8. London, England. IWA Publishing; 2000. [ Links ]
22. Lin YF, Jing SR, Lee DY, Wang TW. Nutrient removal from aquaculture wastewater using a constructed wetlands system. Aquaculture 2002;(209):169-184. [ Links ]
23. Tanner CC, Sukias JPS, Headley TR, Yates CR, Stott R. Constructed wetlands and denitrifying bioreactors for on-site and decentralized wastewater treatment: Comparison of five alternative configurations. Ecol Eng 2012;(42):112-123. [ Links ]
24. Almendinger JE. A method to prioritize and monitor wetland restoration for water-quality improvement. Wetl Ecol Manag 1999;(6):241-251. [ Links ]
25. Hunter RG, Combs DL, George DB. Nitrogen, phosphorous, and organic carbon removal in simulated wetland treatment systems. Arch Environ Contam Toxicol. 2001;41(3):274-281. [ Links ]
26. Chung AKC, Wu Y, Tam NFY, Wong MH. Nitrogen and phosphate mass balance in a sub-surface flow constructed wetland for treating municipal wastewater. Ecol Eng 2008;32(1):81-89. [ Links ]
27. Braskerud BC. Factors affecting phosphorus retention in small constructed wetlands treating agricultural non-point source pollution. Ecol Eng 2002;19(1):41-61. [ Links ]
28. Liao X, Luo S. Treatment effect of constructed wetlands on organic matter in wastewater from pig farm. J Appl Ecol 2002;13(1):113-117. [ Links ]
29. IPCC. Intergovernmental Panel on Climate Change (Panel Intergubernamental sobre Cambio Climático). Summary for policymakers of Climate Change, The physical science basis. In: contribution of working group I to the fourth assessment report of the intergovernmental panel on climate change. Cambridge, Cambridge University Press, UK.; 2007. [ Links ]
30. Trenberth KE, Smith L. The mass of the atmosphere: A constraint on global analyses. J Clim 2005;(18):864-875. [ Links ]
31. Karmalkar AV, Taylor MA, Campbell J, Stephenson MT, Centella NA, Benzanilla A, et al. A review of observed and projected changes in climate for the islands in the Caribbean. Atmósfera 2013;26(2):283-309. [ Links ]
32. De La Mora-Orozco C, Ruíz CJA, Flores LHE, Zarazúa VP, Ramírez OG, Medina GG, et al. Climate Change index in the Chiapas Mexico during 1960-2009. Rev Mex Cienc Agr 2016;(13):2523-2534. [ Links ]
33. Kadlec RH, Knight RL. Treatment Wetlands. Boca Raton, Florida, USA. CRC Press, Inc; 1996. [ Links ]
34. Reed SC, Crites RW, Middlebrooks EJ. Natural systems for waste management and treatment, second ed. New York, USA: McGraw-Hill, Inc; 1995. [ Links ]
35. Sun G, Zhao Y, Allen S. Enhanced removal of organic matter and ammoniacal-nitrogen in a column experiment of tidal flow constructed wetland system. J Biotec 2005;115(2):189-197. [ Links ]
36. Wießner A, Kuschk P, Kästner M, Stottmeister U. Abilities of helophyte species to release oxygen into rhizosphere with varying redox conditions in laboratory scale hydroponic systems. Int J Phytoremediation 2002;(1):1-15. [ Links ]
37. Picard CR, Fraser LH, Steer D. The interacting effects of temperature and plant community type on nutrient removal in wetland microcosms. Bioresour Technol 2005;96(9):1039-47. [ Links ]
38. Spieles DJ, Mitsch WJ. The effects of season and hydrologic and chemical loading on nitrate retention in constructed wetlands: a comparison of low-and high nutrient riverine systems. Ecol Eng 1999;(14):77-91. [ Links ]
39. Prochaska CA, Zouboulis AI. Removal of phosphates by pilot vertical-flow constructed wetlands using a mixture of sand and dolomite as substrate. Ecol Eng 2006;26(3):293-303. [ Links ]
Received: November 03, 2017; Accepted: November 25, 2018
 Este es un artículo publicado en acceso abierto bajo una licencia Creative Commons
