


Services on Demand
Journal
Article
 text in
  English (pdf)
 Article in xml format
 Article references
 Send this article by e-mail
Indicators
-
 Cited by SciELO
 -
 Access statistics
Related links
-
 Similars in
SciELO
Similars in
SciELO
Share

 Permalink
Revista mexicana de ciencias agrícolas
Print version ISSN 2007-0934
Rev. Mex. Cienc. Agríc vol.14 n.4 Texcoco May./Jun. 2023 Epub Aug 04, 2023
https://doi.org/10.29312/remexca.v14i4.3476
Articles
Population dynamics of stems in Urochloa hybrids with different harvest intensity
1Facultad de Ingeniería y Ciencias-Universidad Autónoma de Tamaulipas. Centro Universitario, Cd. Victoria, Tamaulipas. CP 8700 (lucioruizfernando@outlook.com; alimas@docentes.uat.edu.mx).
2Campo Experimental Las Huastecas-INIFAP. Carretera Tampico-Mante km 55 Villa Cuauhtémoc, Altamira, Tamaulipas, México. CP 89610 (garay.jonathan@inifap.gob.mx).
The stability of the stem population allows analyzing the variations in the rates of appearance, death and survival, so the objective of this research was to determine the effect of harvest intensity (15 and 25 cm) on the stability of the population of stems of hybrid Urochloa Mulato II, Cayman and Mavuno. The study was conducted from March 2020 to February 2021 in Güémez, Tamaulipas, Mexico. In established meadows, 18 experimental plots of 3 x 3 m were delimited. In each experimental unit, two areas of 100 cm2 were placed to select the initial population of stems and count the dead stems and tillers present every four weeks. Differences were found between the intensities and sampling dates for the variables stem density, tillering rate, and stability index (p< 0.05). The cutting intensity of 15 cm generated the highest density of stems with 2 545, 2 996 and 2 200 stems m2 in Mulato II, Cayman and Mavuno, respectively, as a result of tillering rates greater than 12% without showing differences in death rates and survival percentage. The cutting intensity of 15 cm averaged stability indices of 0.98 and 0.96 in Mulato II and Mavuno, while negative stability (0.93) occurred in Cayman. The cutting intensity of 15 cm allowed maintaining the stability of the population of stems of the Urochloa hybrids Mulato II and Mavuno over time.
Keywords: intensity; persistence; survival
La estabilidad de la población de tallos permite analizar las variaciones en las tasas de aparición, muerte y supervivencia, por lo que, el objetivo de esta investigación fue determinar el efecto de la intensidad de cosecha (15 y 25 cm) en la estabilidad de la población de tallos de Urochloa híbrido Mulato II, Cayman y Mavuno. El estudio se realizó de marzo de 2020 a febrero de 2021 en Güémez, Tamaulipas, México. En praderas establecidas se delimitaron 18 parcelas experimentales de 3 x 3 m. En cada unidad experimental se colocaron dos áreas de 100 cm2 para seleccionar la población inicial de tallos y cada cuatro semanas contar los tallos muertos e hijuelos presentes. Se encontraron diferencias entre las intensidades y fechas de muestreo para las variables densidad de tallos, tasa de ahijamiento, e índice de estabilidad (p< 0.05). La intensidad de corte de 15 cm generó la mayor densidad de tallos con 2 545, 2 996 y 2 200 tallos m2 en Mulato II, Cayman y Mavuno, respectivamente, como resultado de tasas de ahijamiento mayores a 12% sin presentar diferencias en las tasas de muerte y porcentaje de sobrevivencia. La intensidad de corte de 15 cm promedió índices de estabilidad de 0.98 y 0.96 en Mulato II y Mavuno, mientras que, en Cayman se presentó estabilidad negativa (0.93). La intensidad de corte de 15 cm permitió mantener la estabilidad de la población de tallos de los híbridos Urochloa Mulato II y Mavuno a través del tiempo.
Palabras clave: intensidad; persistencia; supervivencia
Introduction
In Mexico, extensive cattle farming is carried out in pastures of semiarid regions (Velázquez et al., 2015), where the main source of food is scrubland, grasses and weeds (Romero-Paredes and Ramírez, 2003), with native and introduced plant species (Elizondo and Boschini, 2002; Quero et al., 2007); nevertheless, the distribution of rainfall in these sites is erratic, which ranges between 350 and 600 mm per year for the semiarid zone and less than 350 mm for the arid zone (Tarango, 2005), coupled with this, prolonged periods of drought produce a decrease in animal production (Cuartas et al., 2014), because plants stop their development and therefore the availability of forage decreases (Carmona-Muñoz et al., 2003).
In this context, species of the genus Urochloa have been introduced in the state of Tamaulipas, with yields of up to 10.13 t ha-1 of dry matter accumulated in the season of maximum precipitation, which corresponds to the months of May to October, in contrast to 1.36 t ha-1 present in the months of November to April with a management program at intervals of eight weeks between cuts, yields higher than Pennisetum ciliare H-17 (Garay-Martínez et al., 2018).
The hybrids derived from the genus Urochloa have been developed with characteristics that make them tolerant to deficit of moisture in the soil, even to reach permanent wilt without presenting changes in leaf turgor and obtain greater leaf biomass compared to their parents U. decumbens and U. brizantha (Carmona-Muñoz et al., 2003). However, the response of species in morphological and structural characteristics depends on various factors, such as plant age, its genetic composition, climatic conditions and agronomic management (Garay-Martínez et al., 2018).
With agronomic management, in addition to seeking yield and nutritional value, it is sought to increase the time of use of the area established with the genotype of interest, that is, to increase the persistence of the meadow through stability in the density of stems (Rojas et al., 2016), which depends on the response of the processes of formation, death and survival of these (Ramírez et al., 2020).
In this sense, the frequency and intensity of cutting are variables that generate changes in the composition and permanence of the meadow (Cruz-Hernández et al., 2017), since, as there is a higher density of stems, forage yield increases and it maintains population stability of stems (Morales et al., 2012). The research aimed to determine the effect of cutting intensity on the population dynamics of stems of three Urochloa hybrids (Mulato II, Cayman and Mavuno) under rainfed conditions.
Materials and methods
The study was conducted from March 2020 to February 2021 at the Zootechnical Post ‘Ingeniero Herminio García González’, located in the municipality of Güémez, Tamaulipas, Mexico (23° 56’ 17.55” north latitude, 99° 06’ 2.45” west longitude), at 167 masl. The climate of the place is of the semiarid type [BS1 (h’) hw with rains in summer and up to 10% in winter (Vargas et al., 2007)].
The soil has a clayey texture (11.3, 23.3 and 65.4% sand, silt and clay, respectively), with pH of 8.3, the sodium adsorption ratio is 0.19, 4.2% organic matter, 0.25% N and 7.4, 288.6, 1.4 and 0.5 mg kg-1 of P, K, Fe and Zn, respectively (Garay-Martínez et al., 2018). The average minimum temperature ranges between 10 and 26 °C, the maximum between 18 and 34 °C and the average accumulated precipitation of the place is 750 mm per year (Figure 1).

The established meadows of hybrid Urochloa Mulato II, Cayman and Mavuno were sown in rows 0.30 m apart and continuously within the row, at a sowing density of 5 kg ha-1. There was no fertilization or irrigation during the experiment. At the beginning of the research, during the month of March 2020, a cut was made to standardize the meadows and define the areas of the treatments according to the intensity levels, 15 and 25 cm, subsequently, the stem count dates were carried out every 4 weeks and homogenization cuts were made according to the defined intensity. The six treatments defined by the three cultivars and two cutting intensities were distributed in 18 experimental plots of 3 x 3 m with three repetitions.
After making the uniformity cut (March, 2020), two fixed wire squares of 10 x 10 cm were placed in each experimental unit and the live stems present in the area were marked with rings of the same color, defining them as the initial population and every four weeks (sampling dates) the tillers were marked with a new color, each date formed a generation of stems, while the dead stems were removed from the sampling area and the data were recorded.
The data obtained were used to calculate changes in the stem population density (SPD; stems m2), tillering rate (TR) and stem death rate (DR) between each evaluation date with the following formulas according to the formulas described by Ramírez et al. (2020):
The stem survival rate (SSR) was obtained as follows:
The stem population stability index (PSI) was obtained with the following formula:
Where: the PSI is the ratio between the final or current population and the previous population of stems observed, considering the stem survival rate and tillering rate. Its value indicates the effect of tillering and death of the stems in relation to the total density, for a given period, values close to or equal to 1 (0.95 to 1.05) indicate a population of stems in equilibrium and a negative and positive stability presents values less than 0.95 and greater than 1.05, respectively.
The response variables (SPD, TR, DR, SSR and PSI) were analyzed using PROC GLM (SAS, 2002) through an analysis of variance with a randomized complete block design and factorial arrangement (3 × 2 × 12) where the study factors were cultivars (Mulato II, Cayman and Mavuno), cutting intensities (15 and 25 cm) and sampling dates (12 dates), in addition, the Tukey test (p= 0.05) was performed for the comparison of means.
Results and discussion
In the Urochloa hybrids, differences were found between intensities and sampling dates for the variables stem density, tillering rate, and stability index (p< 0.05 ), while in the death rate and survival rate there were differences only between the intensities of the hybrid Mavuno, with differences between sampling dates in the six treatments (p< 0.05).
Stem population density
The average stem population density was higher at the intensity of 15 cm by 11.4, 4.7 and 11.0% in the hybrids Mulato II, Cayman and Mavuno, respectively, compared to the intensity of 25 cm (Table 1). In addition, there was a decrease at the end of the evaluation (February-2021), compared to the initial population (March-2020), of 31 and 51% at the intensity of 15 and 25 cm, respectively, in Mulato II, 39 and 75% for Cayman and 23 and 32% for Mavuno at the same intensities (Table 1).
Table 1 Stem population density (stems m2) of Urochloa cultivars at different cutting intensity with an interval of four weeks.
| Treatments | |||||||||||||
| Sampling | Mulato II | Cayman | Mavuno | ||||||||||
| 15 cm | 25 cm | 15 cm | 25 cm | 15 cm | 25 cm | ||||||||
| Mar. 20 | 2 683 | ab | 2 833 | a | 3 433 | a | 3 983.0 | a | 2 558 | a | 2 646 | a | |
| Apr. 20 | 2 483 | ab | 2 650 | ab | 3 500 | a | 3 733.0 | ab | 2 050 | bc | 1 975 | ab | |
| May. 20 | 2 133 | ab | 2 533 | ab | 2 800 | abcd | 2 967.0 | cd | 1 816 | c | 1 408 | b | |
| Jun. 20 | 2 250 | ab | 2 400 | ab | 2 994 | abc | 3 100.0 | bcd | 1 991 | bc | 1 537 | ab | |
| Jul. 20 | 2 811 | a | 2 250 | ab | 2 694 | bcd | 2 800.0 | cd | 2 083 | abc | 1 750 | ab | |
| Aug. 20 | 2 717 | a | 2 433 | ab | 2 850 | abcd | 3 033.0 | cd | 2 408 | ab | 2 150 | ab | |
| Sep. 20 | 2 639 | ab | 2 050 | abc | 2 616 | cd | 3 133.0 | bcd | 2 258 | abc | 2 500 | ab | |
| Oct. 20 | 2 955 | a | 2 350 | ab | 2 483 | cd | 3 166.0 | bc | 2 291 | abc | 2 287 | ab | |
| Nov. 20 | 2 911 | a | 2 227 | ab | 2 566 | cd | 3 033.0 | cd | 2 158 | abc | 2 050 | ab | |
| Dec. 20 | 2 733 | a | 2 033 | abc | 2 700 | bcd | 2 483.0 | e | 2 442 | ab | 1 991 | ab | |
| Jan. 21 | 2 383 | ab | 1 916 | bc | 2 383 | cd | 1 833.0 | e | 2 158 | abc | 1 425 | b | |
| Feb. 21 | 1 847 | b | 1 375 | c | 2 094 | d | 983.0 | f | 1 966 | bc | 1 787 | ab | |
| Average | 2 545 | A | 2 254 | B | 2 996 | A | 2 855.6 | B | 2 200 | A | 1 959 | B | |
| SEM | 67.36 | 87.12 | 86.34 | 152.18 | 52.39 | 90.10 | |||||||
Lowercase literals compare averages between sampling dates in each intensity by cultivar. Uppercase literals compare means of averages between intensities by cultivar. Different literal indicates significant differences (Tukey; p= 0.05). SEM= error standard of the mean.
The evaluation over time with established cutting interval defined the behavior in the density of stems in the three hybrids, the hybrid Mulato II showed differences between the intensities from October, with the intensity of 15 cm remaining higher by 20% on average until January, Figure 2, therefore, it is probably a function of the environmental conditions present in January and February, Figure 1. In this regard, the behavior of the stem population density with prolonged cutting interval in the cultivar Mulato II in conjunction with four cultivars of Urochloa presented densities greater than 4 000 stems m2; however, no significant differences were found between cultivars (Lucio et al., 2023), therefore, for this experiment the cutting intensity is crucial to determine the effect on the stem population density, since it has been established that, after mechanical or grazing defoliation, stem density growth is induced, which lasts until 21 and 28 days in Andropogon gayanus, for example (Ramírez et al., 2020).
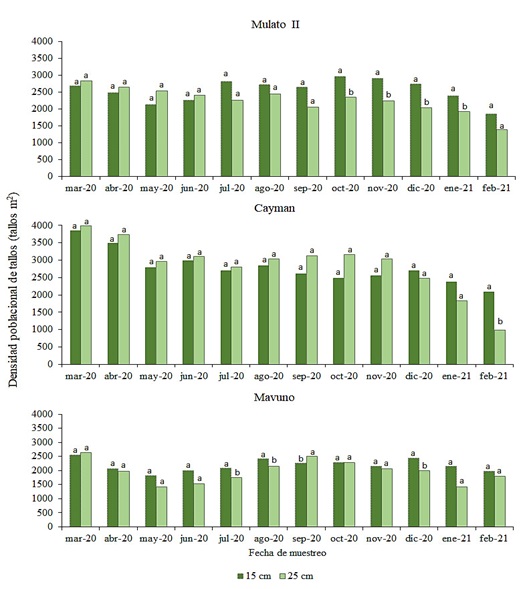
Figure 2 Effect of cutting intensity (15 and 25 cm) on stem population density (stems m2), with a fixed interval of four weeks.
Regarding the hybrid Cayman, it did not show differences between intensities (p≤ 0.05) during the evaluation, except for February, in which the intensity of 15 cm was 53% higher compared to the intensity of 25 cm, the same behavior occurred in another study when evaluating the cultivar Cayman in the period from June to December with a fixed intensity of 15 cm and an interval of four weeks (Lucio-Ruiz et al., 2021), as in this experiment there were no differences between these dates, so it is proposed that the cutting intensity for this cultivar is 15 cm without affecting the stem population density throughout the year, likewise, this intensity has been related to obtaining yields of up to 8.8 t ha-1 of dry matter accumulated during the season of maximum precipitation in Güémez, Tamaulipas (Garay-Martínez et al., 2018).
The hybrid Mavuno showed variations in stem population density in the months of July, August and December, favoring the intensity of 15 cm, while in September the intensity of 25 cm was 11% higher, Figure 2, it suggests a response to the precipitation accumulated in September, given that having lower density per area in the previous sampling and when favorable conditions are propitiated, the density of stems increases, the same response occurred in the grass Mulato (36061), when evaluated in the northerly wind, dry and rainy seasons, the highest density of stems was present in the rainy season regardless of the cutting intensity (Cruz-Hernández et al., 2017).
When evaluating the Urochloa hybrid Mulato at intensities of 10 and 14 cm in height, Cruz-Hernández et al. (2017) found that the intensity of 10 cm generates higher density of stems (between 3 280 and 5 729 stems m2); nevertheless, the precipitation in this place occurred in greater quantity from June to October with more than 1 400 mm, while in the place of this study there is an average annual precipitation of 750 mm, coupled with extreme temperatures, therefore, due to the ideal conditions for the emergence of tillers, it generates a higher density of stems through the regrowth stage (Ramírez et al., 2011). During this stage, the activation of the active meristematic zone located at the base of the stems occurs, thanks to the presence of reserve carbohydrates (Rincón et al., 2008).
Tillering and stem death rate
The highest tillering rates occurred at the intensity of 15 cm on average, compared to that of 25 cm, in addition, during the month of September there were the highest tillering rates at both intensities and for the three hybrids, because it is the month of maximum accumulation of precipitation, which favors the tillering of new stems (Table 2).
Table 2 Rates of tillering and stem death of Urochloa cultivars at two harvest intensities with an interval of four weeks.
| Treatments | |||||||||||||
| Sampling | Mulato II | Cayman | Mavuno | ||||||||||
| 15 cm | 25 cm | 15 cm | 25 cm | 15 cm | 25 cm | ||||||||
| Tillering rate | |||||||||||||
| Apr. 20 | 2.1 | d | 2.1 | b | 8.1 | bc | 5.2 | bc | 20.2 | ab | 3.9 | d | |
| May. 20 | 18.1 | bcd | 5.3 | ab | 10.7 | bc | 8.1 | bc | 9.1 | bc | 12.2 | bc | |
| Jun. 20 | 23.2 | bc | 10.1 | ab | 20.9 | ab | 11.3 | b | 14.4 | abc | 9.1 | bcd | |
| Jul. 20 | 27.0 | ab | 11.7 | ab | 14.0 | abc | 3.2 | c | 16.5 | abc | 8.8 | bcd | |
| Aug. 20 | 17.5 | bcd | 12.7 | ab | 23.7 | a | 22.3 | a | 21.9 | ab | 29.1 | a | |
| Sep. 20 | 42. | a | 15.8 | ab | 25.0 | a | 24.7 | a | 29.0 | a | 29.6 | a | |
| Oct. 20 | 31.1 | ab | 4.8 | ab | 4.8 | c | 7.5 | bc | 25.4 | a | 14.0 | b | |
| Nov. 20 | 9.4 | cd | 5.1 | ab | 8.1 | c | 2.7 | c | 18.3 | abc | 5.6 | cd | |
| Dec. 20 | 8.5 | cd | 7.5 | ab | 9.5 | bc | 2.3 | c | 15.6 | abc | 6.3 | cd | |
| Jan. 21 | 3.2 | d | 7.8 | ab | 2.0 | c | 3.7 | c | 4.5 | c | 11.0 | bc | |
| Feb. 21 | 11.0 | cd | 27.5 | a | 4.8 | c | 4.8 | bc | 23.9 | ab | 3.2 | d | |
| Average | 17.6 | A | 10.0 | B | 12.0 | A | 8.7 | B | 18 | A | 11.1 | B | |
| SEM | 2.2 | 1.6 | 1.4 | 1.3 | 1.6 | 1.9 | |||||||
| Death rate | |||||||||||||
| Apr. 20 | 7.9 | bc | 8.8 | cde | 6.3 | bcd | 12.5 | cde | 24.7 | abcd | 28.9 | ab | |
| May. 20 | 0.0 | c | 0.0 | e | 20.4 | abcd | 19.3 | cd | 10.4 | cde | 6.9 | bc | |
| Jun. 20 | 18.3 | b | 19.0 | c | 22.6 | abc | 7.0 | e | 0.5 | e | 0.0 | c | |
| Jul. 20 | 18.7 | b | 18.3 | cd | 23.3 | abc | 12.4 | cde | 25.0 | abc | 10.3 | bc | |
| Aug. 20 | 4.5 | bc | 8.5 | de | 20.2 | abcd | 6.4 | e | 5.5 | de | 8.1 | bc | |
| Sep. 20 | 52.5 | a | 30.5 | b | 25.2 | abc | 19.1 | cd | 31.8 | ab | 17.4 | abc | |
| Oct. 20 | 15.4 | bc | 7.1 | e | 9.6 | bcd | 8.5 | de | 5.7 | cde | 13.1 | abc | |
| Nov. 20 | 11.0 | bc | 5.3 | e | 4.7 | cd | 5.0 | e | 15.8 | bcde | 21.0 | abc | |
| Dec. 20 | 3.8 | bc | 1.2 | e | 1.2 | d | 21.9 | bc | 1.3 | e | 7.9 | bc | |
| Jan. 21 | 21.6 | b | 47.2 | a | 26.0 | ab | 31.5 | b | 18.3 | bcde | 38.0 | a | |
| Feb. 21 | 41.1 | a | 45.4 | a | 39.5 | a | 51.6 | a | 41.7 | a | 37.8 | a | |
| Average | 17.7 | A | 17.4 | A | 18.4 | A | 17.8 | A | 16.4 | A | 17.8 | A | |
| SEM | 2.8 | 2.8 | 2.2 | 2.4 | 2.85 | 3.0 | |||||||
Lowercase literals compare means between sampling dates in each intensity by cultivar. Uppercase literals compare means of averages between intensities by cultivar. Different literal indicates significant differences (Tukey; p= 0.05). SEM= standard error of the mean.
In this sense, during the month of August, where the phenomenon known as the dog days of summer occurs, accompanied by high temperatures, which cause greater thermal accumulation for grasses (Lucio et al., 2023) and the absence of precipitation (Pacheco-Hernández et al., 2020), the hybrids Cayman and Mavuno presented the highest tillering rate at both intensities (p< 0.05), possibly due to the use of carbohydrate reserves present at the base of the stems, crown and roots of plants, as a measure of perpetuation (Rincón et al., 2008). The opposite happened with the hybrid cultivar Cobra, which, as there was moisture restriction and temperature increase, the tillering rate decreased by 12% on average (Cámara-Acosta et al., 2022).
The death rate showed variations across the sampling dates (p< 0.05), and February was the month which presented the highest death rate in all cultivars and cutting intensities. Table 2, as a result of the minimum temperatures present prior to the sampling date, Figure 1, it also generated lower survival with values less than 65% in the six treatments on the same date. In the effect of the intensity for each cultivar, the intensity of 25 cm caused a 3% decrease on average compared to the intensity of 15 cm only in the survival of stems of the hybrid Mavuno, so exposing this cultivar to the intensity of 25 cm will affect the survival of the population of stems from one cutting date to another (Table 3).
Table 3 Survival rates and stability index of the stem population in Urochloa cultivars at two cutting intensities with an interval of four weeks.
| Treatments | |||||||||||||
| Sampling | Mulato II | Cayman | Mavuno | ||||||||||
| 15 cm | 25 cm | 15 cm | 25 cm | 15 cm | 25 cm | ||||||||
| Survival rate | |||||||||||||
| Apr. 20 | 91.7 | abc | 91.1 | ab | 91.4 | ab | 88.0 | ab | 75.25 | bcde | 71.1 | d | |
| May. 20 | 100.0 | a | 100.0 | a | 85.3 | bcd | 89.8 | ab | 89.5 | abc | 90.9 | abc | |
| Jun. 20 | 81.6 | bc | 82.8 | b | 80.2 | cde | 93.3 | ab | 99.4 | a | 99.5 | a | |
| Jul. 20 | 83.8 | bc | 81.6 | b | 76.6 | de | 87.5 | ab | 74.9 | cde | 91.0 | abc | |
| Aug. 20 | 95.4 | ab | 91.5 | ab | 89.7 | ab | 93.5 | a | 94.4 | ab | 91.8 | ab | |
| Sep. 20 | 54.0 | d | 69.4 | c | 74.7 | e | 80.8 | ab | 68.1 | de | 82.5 | bcd | |
| Oct. 20 | 87.6 | abc | 92.8 | ab | 87.3 | abc | 88.6 | ab | 94.2 | abc | 89.0 | abc | |
| Nov. 20 | 88.9 | abc | 91.3 | ab | 95.2 | a | 93.0 | ab | 85.9 | abcd | 78.9 | cd | |
| Dec. 20 | 96.1 | ab | 98.7 | a | 92.4 | ab | 79.5 | bc | 97.8 | a | 92.0 | ab | |
| Jan. 21 | 80.5 | c | 63.9 | cd | 73.9 | e | 66.3 | cd | 81.6 | abcd | 56.7 | e | |
| Average | 83.9 | A | 83.6 | A | 82.8 | A | 83.1 | A | 83.6 | A | 80.6 | B | |
| SEM | 2.4 | 2.4 | 1.7 | 2.2 | 2.8 | 3.6 | |||||||
| Stability index | |||||||||||||
| Apr. 20 | 0.91 | bcd | 0.94 | ab | 1.00 | dc | 0.90 | ab | 0.90 | bcd | 0.74 | d | |
| May. 20 | 1.16 | a | 1.04 | a | 0.91 | cde | 0.90 | ab | 0.95 | abc | 1.02 | ab | |
| Jun. 20 | 1.02 | abc | 0.88 | abc | 0.91 | cd | 1.05 | a | 1.14 | a | 1.09 | ab | |
| Jul. 20 | 1.00 | abcd | 0.90 | ab | 0.84 | def | 0.90 | ab | 0.83 | cd | 1.00 | bc | |
| Aug. 20 | 1.15 | a | 1.00 | a | 1.14 | a | 1.06 | a | 1.10 | ab | 1.21 | a | |
| Sep. 20 | 0.69 | e | 0.79 | bcd | 0.93 | cd | 0.94 | ab | 0.88 | cd | 1.04 | ab | |
| Oct. 20 | 1.12 | ab | 0.99 | a | 0.93 | cd | 0.96 | ab | 1.13 | a | 1.01 | bc | |
| Nov. 20 | 1.00 | abcd | 0.97 | a | 1.01 | bc | 0.98 | a | 1.01 | abc | 0.81 | cd | |
| Dec. 20 | 1.03 | abc | 0.97 | a | 1.05 | ab | 0.80 | bc | 1.12 | ab | 1.01 | bc | |
| Jan. 21 | 0.86 | cde | 0.73 | cd | 0.74 | f | 0.72 | cd | 0.84 | cd | 0.63 | de | |
| Feb. 21 | 0.79 | de | 0.63 | d | 0.79 | fe | 0.61 | d | 0.72 | d | 0.45 | e | |
| Average | 0.98 | A | 0.89 | B | 0.93 | A | 0.89 | B | 0.96 | A | 0.91 | B | |
| SEM | 0.02 | 0.02 | 0.02 | 0.02 | 0.03 | 0.04 | |||||||
Lowercase literals compare means between sampling dates in each intensity by cultivar. Uppercase literals compare means of averages between intensities by cultivar. Different literal indicates significant differences (Tukey; p= 0.05). SEM= standard error of the mean.
Likewise, it has been reported that the intensity of 5 cm in the cultivar Mavuno has negative effects on the total population density, therefore, it is reflected in a lower survival rate and this behavior generates changes in the morphological composition, since, at intensities of 5 cm, it generates stems of greater weight, while, at intensities of 15 cm, the weight per stem decreases, however, in the total weight of dry matter, there are no differences between intensities (Rodrigues et al., 2021). In this sense, Cámara-Acosta et al. (2022) mention that to achieve the persistence of a meadow, a balance between the tillering rate and the survival of the stems is necessary to maintain the density of stems in certain situations.
On the other hand, other dates differ in the behavior of the death rate in each cultivar by cutting intensity, this behavior is attributed to competition for space, to the little or no availability of moisture and stress to exposure to temperatures below 15 °C, determined as the base temperature of tropical grasses (Lucio et al., 2023). In addition, it has been found that, in cuts with fixed intervals, there is a greater pressure on the death rate since the stems weaken more (Cámara-Acosta et al., 2022).
Survival rate and stability index of the stem population
The stability index allows establishing a relationship between survival processes and the tillering rate, since, by itself, it does not allow clarifying whether it is sufficient to replace the death rate and maintain the stem population density (Ramírez et al., 2011). Therefore, the cutting intensity had an effect on the stability of stems (p< 0.05) and the intensity of 15 cm was the one that presented the highest stability index with 9, 4 and 5% compared to the intensity of 25 cm in the three cultivars (Table 3).
However, the hybrid Cayman presented values lower than 0.95; that is, in the evaluation period, a negative stability was obtained in the meadow, so the intensities for this hybrid do not favor the permanence of the meadow; while the hybrids Mulato II and Mavuno remained in equilibrium with values of 0.98 and 0.96. In this regard, Lucio-Ruiz et al. (2021) when evaluating two cutting intensities defined by a fixed intensity of 15 cm and one at 50% considering the height before cutting in the hybrid Cayman, the latter intensity led to greater stability of the stem population, since the intensities were less than 15 cm of residue, therefore, it is established that for this cultivar in the established environment, greater intensity is required to increase the stability index.
In August, the six treatments presented a positive stability of stems, despite being the month where there is little or no precipitation and temperatures are maximum, due to the relationship that exists between the higher rate of tillering compared to the death rate on this date (Table 2). When evaluating Panicum maximum cv. Mombaza, Ramírez et al. (2011) found greater stability during the dry season than in the rainy season, while, when evaluating two cutting heights, Difante et al. (2008) found that at the 15 cm height, stem population remains more stable, with a decrease in variation in stem population density when conditions are limiting for stability.
The stability index showed the contrasts that exist between climatic conditions, given that with water deficit and high temperatures (October), there was less activity in the death rate and an increase in the tillering rate, while, during the month of September, with the ideal conditions to carry out tissue replacement, there was a higher death rate compared to the tillering rate, possibly due to plant growth and competition that exists between available resources such as radiation, soil and water (Rueda et al., 2018).
Conclusions
The cutting intensity of 15 cm allowed maintaining the stability of the population of stems of the Urochloa hybrids Mulato II and Mavuno. The density of stems was different between sampling dates according to the environmental conditions and the density present in the area, since, when favorable conditions of precipitation and temperature are present, the death rate increases, while under restricted conditions there is an increase in the appearance of tillers.
Bibliografía
Cámara-Acosta, J.; Enríquez-Quiroz, J. F.; Rueda-Barrientos. J. A.; Ortega-Jiménez, E.; Ramírez-Bribiesca, J. E. y Guerrero-Rodríguez, J. de D. 2022. Dinámica de tallos del pasto Urochloa híbrido cv. cobra en respuesta al tiempo de corte. Rev. Fitotec. Mex. 45(3):303-311. [ Links ]
Carmona-Muñoz, M. I.; Trejo-López, C.; Ramírez-Vallejo, G.; García-de los Santos, G. y Becerril-Pérez, C. .2003. Resistencia a sequía de Brachiaria spp. I. Aspectos fisiológicos. Rev. Fitotec. Mex. 26(3):153-159. [ Links ]
Cruz-Hernández, A. A.; Hernández-Garay, H.; Vaquera-Huerta, A.; Chay-Canul, J. F.; Enríquez-Quiroz, J. y Ramírez-Vera. S. 2017. Componentes morfogenéticos y acumulación del pasto mulato a diferente frecuencia e intensidad de pastoreo. Rev.Mex. Cienc. Pec. 8(1):101-109. https://doi.org/10.22319/rmcp.v8i1.4310. [ Links ]
Cuartas, C. C. A.; Naranjo, J. F. R.; Tarazona, A. M. M. y Barahona, R. R. 2014. Uso de la energía en bovinos pastoreando sistemas silvopastoriles intensivos con Leucaena leucocephala y su relación con el desempeño animal. Rev. CES Medicina Veterinaria y Zootecnia. 8(1):70-81. [ Links ]
Difante, G. S.; do Nascimento Junior, D.; Silva, S. C. da; Euclides, V. P. B.; Zanine, A. de M. and Adese, B. 2008. Dinâmica do perfilhamento do capim-marandu cultivado em duas alturas e três intervalos de corte. Rev. Bras. Zootec. 37(2):189-196. https://doi.org/10.1590/S1516-35982008000200003. [ Links ]
Elizondo, J. y Boschini, C. 2002. Producción de forraje con maíz criollo y maíz híbrido. Agron. Mesoam. 13(1):13-17. [ Links ]
Garay-Martínez, J. R.; Joaquín-Cancino, S.; Estrada-Drouaillet, B.; Martínez-González, J. C.; Joaquín-Torres, B. M.; Limas-Martínez, A. G. y Hernández-Meléndez, J. 2018. Acumulación de forraje de pasto Buffel e híbridos de Urochloa a diferente edad de rebrote. Ecosis. Rec. Agropec. 5(15):573-581. https://doi.org/10.19136/era.a5n15.1634. [ Links ]
Lucio, R. F.; Joaquín, C. S.; Garay, M. J. R.; Bautista, M. Y.; Estrada, D. B. y Limas, M. A. G. 2023. Dinámica de tallos e índice de estabilidad en cinco cultivares de Urochloa en condiciones semiáridas. Trop. Grassl. -Forrajes Trop. 11(1):1-10. https://doi.org/10.17138/TGFT(11)1-10. [ Links ]
Lucio-Ruiz, F.; Garay-Martínez, J. R.; Bautista-Martínez, Y.; Estrada-Drouaillet, B.; Hernández-Guzmán, F. J; Limas-Martínez, A. G. y Joaquín-Cancino, S. 2021. Estabilidad en la población de tallos en cultivares de Urochloa con diferente intensidad de corte. Ecosis. Rec. Agropec. Número Especial II: e2960. https://doi.org/10.19136/era.a8nII.2960. [ Links ]
Morales, N. C. R.; Melgoza, A. C.; Jurado, P. G.; Martínez, M. S. y Avendaño, C. A. 2012. Caracterización fenotípica y molecular de poblaciones de zacate punta blanca (Digitaria californica (Benth.) Henr.). Rev. Mexic. Cienc. Pec. 3(2):171-184. [ Links ]
Pacheco-Hernández, A.; Garay-Martínez, J. R.; Granados-Rivera, L. D.; Bautista-Martínez, Y.; Joaquin-Torres, B. M..; Limas-Martínez, A. G. y Joaquín, S. C. 2020. Dinámica de ahijamiento de Megathyrsus maximus cv. Tanzania cosechado a diferente edad de rebrote. Ciencia e innovación. 3(1):23-31. [ Links ]
Quero, C. A. R.; Enríquez, J. F. y Miranda, L. 2007. Evaluación de especies forrajeras en América tropical, avances o estatus quo. Interciencia. 32(8):566-571. [ Links ]
Ramírez, R. O.; Silva, S. C. da; Hernández, G. A..; Enríquez, Q. F. J.; Perez, P. J.; Quero, C. A. R. y Herrera, H. J. G. 2011. Rebrote y estabilidad de la población de tallos en el pasto Panicum maximun CV. “Mombaza” cosechado en diferentes intervalos de corte. Rev. Fitotec. Mex. 34(3):213-2020. [ Links ]
Ramírez, R. O.; Flores, I. A.; Hernández, E. C.; Rojas, A. R. G.; Maldonado, M. Á. P. y Valenzuela, J. L. L. 2020. Dinámica poblacional de tallos e índice de estabilidad del pasto llanero. Rev. Mex. Cienc. Agríc. 11(24):23-34. https://doi.org/10.29312/remexca.v0i24.2355. [ Links ]
Rincón, C. A.; Ligarreto, M. G. A. y Garay, E. 2008. Producción de forraje en ellos pastos Brachiaria decumbens cv. Amargo Brachiaria brizantha cv. Toledo, sometidos a tres frecuencias y a dos intensidades de defoliación en condiciones del piedemonte llanero colombiano. Rev. Facultad Nacional de Agronomía Medellín. 61(1):4336-4346. [ Links ]
Rodrigues, L. F.; Vendramini, J. M. B.; Santos, A. C.; Dubeux Jr, J. C. B.; Miotto, F. R. C.; Sousa, L. F. and Alencar, N. M. 2021. Canopy characteristics of Mavuno hybrid brachiariagrass and Marandu palisadegrass harvested at different harvest intensities. Trop. Grassl.-Forrajes Trop. 9(3):249-255. https://doi.org/10.17138/TGFT(9)249-255. [ Links ]
Rojas, G. A. R.; Hernández, G. A.; Quero, C. A. R.; Guerrero, R. J. D.; Zaragoza, R. J. L. y Trejo, L. C. P. 2016. Persistencia de Dactylis glomerata L. solo y asociado con Lolium perenne L. y Trifolium repens L. Rev. Mex. Cienc. Agríc. 7(4):885-895. [ Links ]
Romero-Paredes, J. I. y Ramírez, R. G. L. 2003. Artiplex canesces (Purch, Nutt), como fuente de alimento para las zonas áridas. Ciencia UANL. 6(1):85-92. [ Links ]
Rueda, J. A.; Ortega-Jiménez, E.; Enríquez-Quiroz, J. F.; Palacios-Torres, R. E. and Ramírez-Ordóñes. S. 2018. Tiller population dynamics in eight cultivars of elephant Grass during undisturbed growth. Afr. J. Range Forage Sci. 35(2):1-11. https://doi.org/10.2989/10220119.2018.1477832. [ Links ]
Tarango, A. L. A. 2005. Problemática y alternativas de desarrollo de las zonas áridas y semiáridas de México. Rev. Chapingo Ser. Zonas Áridas. 4(2):17-21. [ Links ]
Vargas, T. V.; Hernández, R. M. E.; Gutiérrez, L. J.; Plácido, D. C. J. y Jiménez, C. A. 2007. Clasificación climática del estado de Tamaulipas, México. Ciencia UAT. 2(2):15-19. [ Links ]
Velázquez, M. M.; Hernández, F. J. G.; Cervantes, J. F. B. y Guillermo, H. G. V. 2015. Establecimiento de pastos nativos e introducidos en zonas semiáridas de México. Instituto Nacional de Investigaciones Forestales Agrícolas (INIFAP)-CIRNE-Campo Experimental San Luis. México. 22 p. [ Links ]
Received: January 01, 2023; Accepted: March 01, 2023
 Este es un artículo publicado en acceso abierto bajo una licencia Creative
Commons
Este es un artículo publicado en acceso abierto bajo una licencia Creative
Commons
