


Services on Demand
Journal
Article
 text in
  English (pdf)
 Article in xml format
 Article references
 Send this article by e-mail
Indicators
-
 Cited by SciELO
 -
 Access statistics
Related links
-
 Similars in
SciELO
Similars in
SciELO
Share

 Permalink
Revista mexicana de ciencias agrícolas
Print version ISSN 2007-0934
Rev. Mex. Cienc. Agríc vol.14 n.2 Texcoco Feb./Mar. 2023 Epub June 19, 2023
https://doi.org/10.29312/remexca.v14i2.3138
Articles
Phenotypic plasticity of beans under four nitrogen levels in Tehuacán
1Ecofisiología aplicada a cultivos en zonas áridas.
2Ingeniería en Agricultura Sustentable y Protegida-Universidad Tecnológica de Tehuacán. Prolongación de la 1 sur núm. 1101, San Pablo Tepetzingo, Tehuacán, Puebla. CP. 79859.
Phenotypic plasticity is a property of bean crops in response to environmental stimuli, including nitrogen fertilization. This plant is endemic to Mexico and there are multiple genetic variants, which adapt to the different climates and microclimates of the country. Regarding the Valley of Tehuacán, Puebla, it is considered the center of origin of agriculture in Mesoamerica, because the oldest remains of corn and beans are dated there. Thus, the objective was: to evaluate the phenotypic plasticity of a bean from the Central Valleys of Oaxaca when sown in the Valley of Tehuacán, Puebla. The research was conducted under field conditions in Tehuacán, Puebla. The germplasm was the cultivar Rocha, which corresponds to a bean with black seeds and indeterminate growth. The treatments consisted of four levels of nitrogen 0; 50; 100 and 150 kg ha-1 and four repetitions, which were evaluated under a randomized complete block design. The response variables were: SPAD units, seed yield, total dry biomass, harvest index, heat units, evapotranspiration and incidence of bean bacterial blight. The results indicate that the highest agronomic yield was in treatments T2 and T1 with 8.74 and 7.09 g plant-1, while the highest biological yield was 22.15 g plant-1, for the treatment T2. The thermal integral was 1 322 HU, while the total evapotranspiration was 217.94 mm. Thus, the highest incidence of blight occurred in the control with 1.23%. It is concluded that the cv. Rocha can be a production alternative in the Valley of Tehuacán.
Keywords: biomass; bean bacterial blight; heat units; yield
La plasticidad fenotípica es una propiedad que tiene el cultivo de frijol, como respuesta a estímulos ambientales incluida la fertilización nitrogenada. Esta planta es endémica de México y existen múltiples variantes genéticas, las cuales se adaptan a los diferentes climas y microclimas del país. Respecto al Valle de Tehuacán, Puebla, es considerado el centro de origen de la agricultura en Mesoamérica, porque en él se datan los restos más antiguos de maíz y frijol. Así el objetivo fue: evaluar la plasticidad fenotípica de un frijol de los Valles Centrales de Oaxaca, cuando es sembrado en el Valle de Tehuacán Puebla. La investigación se llevó a cabo bajo condiciones de campo en Tehuacán, Puebla. El germoplasma fue el cultivar. Rocha, que corresponde a un frijol de semilla negra y crecimiento indeterminado. Los tratamientos consistieron en cuatro niveles de nitrógeno 0; 50; 100 y 150 kg ha-1 y cuatro repeticiones, que se evaluaron bajo un diseño de bloques completos al azar. Las variables de respuesta fueron: unidades SPAD, rendimiento de semilla, biomasa seca total, índice de cosecha, unidades calor, evapotranspiración e incidencia de la bacteriosis del frijol. Los resultados indican que el mayor rendimiento agronómico fue en los tratamientos T2 y T1 con: 8.74 y 7.09 g planta-1, mientras que el rendimiento biológico mayor fue 22.15 g planta-1, para el tratamiento T2. La integral térmica fue 1 322 UC, mientras que la evapotranspiración total fue 217.94 mm. Así la mayor incidencia del tizón ocurrió en el testigo con 1.23%. Se concluye, que el cv. Rocha puede ser una alternativa de producción en el Valle de Tehuacán.
Palabras clave: biomasa; rendimiento; tizón bacteriano del frijol; unidades calor
Introduction
Phenotypic plasticity, or simply plasticity, is defined as the ability of a certain genotype to induce variations in response to environmental changes, through physiological processes and morphological variants (Kohashi, 1996). In turn, these changes are a consequence of the interaction between the genotype and the environment, as defined by Márquez (1990) in his equation F= F + G + (GA) cited by Díaz et al. (2010a). In this regard, the interaction of the temperature, precipitation, solar radiation, soil type and agronomic practices, e.g., reduction in the distance between furrows or double-row furrows, has a direct influence on the yield components of crops such as beans (Escalante et al., 2015).
Regarding beans (Phaseolus vulgaris L.), it is a species that belongs to the Fabaceae family and is considered a staple crop in the diet of Latin American peoples because it provides proteins and glycoproteins directly to the diet, being classified even with medicinal properties (Bennink, 2005). In Mexico this crop is planted in tropical, temperate and dry climates, including the Central Valleys of Oaxaca, where it is used for the preparation of multiple dishes typical of the region (Pliego et al., 2013).
Due to its growth habit, it has been classified into two types: determined and indeterminate (Escalante and Kohashi, 1993). These germplasms have adaptability to the areas where they were sown for many years, obtaining good grain yields, due to their particular adaptability and phenotypic plasticity. When these materials are introduced in other geographical areas such as the Valley of Tehuacán, they tend to behave differently, due to the heterogeneous environmental supply of the area, such as the new ecological conditions, climate and soil, which influence the agronomic yield, so the response shown by the crop to adapt to its new environment must be identified (Araméndiz et al., 2017).
Therefore, it is important to assess the plasticity of the germplasm introduced in a new area, which will allow determining the agronomic management of the material in the area of establishment. Thus, the objective of the present study was to evaluate the phenotypic plasticity of a bean cultivar from the central valleys of Oaxaca, in the Valley of Tehuacán through a growth analysis.
Materials and method
Experiment location
The present study was carried out under field conditions, in the experimental facilities of the Technological University of Tehuacán, located at 18° 24’ 51” north latitude, 97° 20’ 00” west longitude and 1 409 m altitude.
Type of soil
The type of soil corresponds to an epileptic lithosol, Caballero, 1990, with bulk density 1.4 g cm-2 and clayey-loam texture (Bouyoucos hydrometer method). pH 7.3 with an electrical conductivity of 2.2 dS m-1 (potentiometric method), organic matter content of 1.2% (hydrogen peroxide) and initial nitrogen of 3.2 mg kg-1 (Kjeldahl method). (NOM-021-RECNAT-2000).
Climate
The climate belongs to the family Bs1 (w’) e’g, which corresponds to a dry climate with average annual temperature greater than 18 °C, but less than 27 °C. The annual rainfall is greater than 400 mm, but less than 600 mm, with the presence of midsummer drought (dog days), the temperature oscillation between the warmest and coldest month is greater than 7 °C and less than 14 °C, the warmest month occurs before the summer solstice, this being April (García, 2005).
Germplasm
The genetic material is from an accession from the central valleys of Oaxaca, collected in Cuilapan de Guerrero, Oaxaca at the geographical coordinates 16° 59’ 16” north latitude, 96° 47’ 50” west longitude and 1 600 masl and corresponds to a genotype of free pollination, of semiprostrate indeterminate growth habit, with black testa and violet corolla (Genchev and KiryaKov, 2005).
Sowing, topological arrangement and crop management
The sowing was carried out manually, in furrows 0.8 m apart and separation between seeds of 0.1 m, being a total area of 400 m2 with a total of 25 furrows, with a topological arrangement (0.2 m x 0.8 m) that resulted in a population density of 6.25 plants m-2. The cultivation cycle was 120 days, from sowing to physiological maturity. Weed control was manually, every 15 days after shooting. For the control of whitefly, commercial insecticide was applied, with the active ingredient imidacloprid, at a rate of 60 cc 100 L-1 of water, applied during the vegetative stages Vn.
Experimental design, treatments and experimental unit
The design used was randomized complete blocks, where the treatments were four levels of nitrogen: 0, 50, 100 and 150 kg ha-1, ammonium sulfate (21% of N) was used as a source, which was applied 20 days after sowing. The experiment had four repetitions and (4x4)= 16 experimental units. The experimental unit consisted of five furrows six m long, where the central furrow was considered as the useful plot.
The treatments were evaluated under a randomized complete block design, using the mathematical model Yij = µ + Ƭi + βj + εij. Where: Yij= is the response variable of the i-th nitrogen level in the j-th block; μ= is the true overall mean; Ƭi= is the effect of the i-th nitrogen level; βj= is the effect of the j-th block; and εij= is the experimental error of the i-th nitrogen level in the j-th block (Steel and Torrie, 1998; Cochran and Cox, 2005).
Response variables
Five destructive samplings were carried out at intervals of 15 days, to evaluate: SPAD units, measured with the help of a previously calibrated Minolta SPAD-502 chlorophyll meter and directly measuring five readings in different nomophylls of the plant to obtain the respective average, it is important to note that this method is not destructive. Seed yield, when it reached physiological maturity and a moisture percentage of 13%, the total seeds, separated from the valves of the pod, were weighed, expressing the result in g plant-1.
Total dry biomass and its distribution, subjecting the following structures to drying until constant weight: stems, nomophylls, valves and seed. Harvest index, using the equation HI =
Evapotranspiration, by the ratio ETc= (Ev) (Ke) (Kc). Where: ETc= evapotranspiration in mm; Ev= evaporation of the tank type ‘A’; Ke= coefficient of the tank evaporimeter (0.6); and Kc= crop coefficient (0.8) (Doorenbos and Pruitt, 1986). To have a better control of the experiment, the following meteorological variables were measured: maximum and minimum temperatures, as well as the total precipitation during the ontogenic cycle of the crop, with the help of an automated meteorological station model Vantage Pro-2.
Because the germplasm is adapted to the conditions of the central valleys of Oaxaca, under the ecological conditions of the Valley of Tehuacán, the percentage of incidence of the bean bacterial blight [(Xantomonas axonopodis pv. phaseoli (Xap) (Smith)] was evaluated, performing four samplings during the ontogenic cycle of the crop at 15, 30, 45 and 60 days after sowing.
Incidence calculations were made using the equation I=
Results and discussion
Ombrothermal diagram
The ombrothermal diagram is presented in Figure 1. It shows that the maximum temperature ranged between 34.5 and 30.2 °C, with the maximum occurring during the second ten-day period of August. On the other hand, the minimum temperature varied within a range of 17.9 and 16 °C. This oscillation between the maximum and minimum agrees with the nomenclature of the climatic family of the area, which indicates that the oscillation is greater than 7 °C and less than 14 °C. Regarding precipitation, the total sum during the cultivation cycle was 170.4 mm, which is why two supplemental irrigations had to be applied, during anthesis and grain filling in the second ten-day period of the months of July and August, thus coinciding with the midsummer drought.
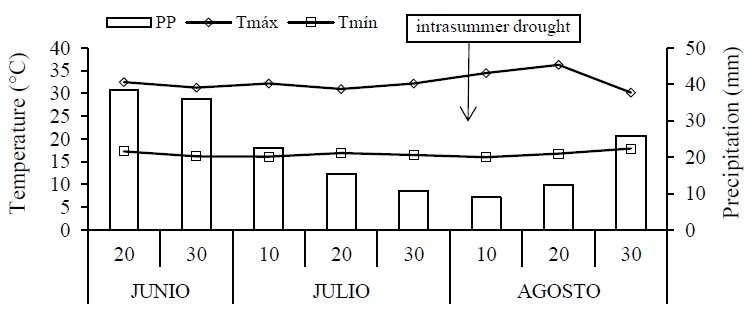
Figure 1 Ombrothermal diagram for the ontogenic cycle of black beans (Phaseolus vulgaris L.) cv. Rocha. Technological University of Tehuacán, spring-summer 2020 cycle. Tmáx and Tmín= maximum and minimum temperatures; and PP= precipitation.
In this way, 56.9% of the precipitation coincided with the vegetative period of the crop and the rest in the reproductive stage 43.1%. Under these conditions, the crop reached physiological maturity for green pods and grain without problems, with the fact that the ecological conditions of the Valley of Tehuacán are contrasting and differ from that of the Central Valleys of Oaxaca.
Agronomic, biological yield and harvest index
The analysis of variance for the variables agronomic yield, biological yield and harvest index is presented in Table 1. It shows that the agronomic and biological yield was highly significant, while the harvest index was not significant despite the existence of numerical differences. Regarding the coefficient of variability, it ranged between 5.09 and 12.8% for biological and agronomic yields, which indicates the reliability of the data, while for the harvest index, this was 16.74%.
Table 1 Analysis of variance and multiple comparison test for black beans (Phaseolus vulgaris L.) cv. Rocha under four levels of nitrogen.
| Treatment (kg ha-1 N) | AY | BY | HI |
| (g plant-1) | |||
| T0 | 4.68 b | 15.32 c | 0.3 a |
| T1 | 6.97 ab | 17.91 b | 0.38 a |
| T2 | 8.74 a | 22.15 a | 0.36 a |
| T3 | 7.09 a | 19.88 b | 0.35 a |
| HSD | 1.94** | 2.11** | 0.12 ns |
| CV (%) | 12.8 | 5.09 | 16.74 |
Means within columns with the same literal are statistically equal according to Tukey at p≤ 0.05 error. AY= agronomic yield; BY= biological yield; HI= harvest index; T0; T1; T2; T3, treatments; HSD= honest significant difference; CV= coefficient of variability; **, *, ns= significant at 0.01, 0.05 and not significant. Technological University of Tehuacán. Spring-summer 2020 cycle.
Regarding the multiple comparison for the parameters: agronomic and biological yield, it is observed that the highest seed yield was in the high levels of nitrogen T2 and T3, with 8.74 and 7.09 g plant-1, also resulting statistically equal, while for the biological yield, the highest value was in T2 with 22.15 g plant-1. On the contrary, the lowest agronomic and biological yields were for the control T0 and T1, resulting equal from the statistical point of view, with 4.68 and 6.97 g plant-1. The biological yield presented the lowest values in the control with 15.32 g plant-1.
What is reported in this study differs from what was reported by Apáez et al. (2011), who mention that the seed yield of cowpea beans sown under the trellis system in warm climate was 5.48 g plant-1, 37.3% less than what was obtained in this research, facts that are attributed to the different genotypes used, despite to the fact that both are materials of indeterminate growth.
For their part, Maqueira et al. (2017), when working with a black bean cultivar different from cv. Rocha in the locality of Los Palacios, Cuba, report an agronomic yield of 5.55 g plant-1, a yield 36.5% lower than the cultivar Rocha. These results demonstrate the broad phenotypic plasticity of the genetic material of the present research to adapt to the conditions of the Valley of Tehuacán, as it produces high seed yields.
SPAD Units
The dynamics of the SPAD units for bean nomophylls are presented in Figure 2. It shows that these presented an ascending behavior from 15 to 60 days after sowing, the latter date being where the maximum expression of the SPAD units was reached, 60, 56, 45 and 37 for 150, 100, 50 and 0 kg of N, respectively, these fitting a quadratic model, which coincides with what was reported by Ribeiro et al. (2015), who, when working with Lisianthus, under different doses of nitrogen, found that the behavior of SPAD units was polynomial of second degree despite being different species.

Figure 2 Dynamics of SPAD units in black beans (Phaseolus vulgaris L.), under four nitrogen levels at 15, 30, 45, 60 and 75 days after sowing. Technological University of Tehuacán, 2021.
The inflection point occurred on this last date, which marked the beginning of the decline in SPAD units. This behavior is attributed to the fact that, in species such as beans, the senescence of nomophylls is a typical phenomenon, where the leaf blade falls due to the synthesis of abscisic acid, in addition to losing chlorophyll, which induces the decrease in SPAD units, caused by the null synthesis of chlorophyll (Zavala et al., 2011).
Distribution of aerial biomass
The distribution of aerial biomass for seed, stems and valves is presented in Figure 3. It can be seen that the highest percentage of biomass was allocated to the stems of the plant for the four treatments, with values ranging between 68.4 and 73.55%. Of these, the control was the one that accumulated the largest amount of biomass in the stem, while the application of 50 kg ha-1 of nitrogen (T2) was the one that accumulated the lowest amount of biomass 68.4%. The percentage of accumulation of dry matter for seeds showed that the treatments T1 and T2 assimilated 28 and 28.2% respectively and the control treatment only managed to capture 23.4%.

Figure 3 Distribution of biomass in the aerial part in black beans (P. vulgaris L.) cv. Rocha under four levels of nitrogen. Technological University of Tehuacán. Spring-summer 2020 cycle.
The structure that accumulated the least biomass were the valves, whose values moved in a range of 1.42 and 3.67%, with T2 being the one that had less biomass in these structures. On the other hand, Romero et al. (2021) reported values of 22% and 19% of biomass in anthesis and biomass at flowering respectively, in beans with type I growth and with 80 nitrogen units per hectare. As can be seen, this genetic material is a germplasm that manages to allocate almost a third of the biomass produced in photosynthesis, as demonstrated in the graph and in the harvest index.
Heat units
The heat units of the cultivation cycle from sowing to harvest are presented in Figure 4. It can be seen that the heat units fitted an increasing linear model, with a total accumulation of 1 322, of which 608.21 °C day-1 corresponded to the vegetative phase Vn, flowering (F) 74.41, pod production (PP) 297.83 and grain production (GP) 341.54 °C day-1, respectively. In relation to the mathematical model, the slope of the curve of degree one 14.89 HU das-1 indicated that for each day after sowing (das) that passes, the bean cultivar Rocha accumulates 14.89 °C.
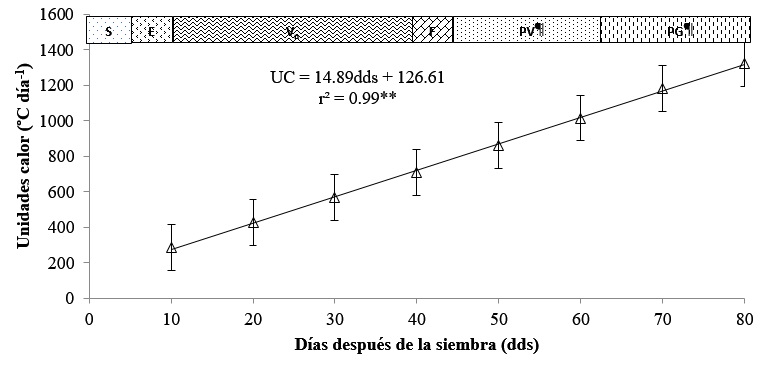
Figure 4 Heat units accumulated during the ontogenic cycle of black beans (Phaseolus vulgaris L.) cv. Rocha. Technological University of Tehuacán. Spring-summer 2020 cycle. UC= heat units; DDS= days after sowing; **, *, ns, significant at 0.01, 0.05 and not significant; S= sowing; E= emergence; Vn= vegetative phase; F= flowering; PV= pod production; and PG= grain production.
Regarding the coefficient of determination, this was highly significant r2= 0.99**, demonstrating that 99% of the heat units (HU) are due to the passage of days after sowing. This behavior in the accumulation of heat by the plant has been demonstrated by Escalante et al. (2001), who report a thermal integral of 1 440 HU during a summer cycle like the one studied here and they also report that the difference in the accumulation of heat units depends on the type of genotype, climate and date of sowing.
Evaporation
Evaporation for the summer-autumn cultivation cycle of the cv. Rocha is presented in Figure 5. It shows that it fitted a quadratic model which was significant. Thus, the highest evaporation values occurred 70 days after sowing (das). This dynamic coincided with the maximum temperature values during the cultivation cycle, which were the result of the midsummer drought, which occurred at 60 das, as shown in Figure 4.

Figure 5 Evaporation during the ontogenic cycle of black beans (Phaseolus vulgaris L.) cv. Rocha. Technological University of Tehuacán. Spring-summer 2020 cycle. Ev= evaporation; das= days after sowing; **; *; ns= highly significant, significant and not significant.
On the contrary, the minimum values occurred in the early stages of the crop (vegetative phase) and were the result of the cloudiness present in that phase, which caused solar radiation to avoid high evaporation values, since this process depends largely on the radiant energy of the sun, for the water to change its aggregation state from liquid to gas (FAO, 1990).
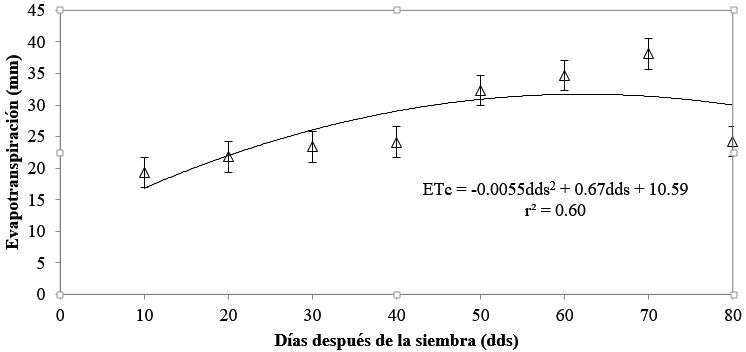
Evapotranspiration
Evapotranspiration was a reflection of evaporation and per se, the model fit was also quadratic. In this way, the behavior of this ecophysiological variable was increasing from 10 to 50 das, this last date being the inflection point to deacrese to 80 das. The sum of the total evapotranspiration of the cultivation cycle was 217.94 mm from emergence to the senescence of nomophylls.
Authors such as Morales et al. (2017) mention that evapotranspiration in bean crops (Phaseolus vulgaris L.) is 327 mm under tropical climate and with the application of chitosan, which is an aminopolysaccharide derived from chitin, which is used in crops to reduce evapotranspiration, which differs from the data of this study. González et al. (2017) report an ETc in the bean crop of 251.77 mm, 13.44% more evapotranspired water than in the present study. This increase in evapotranspiration in both studies is attributed to the different climates and soil types in which both studies were developed (Figure 6).
Percentage of incidence of bean bacterial blight
Figure 7 presents the analysis of variance, as well as the multiple comparison test, for percentage of incidence of bean bacterial blight (Xanthomonas axonopodis pv. phaseoli Smith). It shows that there were highly significant differences at 30, 45 and 60 das. The mean comparison test showed that the control treatment was the one that had the highest incidence with: 1.23, 1.63 and 2.06%, 45 days after sowing. Treatments T2 and T3 had the lowest levels of incidence of the disease.

Figure 7 Incidence of bean bacterial blight (Xanthomonas axonopodis pv. phaseoli Smith) at 15, 30, 45 and 60 days after sowing (dds). T0, T1, T2 and T3= treatments; **, *, ns= significant at 0.01; 0.05 and not significant. Technological University of Tehuacán, 2020.
These results show that the cv. Rocha is a genotype that, despite presenting the disease, the incidence of this does not exceed 2.5%, this being a genetic material that can be recommended for the area, as it resists the incidence of bean bacterial blight. The data presented in this study differ from those reported by Rodríguez et al. (2015), who report an incidence of bean bacterial blight that ranges from 4 to 8%, despite both being genotypes with black seed, this difference is attributed to the experiment carried out in ecological conditions of Cuba, where the relative humidity did not decrease from 80%, an environmental factor that significantly influenced the incidence of the disease.
Conclusions
The maximum agronomic and biological yield was achieved with the application of 100 kg ha-1 of nitrogen. Regarding the distribution of biomass, the greater allocation of this went to the stem of the plant, than in the rest of the organs of the plant. Physiological maturity for grain was achieved with a thermal integral of 1 322 HU. Regarding the total evapotranspired water, the cultivation cycle was completed with an irrigation sheet of 217.94 mm. The nitrogen fertilizer that is recommended for the soil conditions of the Valley of Tehuacán is ammonium sulfate, for its contribution of sulfur that helps to modify the reaction of the soil.
The bean cultivar Rocha from the Central Valleys of Oaxaca proved to have a wide phenotypic plasticity to adapt to the conditions of the Valley of Tehuacán, Puebla. Despite the occurrence of bean bacterial blight, it was not decisive in affecting the crop. The black bean cultivar Rocha can be an alternative crop for bean producers from the Valley of Tehuacán, Puebla.
Literatura citada
Apáez, B. P.; Escalante, E. J. A. S. y Rodríguez, G, M. T. 2011. Crecimiento y rendimiento de frijol chino en función del tipo de espaldera y clima. Tropical and subtropical Agroecosystems. 13(3):307-315. [ Links ]
Aramaméndiz, T. H.; Espítia, C. M. y Cardona, A. C. 2017. Adaptabilidad y estabilidad fenotípica en cultivares de frijol caupí en el caribe húmedo colombiano. Biotecnología en el sector agropecuario y agroindustrial. 15(2):14-22. Doi://dx.doi.org/10.18684/bsaa(v15) EdiciónEspecialn2.574. [ Links ]
Bennink, M. 2005. Eat beans for good health. Ann. Rep. Bean Improv. Coop. 48:1-5. [ Links ]
Caballero, M. C. 1990. Calve de clasificación de suelos FAO-UNESCO. UNAM. 1-3 pp. http://usuarios.geofisica.unam.mx/cecilia/cursos/GuiaNotasEdaf-Clave.pdf. [ Links ]
Cochran, G. C. y Cox, M. G. 2005. Diseños experimentales. Ed. Trillas. 4ta . Edición. México. 661 p. [ Links ]
Díaz, L. E.; Escalante, E. J. A.; Rodríguez, G. M. T. y Gaytán, A. A. 2010a. Producción de frijol ejotero en función del tipo de espaldera. Rev. Chapingo Serie Horticultura. 16(3):215-221. [ Links ]
Díaz, L. E.; Morales, R. E. J.; Franco, M. O. y Domínguez, L. A. 2010b. Atenuación de luz, radiación interceptada y rendimiento de maíz en función del fósforo. Terra latinoamericana. 29(1):65-72. [ Links ]
Doorenbos, J.; Pruitt, W. O. 1986. Las necesidades de agua por los cultivos. Riego y drenaje. Manual 24. Food and agricultural organization. Rome, Italy. 20-28 pp. [ Links ]
Escalante, E. J. A.; Rodríguez, G. M. T. y Escalante, E. Y. 2015. Nitrógeno, distancia entre surcos, rendimiento y productividad del agua en dos cultivares de frijol. Bioagro. 27(2):75-82. [ Links ]
Escalante, E. J. A. S.; Escalante, E. L. E. y Rodríguez, G. M. T. 2001. Producción de frijol en dos épocas de siembra: su relación con la evapotranspiración, unidades calor y radiación solar en clima cálido. Terra Latinoamericana. 19(4):309-315. [ Links ]
Escalante, E. J. A y Kohashi, S. J. 1993. El rendimiento y crecimiento del frijol. Manual para la toma de datos. Colegio de Postgraduados, Montecillo. 84 p. [ Links ]
FAO. 1990. Food and Agriculture Organization. Evapotranspiración del cultivo: guías para la determinación de los requerimientos de agua de los cultivos. Estudio FAO riego y drenaje. 56-322 pp. [ Links ]
García, A. E. 2005. Modificaciones al sistema de clasificación climática de Köppen. Para adaptarlo a las condiciones de la república mexicana. 5ta . Ed. Instituto de geografía. UNAM. 90 p. [ Links ]
Genchev, D. and KiryaKov, I. 2005. Color scales, for identificatión characters of common bean (Phaseolus vulgaris L) dobroudja agricultural institute, toshevo. 31 p. [ Links ]
González, C. O.; Abreu, C. B.; Herrera, S. M. y López, B. E. 2017. Uso del agua durante el riego del frijol en suelos Eutric cambisol. Rev. Cienc. Técn. Agropec. 26(1):70-77. http://scielo.sld.cu/pdf/rcta/v26n1/rcta09117.pdf [ Links ]
Kohashi, S. J. 1996. Aspectos de la morfología y fisiología del frijol (Phaseolus vulgaris L.) y su relación con el rendimiento. Colegio de Postgraduados. Instituto de Recursos Naturales. 2da . Ed. 44 p. [ Links ]
Maqueira, L. L. A.; Rojan, H. O.; Pérez, M. S. A. y Torres, N. W. 2017. Crecimiento y rendimiento de cultivares de frijol negro (Phaseolus vulgaris L.) en la localidad de los palacios. Cultivos Tropicales. 38(3):58-63. [ Links ]
Márquez, S. F. 1990. Genotécnia vegetal. Tomo I. Métodos, teoría y resultados. AGT. México, D. F. 1550 p. [ Links ]
Morales, G. D.; Dell’amico, R. J.; Jeréz, M. E.; Rodríguez, H. P.; Álvarez, B. I.; Díaz, H. Y.; Roberqui, M. M. 2017. Efecto del quitomax en plantas de (Phaseolus vulgaris L.) sometidas a dos regímenes de riego. II. Variables fisiológicas. Cultivos Tropicales. 92-101 pp. https://www.redalyc.org/pdf/1932/193254602011.pdf. [ Links ]
NOM-021-RECNAT. 2000. Norma oficial mexicana. Que establece las especificaciones de fertilidad. Salinidad y clasificación de suelos, muestreos y análisis. 73 p. [ Links ]
Pliego, M. L.; López, B,J. y Aragón, R. E. 2013. Características físicas, nutricionales y capacidad germinativa de frijol criollo bajo estrés hídrico. Rev. Mex. Cienc. Agríc. 6(esp.):1197-1209. https://www.redalyc.org/pdf/2631/263128353011.pdf. [ Links ]
Ribeiro, D. A.; Katz, I.; Padua, S. A. y Martínez, U. R. A. 2015. Índice SPAD en el crecimiento y desarrollo de plántulas de lisianthus en función de diferentes dosis de nitrógeno en ambiente protegido. IDESIA. 33(2):97-105. [ Links ]
Rodríguez, M. O.; Fauré, A. B.; Ortíz, P. R.; Miranda, L. S. y Lamz, P. A. 2015. Respuesta a bacteriosis común (Xanthomonas axonopodis p.v phaseoli) En los cultivares comerciales de frijol común de cuba, en condiciones de campo. Afectación de los rendimientos por efecto de la inoculación. Cultivos tropicales. 36(2):92-99. [ Links ]
Romero, F. C. S.; López, C. C.; Kohashi, S. J.; Martínez. R. C. G.; Miranda, C. S. y Aguilar, R. V. H. 2021. Rendimiento y biomasa acumulada en frijol común bajo riego y secano. Rev. Mexic. Cienc. Agríc. 12(8):1363-1376. [ Links ]
Steel, G. D. R. y Torrie, H. J. 1998. Bioestadística: principios y procedimientos. Mc Graw Hill. 2da . Ed. México, DF. 622 p. [ Links ]
Zavala, E. F.; Maldonado, T. R.; Sandoval, V. M.; Álvarez, S. M. E.; Colinas, L. M. T. y Ramírez, V. P. 2011. Cambios morfológicos y fisiológicos en hojas de frijol tolerante y susceptible a deficiencias de hierro. Terra latinoamerica. 29(3):267-276. [ Links ]
Received: January 01, 2023; Accepted: March 01, 2023
 Este es un artículo publicado en acceso abierto bajo una licencia Creative Commons
