


Services on Demand
Journal
Article
 text in
  English (pdf)
 Article in xml format
 Article references
 Send this article by e-mail
Indicators
-
 Cited by SciELO
 -
 Access statistics
Related links
-
 Similars in
SciELO
Similars in
SciELO
Share

 Permalink
Revista mexicana de ciencias agrícolas
Print version ISSN 2007-0934
Rev. Mex. Cienc. Agríc vol.13 n.6 Texcoco Aug./Sep. 2022 Epub Feb 24, 2023
https://doi.org/10.29312/remexca.v13i6.3313
Investigation notes
Price hedging for coffee, using the futures market
1Posgrado en Economía Agrícola-Universidad Autónoma Chapingo. Carretera Federal México-Texcoco km 38.5, Chapingo, Texcoco, Estado de México, México. CP. 56230. (oscar.galvan3991@gmail.com; perezsotofco@gmail.com).
2Campo Experimental Valle de México-INIFAP. Carretera Los Reyes-Texcoco, km 13.5, Coatlinchán, Texcoco, Estado de México, México. CP. 56250. (sangerman.dora@inifap.com.mx).
3Posgrado en Economía-Colegio de Postgraduados. Carretera México-Texcoco km 36.5, Montecillo, Texcoco, Estado de México, México. CP. 56230. (rcgarcia@colpos.mx).
The present work completed in January 2021 determined a price hedging model in the coffee futures markets. Following the analytical method, first, the behavior of the historical prices from January 2015 to December 2020 in the spot market and in the futures market was observed and analyzed, later using the standard deviation of the historical data, the volatility that exists in the futures market and its impact on the final price that producers receive for their harvest at the end of each production cycle was calculated. Applying the statistical theory of the binomial tree, the expected prices of the following three four-month periods are estimated, subsequently, the utility function of the producer is modeled, assuming it as the expectation of income and its variance, later the utility function of the producer is found and optimized to know the number of contracts that guarantees the hedging of the price of production. The results of this work suggest that the final income of the producer will depend directly on the production that is expected to have in each productive cycle, on the speculative game on the stock exchange (number of contracts) and on the forecast of the spot price at the time of the evaluation, finally, it is concluded that the producers could be motivated to use futures contracts as a hedging strategy, since even if the profits are not extraordinary, the income will always be higher when such hedging is used.
Keywords: futures market; hedging; risk; utility; volatility
El presente trabajo terminado en enero de 2021 determinó un modelo de cobertura de precios en los mercados de futuros de café. Siguiendo el método analítico, primeramente, se observó y analizo el comportamiento de los precios históricos comprendidos de enero de 2015 a diciembre de 2020 en el mercado spot y en el mercado de futuros, posteriormente utilizando la desviación estándar de los datos históricos, se calculó la volatilidad que hay en el mercado de futuros y el impacto de este en el precio final que reciben los productores por su cosecha al finalizar cada ciclo productivo. Aplicando la teoría estadística del árbol binomial se estiman los precios esperados de los siguientes tres cuatrimestres, posteriormente, se modela la función de utilidad del productor asumiéndola como la esperanza del ingreso y la varianza de este, posteriormente se halla y optimiza la función de utilidad del productor para conocer el número de contratos que garantiza la cobertura del precio de la producción. Los resultados de este trabajo sugieren que el ingreso final del productor dependerá directamente de la producción que se espera tener en cada ciclo productivo, del juego especulativo en bolsa (número de contratos) y del pronóstico del precio spot al momento de la evaluación, finalmente se concluye que los productores podrían estar motivados a la utilización de contratos de futuros como una estrategia de cobertura, ya que aunque las ganancias no sean extraordinarias, el ingreso siempre será mayor cuando se utiliza dicha cobertura.
Palabras clave: cobertura; mercado de futuros; riesgo; utilidad; volatilidad
The richness of Mexico’s soil and its privileged geographical location are conditions that make it the tenth coffee producer worldwide, with about 540 000 coffee growers in the more than 700 000 hectares (CEDRSSA, 2018), in the states of Chiapas, Veracruz, Oaxaca, Puebla, San Luis Potosí, Guerrero, Tabasco, among others. These states produce two large varieties: Arabica and Robusta. The Arabica variety is the most planted worldwide and in Mexico it represents 94% of the total production.
In this agricultural activity, there is a high possibility of obtaining losses, due to the different risks (production and market) faced by producers. Price and production are the most important variables for the producer since their income depends on it. Since ancient times, Japan 1600, farmers have sought to reduce that risk and, in that sense, the futures market becomes increasingly relevant among professionals in finance and producers of raw materials, and with this, an interest in study by renowned economists since the 70s. In this period some very relevant works in the area of finance were published. For example, the works of Fisher and Myron (1973); Merton (1973) and since then, options to hedge or transfer this, such as futures contracts or options, have emerged (FIRA, 2011).
The use of contracts in the futures market is done with the intention of counteracting possible losses in the spot market (immediate transfer of the physical product) and in some cases, generating profits with price speculation. The main idea of this work is to determine a model of price hedging in the coffee futures markets, to use it as a tool in the face of fluctuations in price changes worldwide, derived from the different factors that motivate it.
Coffee futures take place in an organized virtual market, called the grain exchange, where different types of coffee (variety and quality) are listed. In this work we will focus on the Arabica variety, which, as already mentioned above, is the most cultivated in the country. This variety is listed on the New York Stock Exchange through the standardized ‘C’ contract. A contract C is a fixed trading volume of washed soft coffee that meets certain standards of quality (moisture not less than 8% and not exceeding 12%, ISO 6673.3.3) and quantity (37 500 pounds, approximately 250 bags of 69 kg) (Solares, 2011). The price is agreed today against the future delivery of the physical product, thus canceling the contract.
Exploring hedging theories, they all seek profit maximization while also wanting to reduce risk. This approach to hedging was born from the work of Working (1953). Over the years, hedging theories have been studied in depth and new theories have been proposed; for example, Gutiérrez (2018) refers to the prediction of the optimal cross-hedging ratios in the Mexican oil market. Based on Bekk’s works, he evaluates the performance of four bivariate Garch models and the ordinary least squares method to predict the cross-hedging ratios of minimum variance of Mexican oil in the period from 2000 to 2015. For this case study, a simple hedging strategy traditionally known as ‘naive’ is used.
The review of the historical data during five years of the prices of coffee futures, in the New York Stock Exchange, reference of the price of coffee in Mexico in investing.com (2020), the volatility of this commodity is calculated to highlight the ‘financial’ risk that this crops entails, the importance of analyzing volatility is clearly shown in the work of Doporto and Michelena (2011), who tell us about the volatility of commodity prices in 2010 and its multiple effects, the main one, economic risk, risk to which coffee growers in Mexico are exposed.
Historical coffee price data are grouped by four-month periods; usually it is three times a year in which small producers take their crops to the market. With the volatility calculated and with the help of a binomial tree, the future price, both upward and downward, of the following 3 four-month periods is estimated, then the utility function of the producer is proposed, in order to determine the number of optimal contracts in the futures market that maximizes the profit of the producer.
Table 1 shows the average annual price of coffee futures on the New York Stock Exchange (simple average, obtained from the daily closing of coffee futures prices). As well as the prices paid to coffee growers (www.ico.org, 2016).
Table 1 Volatility and average prices in the futures and spot markets.
| Year | Period | Average price, futures market | Volatility (%) | Price paid to coffee growers |
| 2015 | 1 | 1.297167 | 15.09067 | 1.0892 |
| 2 | 10.41241 | |||
| 3 | 5.734139 | |||
| 2016 | 1 | 1.36275 | 7.762556 | 1.1441 |
| 2 | 8.407628 | |||
| 3 | 9.0527 | |||
| 2017 | 1 | 1.322542 | 8.970063 | 1.0735 |
| 2 | 7.323548 | |||
| 3 | 5.677033 | |||
| 2018 | 1 | 1.079313 | 3.646334 | 0.92225 |
| 2 | 5.504481 | |||
| 3 | 7.362629 | |||
| 2019 | 1 | 1.037417 | 5.411277 | 0.843 |
| 2 | 8.692736 | |||
| 3 | 11.97419 | |||
| 2020 | 1 | 1.086 | 7.730763 | 0.91224 |
The volatility calculated above allows us to know if the price of coffee is facing sudden market movements, movements in the price that can be harmful to producers. For this case study, a total of 1 365 data on the daily closing of the price of coffee futures were taken, separated respectively into the corresponding four-month periods by year (2015 to 2020) and finally, the deviation of the price with respect to the average of its historical price in the afore mentioned period was calculated.
(variance, formula) 1).
(volatility, formula) 2).
Using the information in Table 1 and using an annual volatility of 8.69% (simple average of the volatility calculated above), U (future price of coffee in the following three four-month periods, which for producers represents one year) was estimated, which implies:
3) (Hull, 2011);
Where: U= proportional increase in the price of the future; T= time. σ= volatility. Which means that, if the price of coffee increased, it would do so in a proportion of 5.1416% ((u-1)x100), with respect to the price of the previous four-month period.
And the proportional decrease in the price of the future can be estimated by:
4).
Where: D= proportional decrease in the price of the future. Similarly, D can be interpreted as the decrease by 5.26% ((1-u) x100) in the price of coffee compared to the previous four-month period.
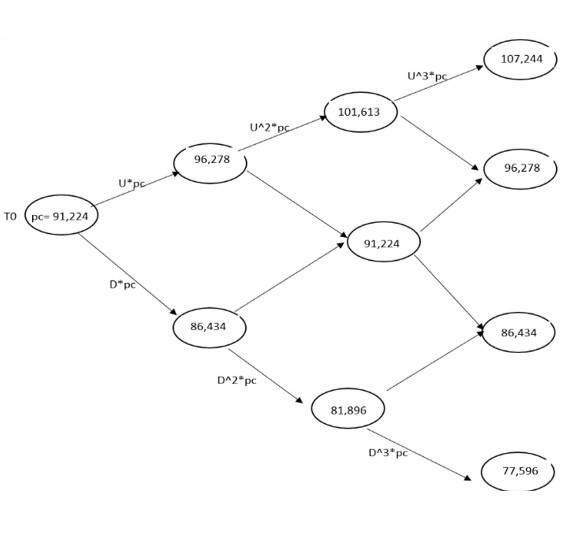
From the price received by coffee growers in the first four-month period of 2020, 91.224 USD cents per pound, a binomial tree is built assuming a probability of X, which estimates two possible price scenarios in the next three four-month periods of the year, that is, if prices increase or if they decrease. Binomial trees are commonly used to value options, a clear example is the work of Ochoa (2009), who uses binomial trees for the valuation of American options on TRM, although they can also be used to evaluate actions as Mariz (2016) does in her work entitled stochastic modeling of actions through binomial trees.
As Figure 1 shows, the price for the second quarter could statistically be 96.278 USD cents per pound or in a pessimistic scenario 86.434 USD cents per pound; this difference of 9.844 USD cents in prices is technically called price volatility, a situation that could eventually drastically affect the income of producers. Hence the importance of reducing the implicit risk represented by an eventual loss as a result of price behavior, as demonstrated by Ramírez (2006), in his work ‘modeling the volatility and forecast of the price of coffee’ in which he presents a review of the Garch (generalized autoregressive conditional heteroscedasticity) model.
Maximization of the target function
To calculate the optimal number of contracts, it is necessary to model the income that the producer expects to obtain at the time of selling their harvest, this income is generally composed of 2 variables. If it is considered that the producer does not use any hedging strategy to protect themselves against price fluctuations; also, that all their product is sold in a competitive market and that they are price takers (spot market), the income of the producer will be: price by quantity produced or in its mathematical form:I=Pq 5). Where: P= random price (volatile in time); q= production.
Arabica coffee (the variety that is produced in Mexico by up to 94%) futures are traded on the New York Stock Exchange and on the London Stock Exchange. When a producer wants to protect themselves from a fall in prices, they will choose to make a short sale of N contracts, in this way, if the price of coffee falls, the producer will compensate the loss of value of their product in the spot market with the profit generated in the futures market. In case of a rise in the price, the loss in the futures market will be compensated with the sale of the product in the spot market, in this way their income will be given by: the sale in the spot market plus the profit or loss in the futures market; that is: I=pcq+(PP-Pt)N 6). Where: Pp= price agreed in the futures market; Pt= price at time t; Pc= price in the spot market; q= production; N= number of contracts.
Having the equation of income complete, the utility of the producer is modeled to know the number of contracts that optimizes the utility, in this case, the utility of the producer can be interpreted as a portfolio formed by two assets, the number of contracts they will take and the amount of their production. To optimize this portfolio, we will use the Markowitz mean-variance model in its simplest form, this model assumes that the expected utility of the producer is a function of the expected income and its variance; that is: E(U)= E(I)-VAR(I) 7). Decomposing equation 7 and representing the respective terms, one has that:E (I)= qE(PC)+N(Pp)-NE(Pt) 8). Where: E= symbol of expectation; N= number of contracts. VAR (I)= q2VAR(Pc)+N2VAR(Pp)-2NqCOV(Pc, Pt) 9). Where: VAR= symbol of variance; COV= symbol of covariance.
Substituting equations 8 and 9 in equation 7, it is observed that: E(U)=qE(Pc)+N(Pp)-NE(Pt)-(q2VAR(Pc)+N2VAR(Pt)-2qNCOV(Pc,Pt) 10). In order to know N (number of contracts that maximizes the expected utility), equation 10 is differentiated with respect to N and equaled to zero.
11). Clearing N of 11:
12). Rewriting equation 12, one has that:
13).
Results
Developing equation 13 and replacing it in equation 6, we have that the income of the producer in each four-month period will be: I1=Pcq+0.3069Pp+0.3145qPp-0.3069Pt-0.3145qPt 14) I2=Pcq+0.6937Pp+2.1193qPp-0.6937Pt-2.1193qPt 15); I3=Pcq+0.947Pp+1.0869qPp-0.947Pt-1.0869qPt 16).
These equations tell us that now the income depends on the production that is expected to have (to take to the market), on the speculative game on the stock market and the spot price that exist at the time of making the evaluation. Reviewing the prices of the New York Stock Exchange for coffee futures contracts for September 2020, March 2021 and July 2021, one has the following: KCU2020= 110.45 Arabica coffee contract due in September 2020, which is listed at 110.45 USD cents per pound. KCH2021= 114.20 Arabica coffee contract due March 2021, which is listed at 114.20 USD cents per pound. KCN2021= 115.95 Arabica coffee contract due July 2021, which is listed at 115.95 USD cents per pound.
Considering these data as possible agreed prices (short sale, selling now those contracts in the futures market) and replacing the data in equation 14, 15 and 16, the hypothetical income of the producer is simulated, assuming that the producer produces in each four-month period the equivalent of a futures contract (37 500 pounds). Table 2 shows the behavior of the hypothetical income of the producer, derived from the use of hedges as a tool to reduce their risks, in the futures market.
Table 2 Income without hedging vs income with hedging, with prices falling.
| Cycle | Futures contract price | Price at the end of the production cycle. Downward binomial tree estimate | Income without hedging (dollar cents) | Income with hedging (USD) |
| September 2020 | 110.45 | 86.434 | I=86.434q | I=101.3576q |
| March 2021 | 114.20 | 81.896 | I=81.896q | I=172.769q |
| July 2021 | 115.95 | 77.59 | I=77.59q | I=155.69q |
In order to compare the results of Table 2, Table 3 presents the bullish scenario in the price of coffee. It is recalled that in this research it is the producer who took a short position.
Table 3 Income without hedging vs income with hedging, with rising prices.
| Cycle | Futures contract price | Price at the end of the production cycle. (Upward binomial tree estimate) | Income without hedging (dollar cents) | Income with hedging (USD) |
| September 2020 | 110.45 | 96.278 | I=96.278q | I=105.084q |
| March 2021 | 114.20 | 101.613 | I=101.613q | I=136.776q |
| July 2021 | 115.95 | 107.244 | I=107.244q | I=124.95q |
As can be seen in Tables 2 and 3, hedged income is higher in the two scenarios (both bullish and bearish), these results agree with the theory of the use of the futures market, which can be demonstrated in such a simple way, or in more complex ways, as Cárcamo (2008) does, who worked on continuous time models for agricultural commodities, or as De la Vega and Porras (2009) do in their paper entitled ‘stochastic models for the spot and futures prices of commodities with high volatility and reversion to the mean’.
It is also observed that the producer obtains a lower income in the bullish scenario, the main reason is the shorts they take in the futures market; that is, they foresee a fall in prices and the opposite happens, in this way, their income is still higher compared to that of a producer without hedging. We can also see that the further away (time) the productive cycle to be hedged is, the difference between income without hedging vs income with hedging increases, this is an indicator that tells us that the more the time passes, the estimate is less accurate and unreliable.
Discussion
The results of this analysis are in accordance with the theory, which tells us that the futures market can be used as a hedging tool, however, it is necessary to specify that, at present, traders in the futures market almost never reach the closing of the contract (delivery of the physical product); that is, they settle the operations earlier. In this sense, questions such as the following would have to be answered, when is the time to settle the contracts?, how long should the position be open?, this question opens the way to the analysis of the result of Figure 1, which shows that the income of the producer decreases when the price in the futures market goes in the opposite direction to the position that was taken and therefore the final income is negatively affected and of course the other question arises, what is the practical application for producers?, how should small producers be organized so that they can enter to operate the futures market?
Conclusions
In this work, it has been shown that analyzing the futures market in a simple way leads to convincing results about the efficiency of its use to hedge the economic risk involved in producing agricultural commodities, in this specific case, coffee. The equation with which the number of optimal contracts was calculated suggests that the income depends on the production that is expected to have (to take to the market), on the speculative game in the stock market; that is, the number of contracts to be taken and the spot price that exists at the time of making the evaluation.
It was also found that the income with hedging is higher in the two scenarios (both bullish and bearish) and that the further away (time) the productive cycle to be hedged is, the difference between income without hedging vs income with hedging increases, this is an indicator that tells us that the more time passes, the estimate is less accurate and unreliable, this is mainly due to a bias of the mathematical type in the formulation of the model. The model can also fail if the hedging strategy is not correct; that is, if the number of contracts taken short in the futures market is not adequate. Finally, the results suggest that producers could be motivated to use futures contracts as a hedging strategy, since, even if the profits are not extraordinary, the income will always be higher when such hedging is used than when it is not used.
Literatura citada
Cárcamo, U. C. 2008. Modelos de tiempo continuo para commodities agrícolas en Colombia. Colombia. Ad-minister. 11(1):42-63. [ Links ]
CEDRSSA. 2018. Centro de estudios para el desarrollo rural sustentable y la soberanía alimentaria. El café en México. obtenido de: http://www.cedrssa.gob.mx. [ Links ]
FIRA. 2011. Fideicomisos Instituidos en Relación con la Agricultura. Mercado de futuros y Opciones. México. FIRA Boletín. 11(1):6-7. [ Links ]
Gutiérrez, R. 2018. Predicción de las razones de cobertura cruzada optima en el mercado del petróleo mexicano. México. Revista Mexicana de Economía y Finanzas Nueva Época. REMEF. 1(13):48-67. [ Links ]
Hull, J. C. 2011. Introducción a los mercados de futuros y opciones. México: Pearson educación. [ Links ]
Mariz, N. A. 2016. Modelización estocástica de acciones mediante arboles binomiales. España. Rev. Leopoldo Pons. https://www.leopoldopons.com/estudios-y-publicaciones/modelizacion-estocastica-de-acciones-mediante-arboles-binomiales/ [ Links ]
Merton, C. R. 1973.Theory of rational option pricing. EE.UU. The bell journal of economics and management science.1(4):141-183. [ Links ]
Investing. 2020. Investing.com. https://mx.investing.com/commodities/us-coffee-c-historical-data. [ Links ]
Ochoa, C. M. 2009. Metodologías alternativas para la valoración de opciones americanas sobre TRM. Repositorio Institucional EAFIT. [ Links ]
Ramírez, F. O. 2006. Modelación de la volatilidad y pronóstico del precio del café. Colombia. Rev. Ingenierías Universidad de Medellín. 9(5):45-58. [ Links ]
Solares, D. O. 2011. Contrato C, principales características. Guatemala. [ Links ]
Working, H. X. 1953. Futures traiding and hedging. EE. UU. American economic review. 3(43):314-343. http://www.ico.org/es/new-historical-c.asp. [ Links ]
Received: August 01, 2022; Accepted: September 01, 2022
 Este es un artículo publicado en acceso abierto bajo una licencia Creative Commons
