


Services on Demand
Journal
Article
 text in
  English (pdf)
 Article in xml format
 Article references
 Send this article by e-mail
Indicators
-
 Cited by SciELO
 -
 Access statistics
Related links
-
 Similars in
SciELO
Similars in
SciELO
Share

 Permalink
Revista mexicana de ciencias agrícolas
Print version ISSN 2007-0934
Rev. Mex. Cienc. Agríc vol.11 n.6 Texcoco Aug./Sep. 2020 Epub Oct 11, 2021
https://doi.org/10.29312/remexca.v11i6.2613
Articles
Potential distribution of two leguminous species in the microbasin Tula, Mexico
1Maestría en Agroforestería para el Desarrollo Sostenible-Departamento de Suelos-Universidad Autónoma Chapingo. Carretera Texcoco-México km 38.5, Texcoco, Estado de México. CP. 56230. (zamora.elizalde.231195@gmail.com; blondynunez@gmail.com).
2 Ingeniería en Recursos Naturales Renovables-Departamento de Suelos-Universidad Autónoma Chapingo. Carretera México-Texcoco km 38.5, Texcoco, Estado de México. CP. 56230. (arturomgarcia09@gmail.com).
3Posgrado en producción animal-Departamento de Zootecnia-Universidad Autónoma Chapingo. Carretera México-Texcoco km 38.5, Texcoco, Estado de México. CP. 56230. (arturomrtz@hotmail.com).
Macroptilium atropurpureum (DC.) Urb and Vicia sativa L. are two forage species with potential for the rehabilitation of soils that tolerate drought, compete with unwanted plants and fix nitrogen. However, its potential distribution in Mexico and the convenient areas to introduce them are unknown. The objective of the present work was to evaluate the potential geographical distribution of M. atropurpureum and V. sativa, in the Tula micro-basin, Mexico using the BIOCLIM ecological niche model, to determine their optimal growth zones, for soil rehabilitation purposes. For the modeling, 15 bioclimatic variables were used, as well as 19 records of the presence of the species V. sativa and 219 of M. atropurpureum, obtained from the REMIB and MEXU databases. The modeling results indicated that the models, for M. atropurpureum and V. sativa, have a good predictive capacity, according to the values obtained from the Area under the Curve, AUC, with 0.801 and 0.967, respectively. The potential distribution of the V. sativa species ranged from low to very low, 96% of the surface of the micro-basin; while 97% of the surface for M. atropurpureum was very low and they registered a regular survival with 70% and 66%, respectively, in the experimental validation in the field. Due to the low distribution potential and their regular survival, the introduction of the two species was not considered an option for soil rehabilitation in the Tula microbasin.
Keywords: Macroptilium atropurpureum; Vicia sativa; Bioclim
Macroptilium atropurpureum (DC.) Urb y Vicia sativa L. son dos especies forrajeras con potencial para la rehabilitación de suelos que toleran la sequía, compiten con plantas indeseadas y fijan nitrógeno. Sin embargo, se desconoce su distribución potencial en México y las zonas convenientes para introducirlas. El objetivo del presente trabajo fue evaluar la distribución geográfica potencial de M. atropurpureum y V. sativa, en la microcuenca Tula, México mediante el modelo de nicho ecológico BIOCLIM, para determinar sus zonas de óptimo crecimiento, con fines de rehabilitación de suelos. Para la modelación, se utilizaron 15 variables bioclimáticas, así como 19 registros de presencia de la especie V. sativa y 219 de M. atropurpureum, obtenidos de las bases de datos REMIB y MEXU. Los resultados de la modelación indicaron que los modelos, para M. atropurpureum y V. sativa, tienen una buena capacidad de predicción, de acuerdo con los valores obtenidos del Área Bajo la Curva, AUC, con 0.801 y 0.967, respectivamente. La distribución potencial de la especie V. sativa osciló de bajo a muy bajo, 96% de la superficie de la microcuenca; mientras que 97% de la superficie para M. atropurpureum fue muy baja y registraron una regular supervivencia con 70% y 66%, respectivamente, en la validación experimental en campo. Debido al bajo potencial de distribución y su regular supervivencia, la introducción de las dos especies no se consideró una opción para la rehabilitación de suelos en la microcuenca Tula.
Palabras clave: Macroptilium atropurpureum; Vicia sativa; Bioclim
Introduction
In recent decades, the population of the 14 municipalities that make up the Tula microbasin has increased on average by 2% per year, with a population of 288 196 inhabitants in 2010 (INEGI, 2013a). In addition, the population density increased from 205 to 278 inhabitants km-2 (1990-2010), reaching 61 inhabitants km-2 above the national average (INEGI, 2013a). This has intensified the pressure on the region’s natural resources, due to the demand for goods and services by society (Zamora et al., 2020).
In the area there has been a disorderly growth of urban areas, displacing agricultural and forestry areas, in addition to an increase in the area of extraction of construction materials (INEGI, 2017a, 2017b, 2017c), which has caused an increase in the land use change.
According to Zamora et al. 2020, in the period from 2000 to 2017 there was an increase of 4.17% agricultural areas in the Tula microbasin, this being an economic activity that deteriorate the soil resource, in addition in the microbasin there are abandoned areas due to the reduction or loss of its productivity, which according to Zavala-Cruz et al. (2011) implies that the soil resource is degraded. For this reason, it is necessary to look for alternative plant species that have optimal growth in the region and also allow the rehabilitation of degraded soils.
The M. atropurpureum species is located from the southern United States of America and Mexico to Central and South America, specifically in Brazil, Colombia, Ecuador and Perú (McVaugh, 1987). While, V. sativa L. is native to Europe, North Africa and West Asia and considered an exotic species in Mexico (Vibrans, 2009b).
Both species belong to the Fabaceae family, to the Faboideae sub family and are used for forage in Mexico (Vibrans, 2009a, 2009b). According to Lewis et al. (2005), the Fabaceae family has an extensive geographical distribution in the world; that is, 727 genera, with 19 327 species of cosmopolitan distribution, located mainly in warm and temperate regions. While, in Mexico, 1 851 species have been recognized (Sousa et al., 2001). M. atropurpureum and V. sativa are species that are characterized by tolerating drought, competing with unwanted plants and fixing nitrogen (La O et al., 2006; Flores et al., 2007).
However, to date, there is no information about their potential geographical distribution at the regional level, despite the fact that due to their characteristics it is possible to use them as multipurpose herbaceous plants. In Mexico, the species M. atropurpureum is located mainly in paddocks and roadsides and has been registered in 28 states, while V. sativa is located especially in oak pine forests and is registered in 8 states (Flores et al., 2007; Vibrans, 2009a, 2009b).
On the other hand, the factors that determine the presence of a species in a geographic area are, among others, abiotic conditions (climate, topography, edaphic conditions, etc.), that is, they are those that determine its ecological niche (Austin, 2002; Soberon and Nakamura, 2009). In the last 15 years, the development of programs for the modeling of ecological niches has been a new field of research with high growth (Kearney, 2006; Lobo et al., 2010).
These programs model, based on Hutchinson’s ecological niche concept (Hutchinson, 1957; Guisan and Zimmermann, 2000; Elith et al., 2010) relating the biological information of the species (presence-absence and abundance) and the environmental information (Soberon and Peterson, 2005; Soberon, 2007). BIOCLIM is one of the first algorithms used for the modeling of ecological niches, and is supported by envelope functions (Nix, 1986; Busby, 1991); that is, it identifies areas with climatic characteristics similar to the areas where the presence of a certain species has been registered, generating an ecological interval for the species according to the predictive variables (Palacios et al., 2016).
Niche modeling with BIOCLIM has been used in several studies, including that of Finch et al. (2006) with invertebrates in Africa, Aguirre-Morales et al. (2016) with Passiflora subgenus Astrophea (Passifloreceae) in Colombia and Palacios et al. (2016) with Prosopis laevigata (Humb. Et Bonpl. Ex Willd) M. C. Johnston, in each study the potential distribution of the species was determined. Therefore, the objective of this research was to evaluate the potential geographical distribution of two forage legume species: Macroptilium atropurpureum (DC.) Urb and Vicia sativa L., in the Tula microbasin, Mexico; through the modeling of their respective ecological niches, using the BIOCLIM algorithm, to determine if they can have optimal growth in this region to be used as an alternative for soil rehabilitation.
Materials and methods
Location of area of study
The Tula micro-basin is located between the geographical coordinates: 19° 55’ 31’’ and 19° 34’ 28’’ north latitude and 98° 39’ 59’’ and 98° 28’ 16’’ west latitude with an area of 1 037.66 km2 (Zamora et al., 2020). It is made up of the states of Hidalgo (77%), the State of Mexico (18.03%) and Tlaxcala (4.8%) with a total of 14 municipalities.
The Tula microbasin belongs to the hydrological region 26. The Panuco River Basin and the physiographic province of the transverse Neovolcanic axis, has an altitudinal range of between 2 333 m and 3 223 masl. It has an average annual precipitation of 600 mm and an average annual temperature of 14 °C. The predominant soils are hyphalic pheozem (65% of the surface), litosol (11%) vertisol pelico (11%), cambisol eutric (9%) (INEGI, 2017a; 2017b, 2017c).
By having a wide climatic and edaphic variety, it allows the existence of different types of vegetation, among which are forests of tascate, pine, oak, crasicaule scrub, secondary vegetation, seasonal agriculture and irrigation agriculture (INEGI, 2017d).
Obtaining presence data
The records of the presence of the species M. atropurpureum and V. sativa were obtained from the database of the World Biodiversity Information Network (REMIB) and the National Herbarium of Mexico of the Institute of Biology, UNAM (MEXU), which They have been used in a large number of modeling studies of potential species distribution areas and ecological niche modeling (Herrera and Cortes, 2009; Martínez-Méndez et al., 2016; Palacios et al., 2016; Reynoso et al., 2018).
The records of both species were purified, in order to eliminate repeated records or those that did not contain a coordinate system; through Geographic Information Systems (GIS) (Guisan and Zimmermann, 2000; Broennimann et al., 2012).
Environmental variables
To perform the distribution models of M. atropurpureum and V. sativa, 15 variables were used (Hijmans et al., 2005). 14 of them were derived from the monthly values of maximum temperature, minimum temperature and precipitation, obtained from the WorldClim Version 1.4 platform (http://www.worldclim.org/), which represent the conditions from 1970 to 2000. In addition to the INEGI digital elevation model (INEGI, 2013b) with a spatial resolution of 120 m, as a topographic variable (Table 1).
Table 1 Variables incorporated in the modeling of the ecological niches of V. sativa and M. atropurpureum.
| Key | Environmental variable |
| BIO1 | Average annual temperature |
| BIO2 | Average daytime temperature range (monthly mean (maximum temperature-minimum temperature)) |
| BIO3 | Isothermality (BIO2 / BIO7)*(100) |
| BIO4 | Seasonality of temperature (standard deviation * 100) |
| BIO5 | Maximum temperature of the month plus heating |
| BIO6 | Minimum temperature of the coldest month |
| BIO7 | Annual temperature range (BIO5-BIO6) |
| BIO10 | Average temperature of the warmest quarter |
| BIO11 | Average temperature of the coldest quarter |
| BIO12 | Total annual precipitation |
| BIO13 | Precipitation of the wettest month |
| BIO14 | Driest month precipitation |
| BIO15 | Seasonality of precipitation (Coefficient of variation) |
| BIO16 | Precipitation of the wettest quarter |
| BIO17 | Driest quarter precipitation |
| Alt | Altitude (m) |
DIVA-GIS modeling
The analysis of potential geographic distribution of both species was performed with the DIVA-GIS ver. 7.5.0, using the BIOCLIM algorithm. To use this program, it was necessary to homogenize the layers to a standard size of 21.16 km2 and they were cut with the pre-established limit of the Mexican Republic, using the QGIS 2.14.3 program (Martínez-Méndez et al., 2016; Reynoso et al., 2018). Once the modeling was done, the layer was cut with the limit of the Tula microbasin. To determine the estimated fitness for development of both species, the scale proposed by Palacios et al. (2016) that includes 6 intervals: null, very low, low, medium, good, optimal.
Statistical validation
The predictive ability of a model is evaluated with a presence dataset independent of the one used to calibrate the model (Guisan and Zimmermann, 2000). The receiver operated curve (ROC) assesses the predictive ability of distribution models by means of the area under the curve (AUC), which measures the model's ability to correctly classify a species as present or absent (Hanley and McNeil, 1982).
AUC values can be interpreted as the probability that, when a point of presence and one of absence are randomly selected, the point of presence will have a higher suitability or probability value on the model. According to Araujo and Guisan (2006), the AUC values to classify the precision of the models is: 0.5-0.6= insufficient; 0.61-0.7= poor; 0.71-0.8= regular; 0.81-0.9= good; 0.91-1= excellent. Although, AUC values between 0.7 and 0.9 are considered models with good precision (Peterson et al., 2001).
Field survival assessment
According to Ramírez (2011), the evaluation of survival in the field allows obtaining a quantitative measure of the success of the plantation under the influence of site factors. The survival assessment of the V. sativa and M. atropurpurem species was carried out during the years 2018 and 2019, in the common de San Felipe Teotitlan, which covers part of the municipalities of Axapusco and Nopaltepec, in the State of Mexico, within the Tula micro-basin (Figure 1), the experiment was carried out in an area 20 x 55 m wide and long, respectively, located between the geographical coordinates of 19° 50’ 24 and 19° 49’ 00’’ latitude. north and 98° 42’ 00’’ west longitude,

Figure 1 Location of the experimental area for the introduction of species in common San Felipe Teotitlan, Mexico.
The implementation of the experiment consisted of producing seedlings of M. atropurpurem, which is a perennial species, in the greenhouse of the Department of Animal Husbandry at the Autonomous University Chapingo (UACH), during the period from May to July 2018. Also, it was carried out the preparation of the ground, beginning with the breaking of the ground to contour lines with a spacing of 11 m, and the opening of trenches of 20 x 0.3 x 0.2 m in length, width and depth, respectively.
Subsequently, the trenches were filled with soil from the region and zeolite (0.5 kg plant-1), due to the presence of stone and tepetate in the first 0.15 m depth. Finally, the M. atropurpurem seedlings were transplanted during the first week of August at a distance of 0.2 m between each plant, in the first 10 meters of the trench. It is worth mentioning that V. sativa, which is an annual species, was planted directly in the field in the remaining 10 meters of the trench, in the same period and at the same distance.
In December 2018, survival was assessed, defined as the number of seedlings that survived at the end of the follow-up control, with respect to the number of plants at the start of the study, this value is expressed as a percentage (Ramos-Font et al., 2015). In the month of June 2019, all the dead plants were replaced, this time the seeding was direct in both species and survival was evaluated, in the month of October 2019.
Results and discussion
The presence records obtained from the MEXU and REMIB databases for the species M. atropurpureum were 219 after the purification process of the 856 records with the QGIS 2.14.3 software and for the species V. sativa 19 records were obtained after debugging the 124 records.
The presence records indicated that M. atropurpurem has a wide distribution in Mexico, and was mainly identified in the states of Oaxaca (68 records), Puebla (29), Campeche (25) and Chiapas (20), which coincides with what reported by Vibrans (2009a). While V. sativa was registered in seven states, with the State of Mexico (9 records) having the most records, which coincides with what was reported by Vibrans (2009b); Flores et al. (2007) (Figure 2).

According to the values obtained from the records for V. sativa and M. atropurpurem, the ranges of the environmental variables in which the largest number of individuals have been reported nationwide were obtained. For V. sativa, the average annual temperature range obtained was from 13.8 to 17.3 °C (Table 2), this range indicates that it does not tolerate cold for optimal growth, as mentioned by Alfonso (2007).
Table 2 Bioclimatic intervals of the areas in which the presence of V. sativa and M. atropurpurem is recorded in Mexico.
| Environmental variable | V. sativa | M. atropurpureum | |||
| Interval | Int. higher frequency | Interval | Int. higher frequency | ||
| Annual mean temperature (°C) | 6.9-24.1 | 13.8-17.3 | 12.3-27.6 | 24.5-27.6 | |
| Average daytime t. range (° C) | 9.9-18.1 | 14.8-16.4 | 3.2-19.8 | 9.8-13.1 | |
| Isothermality | 57.7-74.5 | 67.8-71.2 | 23.9-83.7 | 59.8-71.7 | |
| Seasonality of the t. | 124.6-351.5 | 170-215.4 | 59.7-788 | 205.4-351 | |
| T. max. warmest month (° C) | 15.8-35.9 | 23.8-27.9 | 21.7-40 | 32.7-36.3 | |
| T. min. coldest month (° C) | -1.5-12 | 1.2-3.9 | -2.9-20.1 | 15.5-20.1 | |
| Annual t. range (° C) | 16.8-26 | 22.3-24.2 | 13.2-38.6 | 18.3-23.4 | |
| Warmest quarter mean t. (° C) | 8.4-27.6 | 16.1-20 | 14-31.1 | 27.6-31.1 | |
| Coldest quarter mean t. (° C) | 5.4-21.3 | 8.6-11.8 | 6.8-26.5 | 18.6-22.6 | |
| Total annual precipitation (mm) | 531-1981 | 821-1111 | 70-3386 | 733.2-1396.4 | |
| P. of the wettest month (mm) | 92-404 | 216.8-279.2 | 16-638 | 140.4-264.8 | |
| P. of the driest month (mm) | 2-45 | 2-10 | 0-99 | 0-19.8 | |
| P. seasonality (mm) | 70.8-113.1 | 96.2-104.7 | 52.3-136.2 | 102.6-119.4 | |
| P. of the wettest quarter (mm) | 266-1068 | 586.8-747.2 | 35-1693 | 366.6-698.2 | |
| P. of the driest quarter (mm) | 17-142 | 17-42 | 0-327 | 0-65.4 | |
Regarding the precipitation range of the sites in which it obtained the highest frequency of presence, it was from 821 to 1111 mm, with a general interval of 531 to 1 981 mm, a range that differs from that reported by Flores et al. (2007), who indicate that it grows and develops from 200 to 400 mm because the species withstands water stress.
For the M. atropurpurem species, the highest number of individuals were found at an average annual temperature of 24.5 to 27.6 °C, indicating that it has a lower tolerance at the cold than the V. sativa species. While, the annual precipitation range was from 733.2 to 1 396.4 mm, a range that is within the range 650-1 500 mm reported by Vibrans (2009a) for this species and between that reported by (Guerrero et al., 2009) 650 at 1 750 mm, the general range obtained was from 70 to 3 386 mm, which explains its extensive distribution in Mexico and its tolerance to water stress.
The ranges of the environmental variables obtained for Mexico and the climatic information of the Tula micro-basin, which has an average annual temperature of 14 °C and an average annual precipitation of 600 mm (INEGI, 2017a, 2017b, 2017c), indicate that V. sativa according to temperature if you can have adequate growth. However, in the micro-basin there is not an optimal precipitation for the optimal growth of this species. In the case of M. atropurpurem, the micro-basin does not have an average annual temperature or an average annual precipitation adequate for its optimal growth.
The results obtained from the potential geographical distribution by modeling with BIOCLIM, for the species V. sativa, indicates that the micro-basin has a total area of 41.51 km2 with zero potential, which is equivalent to 4% of the surface, while 996.15 km2 (96%) have potential; of this surface, 21% (209.19 km2) corresponds to low potential and 79% (786.96 km2) corresponds to a very low potential (Figure 3).

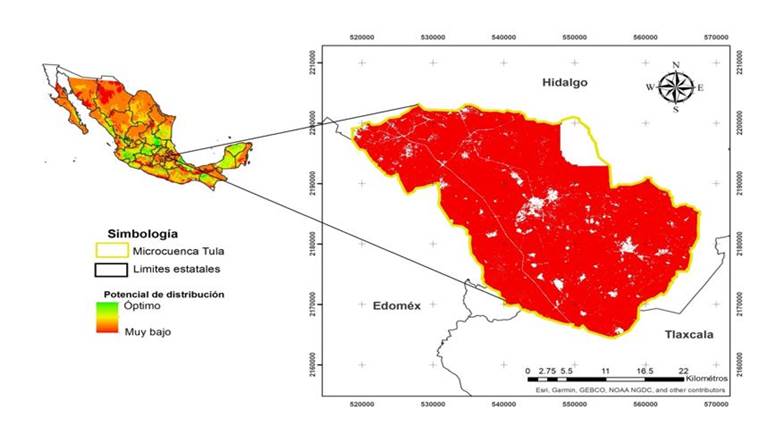
This indicates that in the micro-basin the species will develop but will not reach its optimal growth and therefore yield, since the species requires a higher average annual rainfall. The potential geographical distribution of the M. atropurpureum species in the micro-basin was 3% (31.12 km2) with zero potential and 97% (1 006.53 km2) with very low potential (Figure 4), indicating that the species it will not have optimal growth in this region, because it requires a higher temperature and annual average precipitation.
Regarding the evaluation of the survival of the species in the field, which allows to quantitatively measure the success of the plantation under the influence of the factors of the site (Ramirez, 2011), during the year 2018, this was 100% for M. atropurpurem and 0% V. sativa, the latter value was attributed to the presence of wildlife. However, in the evaluation of the year 2019, both species recorded a regular survival, with 66% for the M. atropurpurem species and 70% for V. sativa.
This last species competed favorably against the annual herbaceous plants of the site and reached pod formation, while M. atropurpurem had a slow growth with a height less than 0.01 m in the vegetative state. It is worth mentioning that it is possible to improve their adaptation by improving the edaphic aspects as they did in Zacatecas with the V. sativa species, by applying auxiliary irrigation, fertilizing and controlling weeds (Flores et al., 2007; Flores et al., 2016). However, due to the costs involved, it is not recommended that they be used in projects for this region.
Finally, the AUC values, obtained for the validation of the prediction precision of the models, for M. atropurpureum and V. sativa, were 0.801 and 0.967 respectively, values that indicated that the models have a good prediction precision (Peterson et al., 2001; Araujo and Guisan, 2006; Phillips and Dudík, 2008).
Conclusions
The ecological niche models obtained with the BIOCLIM algorithm for the M. atropurpurem and V. sativa species have good prediction precision to obtain the potential distribution of the species. The low distribution potential obtained in the modeling and the regular survival of the leguminous species M. atropurpurem and V. sativa indicated that these species are not the most suitable to enter the Tula microbasin; however, studies are needed on the adaptation of these species to the region by improving the edaphic aspects of the introduction site.
Literatura citada
Aguirre-Morales, A. C.; Bonilla-Morales, M. M. y Caetano, C. M. 2016. Evaluación de la diversidad y patrones de distribución de Passiflora subgénero Astrophea (Passifloraceae) en Colombia. Un reto para la investigación taxonómica, florística y de conservación de las especies. Acta Agronómica. 4(65):422-430. doi: https://doi.org/10.15446/acag.v65n4.51444. [ Links ]
Alfonso-S, M. A. 2007. Leguminosas de interés para la implantación de praderas. Universidad Politécnica de Madrid. Madrid, España. 17 p. [ Links ]
Araujo, M. B. and Guisan, A. 2006. Five (or so) challenges for species distribution modelling. J. Biogeography. 33(10):1677-1688. https://doi.org/10.1111/j.1365-2699.2006.01584.x. [ Links ]
Austin, M. P. 2002. Case studies of the use of environmental gradients in vegetation and fauna modelling: theory and practice in Australia and New Zealand. In: predicting species occurrences: issues of accuracy and scale. Scott, J. M.; Heglund, P. J.; Morrison, M. L.; Haufler, J. B.; Raphael, M. G.; Wall, W. A. and Samson, F. B. (Eds.). Island Press. Washington. 73-82 pp. [ Links ]
Broennimann, O.; Fitzpatrick, M. C.; Pearman, P. B.; Petitpierre, B.; Pellissier, L.; Yoccoz, N. G. and Guisan, A. 2012. Measuring ecological niche overlap from occurrence and spatial environmental data. Global Ecol. Biogeography. 4(21):481-497. doi: https://doi.org/10.1111/j.1466-8238.2011.00698.x. [ Links ]
Busby, J. R. 1991. BIOCLIM-a bioclimate analysis and prediction system. Plant Protection Quarterly. 1(6):8-9. [ Links ]
Elith, J.; Kearney, M. and Phillips, S. 2010. The art of modeling range-shifting species. Methods in Ecol. Evol. 4(1):330-342. doi: https://doi.og/10.1111/j.2041-210X.2010.00036.x. [ Links ]
Finch, J. M. Samways, M. J.; Hill, T. R.; Piper, S. E. and Taylor, S. 2006. Application of predictive distribution modeling to invertebrates: Odonata in South Africa. Biodiversity and Conservation. 13(15):4239-4251. doi: https://doi.org/10.1007/s10531-005-3577-z. [ Links ]
Flores-N, M. de J.; Sánchez-G, R. A.; Echavarría-C, F. G.; Gutiérrez-L, R.; Rosales-N, C. A. y Salinas-G, H. 2016. Producción y calidad de forraje en mezclas de veza común con cebada, avena y triticale en cuatro etapas fenológicas. Rev. Mex. Cienc. Pec. 3(7):275-291. [ Links ]
Flores-O, M. Á.; Gutiérrez, L. R.; y Palomo, R. M. 2007. Veza común y Lathyrus sativus L.: alternativas para producir forraje en Zacatecas. Instituto Nacional de Investigaciones Forestales, Agrícolas y Pecuarias (INIFAP). DF., México. 40 p. [ Links ]
Guerrero-R, J. de D.; Vargas, L. S.; Bustamante, G. A. y Castro, G. N. P. 2009. Leguminosas forrajeras: opciones para la producción de rumiantes en el Estado de Puebla. Agroproductividad. 3(2):16-22. [ Links ]
Guisan, A. and Zimmermann, N. E. 2000. Predictive habitat distribution models in ecology. Ecological Modelling. 2-3(135):147-186. doi: https://doi.org/10.1016/S0304-3800(00)00354-9. [ Links ]
Hanley, J. A. and McNeil, B. J. 1982. The meaning and use of the area under a receiver operating characteristic (ROC) curve. Radiology. 143(1):29-36. [ Links ]
Herrera, A. Y. y Cortés, O. A. 2009. Diversidad y distribución de las gramíneas (Poaceae) en el estado de Zacatecas. The Botanical Research Institute of Texas, Inc. 2(3):775-792. [ Links ]
Hijmans, R. J.; Cameron, S. E.; Parra, J. L.; Jones, P. G. and Jarvis, A. 2005. Very high-resolution interpolated climate surfaces for global land areas. Inter. J. Climatol. 15(25):1965-1978. doi:https://doir.org/10.1002/joc.1276. [ Links ]
Hutchinson, G. E. 1957. Concluding remarks. Cold spring harbor symposium on quantitative biology. 1(22):415-457. [ Links ]
INEGI. 2013a. Instituto Nacional de Estadística y Geografía. Censo de población y vivienda 2010. https://www.inegi.org.mx/programas/ccpv/2010/. [ Links ]
INEGI. 2013b. Instituto Nacional de Estadística y Geografía. Continúo de elevaciones mexicano (CEM). https://www.inegi.org.mx/app/geo2/elevacionesmex/. [ Links ]
INEGI. 2017a. Instituto Nacional de Estadística y Geografía. Anuario estadístico y geográfico de Hidalgo 2017. https://www.datatur.sectur.gob.mx/ITxEF-Docs/HGO-ANUARIO-PDF.pdf. [ Links ]
INEGI. 2017b. Instituto Nacional de Estadística y Geografía. Anuario estadístico y geográfico de México 2017. https://www.inegi.org.mx/app/biblioteca/ficha.html?upc=702825097912. [ Links ]
INEGI. 2017c. Instituto Nacional de Estadística y Geografía. Anuario estadístico y geográfico de Tlaxcala 2017. https://www.datatur.sectur.gob.mx/ITxEF-Docs/TLAX-ANUARIO-PDF.pdf. [ Links ]
INEGI. 2017d. Instituto Nacional de Estadística y Geografía. Conjunto de datos vectoriales de uso de suelo y vegetación. Escala 1:250000. Serie VI. http://www.conabio.gob.mx/ informacion/gis/. [ Links ]
Kearney, M. 2006. Habitat, environment and niche: what are we modelling? Oikos. 1(115):186-191. doi: https://doi.org/10.1111/j.2006.0030-1299.14908.x. [ Links ]
La-O, O.; Chongo, B.; Delgado, D. y Ruiz, T. 2006. Fraccionamiento proteico y digestión ruminal de nutrientes de siratro (Macroptilium atropurpureum). Rev. Cubana Cienc. Agríc. 3(40):315-320. [ Links ]
Lewis, G.; Schrire, B.; MacKinder, B. and Lock, M. 2005. Legumes of the World. Royal Botanic Gardens. https://www.cambridge.org/core/journals/edinburgh-journal-of-botany/article/abs/legumes-of-the-world-edited-by-g-lewis-b-schrire-b-mackinder-m-lock-royal-botanic-gardens-kew-2005-xiv-577pp-colour-photographs-line-drawings-isbn-1-900-34780-6-5500-hardback/B150C09BB9224913D2CE31834394FA7A. [ Links ]
Lobo, J. M.; Jiménez-Valverde, A. and Hortal, J. 2010. The uncertain nature of absences and their importance in species distribution modelling. Ecography. 1(33):https://doi.org/103-114. doi: 10.1111/j.11/j.1600-0587.2009.06039.x. [ Links ]
Martínez-Méndez, N.; Aguirre-Planter, E.; Eguiarte, L. E. y Jaramillo-Correa, J. P. 2016. Modelado de nicho ecológico de las especies del género Abies (Pinaceae) en México: algunas implicaciones taxonómicas y para la conservación. Botanical Sci. 1(94):5-24. doi: https://doir.org/10.17129/botsci.508. [ Links ]
McVaugh, R. 1987. Leguminosae. In: Flora Novo-Galiciana. Anderson, W. R. (Ed.). The University of Michigan Press. Ann Arbor, Michigan. 786 p. [ Links ]
Nix, H. A. 1986. A biogeographic analysis of Australian elapid snakes. In: atlas of elapid snakes of Australia. Australian Flora and Fauna. Longmore, R. (Ed.). Australian Government Publishing Service. Canberra, Australia. 4-15 pp. [ Links ]
Palacios, R. A.; Rodríguez, L. R. y Hernández, F. M. de la L. 2016. Distribución potencial de Prosopis laevigata (Humb. et Bonpl. ex Willd) M. C. Johnston basada en un modelo de nicho ecológico. Rev. Mex. Cienc. Forest. 34(7):35-46. doi: https://doi.org/10.29298/rmcf.v7i34.81. [ Links ]
Peterson, N.; Soberon, J.; Pearson, R. G.; Anderson, R. P.; Martinez-Mayer, E.; Nakamura, M. and Araujo, M. B. 2001. Ecological Niches and Geographic Distributions. Princeton University Press, New Jersey. 51-149 pp. [ Links ]
Phillips, S. J. and Dudík, M. 2008. Modeling of species distributions with Maxent: new extensions and comprehensive evaluation. Ecography . 31(2):161-175. doi: 10.1111/j.2007.0906-7590.05203.x. [ Links ]
Ramírez, D. M. 2011. Metodología para realizar y presentar informes (ISI) de las plantaciones forestales comerciales. Comisión Nacional Forestal. México. 19 p. http://www.conafor.gob.mx:8080/documentos/ver.aspx?grupo=6&articulo=1564. [ Links ]
Ramos-Font, M. G.; González-R, J. L. y Robles-C, A. B. 2015. Dispersión endozoócora de leguminosas silvestres: desde la recuperación hasta el establecimiento en campo. Ecosistemas. 3(24):14-21. doi: 10.7818/ECOS.2015.24-3.03. [ Links ]
Reynoso, S. R.; Pérez-H, M. J.; López, B. W.; Hernández, R. J.; Muñoz-F, H. J.; Cob-U, J. V. y Reynoso-S, M. D. 2018. El nicho ecológico como herramienta para predecir áreas potenciales de dos especies de pino. Rev. Mex. Cienc. Forest. 48(9):47-68. doi: https://doi.org/10.29298/rmcf.v8i48.114. [ Links ]
Soberón, J. 2007. Grinnellian and Eltonian niches and geographic distributions of species. Ecology Letters. 12(10):1115-1123. doi: 10.1111 / j.1461-0248.2007.01107.x. [ Links ]
Soberón, J. and Nakamura, M. 2009. Niches and distributional areas: concepts, methods, and assumptions. PNAS. 2(106):1-7. doi: 10.1073/pnas.0901637106. [ Links ]
Soberón, J. and Peterson, A. T. 2005. Interpretation of model of fundamental ecological niches and species distributional areas. Biodiversity Informatics. 1(2):1-10. doi: 10.17161/bi.v2i0.4. [ Links ]
Sousa, S. M.; Ricker, M. and Hernández, H. M. 2001. Tree species of the family Leguminosae in Mexico. Harvard Papers in Botany. 1(6):339-365. [ Links ]
Vibrans, H. 2009 b. Malezas de México: Vicia sativa L. CONABIO-COLPOS-SEMARNAT. http://www.conabio.gob.mx/malezasdemexico/fabaceae/vicia-sativa/fichas/ficha.htm [ Links ]
Zamora-E, M. C.; Buendía-E, J. C.; Martínez-H, P. A. y García-N, R. M. 2020. Diagnóstico del uso del suelo y vegetación en la microcuenca Tula, México. Rev. Mex. Cienc. Agríc. 1(11):57-68. doi: https://doi.org/10.29312/remexca.v11i1.2213. [ Links ]
Zavala-Cruz, J.; Palma-López, D. J.; Fernández-C, C. R.; López, C. A. y Shirma, T. E. 2011. Degradación y conservación de suelos en la cuenca del Río Grijalva, Tabasco. Colegio de Postgraduados. Secretaría de Recursos Naturales y Protección Ambiental y PEMEX. Tabasco, México, DF. 89 p. [ Links ]
Received: April 01, 2020; Accepted: July 01, 2020
 Este es un artículo publicado en acceso abierto bajo una licencia Creative Commons
