


Services on Demand
Journal
Article
 text in
  English (pdf)
 Article in xml format
 Article references
 Send this article by e-mail
Indicators
-
 Cited by SciELO
 -
 Access statistics
Related links
-
 Similars in
SciELO
Similars in
SciELO
Share

 Permalink
Revista mexicana de ciencias agrícolas
Print version ISSN 2007-0934
Rev. Mex. Cienc. Agríc vol.10 n.6 Texcoco Sep. 2019 Epub Oct 02, 2020
https://doi.org/10.29312/remexca.v10i6.1658
Articles
Adaptation of black bean genotypes to different environments of Veracruz and Chiapas
1Campo Experimental Cotaxtla-INIFAP. Carretera Veracruz-Córdoba km 34.5, Medellín de Bravo, Veracruz, México. CP. 91700. (tosquy.oscar@inifap.gob.mx; zetina.rigoberto@inifap.gob.mx).
2Campo Experimental Centro de Chiapas-INIFAP. Carretera Ocozocoautla-Cintalapa km 3.0, Ocozocoautla, Chiapas. CP. 29140. (villar.bernardo@inifap.gob.mx).
3Campo Experimental Ixtacuaco-INIFAP. Carretera Martínez de la Torre-Tlapacoyan km 4.5, Martínez de la Torre, Veracruz. (rodriguez.jose@inifap.gob.mx).
4Facultad de Ciencias Agrícolas-Universidad Veracruzana-Campus Peñuela. Carretera Peñuela-Amatlán km 177, Córdoba, Veracruz. (pandres272@gmail.com).
5Campo Experimental Bajío-INIFAP. Carretera Celaya-San Miguel de Allende km 6.5, Celaya, Guanajuato. CP. 38000. (anaya.jose@inifap.gob.mx).
In the present investigation, the main additive effects and multiplicative interaction (AMMI) model was used to determine the yield and stability of 12 lines and two varieties of opaque black beans, evaluated during 2016 and 2017, in 10 environments of Veracruz and Chiapas, Mexico. The trial was established in experimental design random blocks with three repetitions and plots of three rows of 5 m in length. The grain yield was quantified, which was analyzed individually by environment and combined (environments-genotypes) of the 10 test environments, stability parameters were also estimated with the AMMI model. The Experimental Field Ixtacuaco and Rincon Grande, Veracruz, in autumn-winter 2016-2017 under residual humidity, were the environments that combined low interaction and high productivity, making them ideal for identifying genotypes with high and stable performance. Venustiano Carranza, Chiapas, in autumn-winter of 2016-2017, El Rubi, Veracrus, in winter-spring of 2017 with irrigation and New Mexico, Chiapas, in summer of 2016, in whitewashed acid soil, were the environments that more interacted with genotypes. The Jamapa Plus/XRAV-187-3-1-8 line showed the least interaction with the environment (much higher than that shown by the Negro Comapa and Negro Grijalva varieties), as well as high average yield (1 437.3 kg ha-1), while Jamapa Plus/XRAV-187-3-1-2, was the most profitable line (1 504.3 kg ha-1), but its adaptation was specific, mainly in environments with edaphic acid stress in the center from Chiapas and by terminal drought in the center of Veracruz.
Keywords: Phaseolus vulgaris L.; genotype-environment; interaction; improved lines
En la presente investigación se utilizó el modelo efectos principales aditivos e interacción multiplicativa (AMMI) para determinar el rendimiento y estabilidad de 12 líneas y dos variedades de frijol negro opaco, evaluadas durante 2016 y 2017, en 10 ambientes de Veracruz y Chiapas, México. El ensayo se estableció en diseño experimental bloques al azar con tres repeticiones y parcelas de tres surcos de 5 m de longitud. Se cuantificó el rendimiento de grano, el cual se analizó de manera individual por ambiente y combinada (ambientes-genotipos) de los 10 ambientes de prueba, también se estimaron los parámetros de estabilidad con el modelo AMMI. El Campo Experimental Ixtacuaco y Rincón Grande, Veracruz. en otoño-invierno de 2016-2017 bajo humedad residual, fueron los ambientes que combinaron baja interacción y alta productividad, por lo que son ideales para identificar genotipos con alto y estable rendimiento. Venustiano Carranza, Chiapas, en otoño-invierno de 2016-2017, El Rubí, Veracruz, en invierno-primavera de 2017 con riego y Nuevo México, Chiapas, en verano de 2016, en suelo ácido encalado, fueron los ambientes que más interaccionaron con los genotipos. La línea Jamapa Plus/XRAV-187-3-1-8, mostró la menor interacción con el ambiente (muy superior a las variedades Negro Comapa y Negro Grijalva), así como alto rendimiento (1 437.3 kg ha-1), mientras que, Jamapa Plus/XRAV-187-3-1-2, fue la línea más rendidora (1 504.3 kg ha-1), pero su adaptación fue específica, en los ambientes con estrés por acidez edáfica en el centro de Chiapas y por sequía terminal en el centro de Veracruz.
Palabras clave: Phaseolus vulgaris L.; genotipo-ambiente; interacción; líneas mejoradas
Introduction
In Veracruz and Chiapas, Mexico, during 2016, 150 784 hectares of opaque black grain beans were sown, tropical type (SIAP, 2018), which is the one with the highest commercial demand in the southeast region of Mexico, where 37.3 is produced % of this kind of beans in the country (Rodríguez et al., 2010; FIRA, 2016). The average yield in both entities is low (<650 kg ha-1) (SIAP, 2018), because the crop is affected by biotic and abiotic factors.
In the former, the incidence of diseases such as the golden yellow bean mosaic (BGYMV), the common bean mosaic (BCMV), rust [Uromyces appendiculatus var. appendiculatus (Pers.) Unger] and the angular spot [Pseudocercospora griseola (Sacc.) Ferraris] (López et al., 2006; Tosquy et al., 2012). While, in the abiotic, the most important are: the occurrence of intra-summer drought (which commonly occurs from July 20 to August 20), in the temporary plantings of the summer cycle and terminal drought, which frequently It occurs after the flowering of the crop, when the beans are established in conditions of residual humidity, in the autumn-winter cycle (Tosquy et al., 2017), as well as the planting of beans in low fertility soils, acidic and with high saturation of aluminum (Villar et al., 2003; Tosquy et al., 2008).
To contribute to solving the indicated problem, in the Cotaxtla Experimental Field Bean Improvement Program (CECOT) of the National Institute of Forestry, Agricultural and Livestock Research (INIFAP), lines of early and advanced generations of opaque black beans in nurseries are evaluated of adaptation and in regional tests of yield, that are conducted in different locations, humidity conditions and agricultural crop cycles, in the southeast of Mexico, in such a way, that it allows to identify the most outstanding ones by their performance, stability and adaptability and with agronomic characteristics superior to those of the varieties currently used (López et al., 2012).
To determine the stability of genotype performance, in the CECOT Bean Improvement Program, the univariate model proposed by Eberhart and Russell (1966) has been used, who propose as stability parameters, the regression coefficient (Bi) and the regression deviation (S2di), so a variety is considered stable, when Bi= 1 and S2di= 0, while other value considerations for these parameters indicate that genotypes are unstable.
In recent years, the multivariate AMMI (additive main effects and multiplicative interaction) model described by Crossa et al. (1990), because it is more suitable for estimating stability, because it allows describing and interpreting the effects of IGA (Gauch Jr. and Furnas, 1991; Brancourt-Hulmel and Lecomte, 2003), in addition to being more effective for characterize the response of genotypes in environments (Williams et al., 2010; Vargas et al., 2016). The results can be plotted in a double entry biplot (CP1 vs performance biplot), where both the main effects, as well as the interaction effects, for genotypes and environments are placed, which facilitates the interpretation of the IGA (Vallejo, 2005; López et al., 2015). The objective of this research work was to identify elite lines that exceed in yield and adaptation to different production environments, to two varieties that are grown in the states of Veracruz and Chiapas.
Materials and methods
The uniform trial included 12 elite lines selected for their performance, adaptation or tolerance to one or more of the limiting factors: acid soil, drought and diseases (Garrido et al., 2017; Ibarra et al., 2017), which were generated by the INIFAP National Bean Program (four from the Papaloapan/SEN-46 cross, five from the Citlali/XRAV-187-3 black cross and three from Jamapa Plus/XRAV-187-3). The Negro Grijalva and Negro Comapa varieties, released by INIFAP for tropical areas of southeastern Mexico, were used as witnesses due to their high yield potential, wide adaptation and disease tolerance (Villar et al., 2009; López et al., 2012).
The trial was established in three environments in the center of the state of Chiapas and seven environments in the state of Veracruz (four in the central zone, two in the southern zone and one in the north). The location of the experimental sites, the planting cycle and the environmental condition in which the test was conducted is shown in Table 1.
Table 1 Location and characteristics of experimental sites where the regional uniform performance test was conducted in Veracruz and Chiapas.
| Location | Municipality/state | Cycle/year | Environmental condition | Location (NL and WL) | Altitude (m) |
| Nuevo Mexico | Villaflores, Chis. | V / 2016 | V - Acid soil (pH>5.6)-CD | 16° 27’ y 93° 26’ | 660 |
| Nuevo Mexico | Villaflores, Chis. | V / 2016 | V - Acid soil (pH<4.4) | 16° 27´ y 93° 26’ | 660 |
| Carranza | Ocozocoautla, Chis. | OI / 2016-17 | Residual humidity | 16° 20’y 92° 35’ | 597 |
| Rincón Gde. | Orizaba, Ver. | OI / 2016-17 | Residual humidityl | 18° 51’ y 97° 06’ | 1 248 |
| El Rubi | Medellin, Ver. | OI / 2016-17 | Residual humidity | 18° 55´ y 96° 11’ | 22 |
| ITA-JRC | Rodriguez Clara, Ver. | OI / 2016-17 | HR- acid soil (pH >6.1)-CD | 18° 01’ y 95° 24’ | 133 |
| ITA-JRC | Rodriguez Clara, Ver. | OI / 2016-17 | HR- acid soil (pH <4.7) | 18° 01’ y 95° 24’ | 133 |
| CEIXTA | Tlapacoyan, Ver. | OI / 2016-17 | Residual humidity | 20° 02’ y 97º 05’ | 88 |
| El Rubi | Medellin, Ver. | IP / 2017 | Irrigation during the cycle | 18° 55’ y 96° 11’ | 22 |
| El Rubi | Medellin, Ver. | IP / 2017 | Terminal drought | 18° 55’ y 96° 11’ | 22 |
ITA-JRC= Agricultural Technology Institute of Juan Rodriguez Clara. CEIXTA= Experimental Field Ixtacuaco. S= summer cycle. AW= autumn-winter cycle. WS= winter-spring cycle. T= temporary. HR= residual humidity. CD= with dolomite application.
The genotypes were sown at a density of 250 000 plants ha-1, in experimental design randomized complete blocks with three replications and plots of three rows of 5 m in length, where the useful plot corresponded to the complete central groove. All genotypes are of habit of indeterminate growth, type II, of bushy and erect plants (Singh, 1982).
In one of the two trials of the New Mexico city, Chis., established in the summer cycle of 2016 and another of the Technological Institute of Juan Rodríguez Clara (ITA-JRC), Ver., in autumn-winter of 2016-17, before sowing 2 and 2.5 t ha-1 of dolomite lime were applied to the soil, respectively, to reach a pH that is within the optimum range of 5.5 to 7.5 and thus obtain an adequate development of the bean plants (Arias et al., 2007; Ruiz et al., 2013), the other two trials established in both locations were conducted under natural conditions of acid soil stress.
In El Rubi, Veracruz, in winter-spring of 2017, one trial was conducted with irrigation throughout the bean phenological cycle and the other with irrigation suspension, from the reproductive stage of the crop (terminal drought). It should be noted that during the conduct of the field trials there was no incidence of diseases that will affect bean yield, which was estimated in kilograms per hectare at 14% humidity.
The grain yield data were analyzed individually and in combination (genotype environments) of the 10 test environments. In cases where significance was detected, for the separation of averages the test was applied based on the significant minimum difference (DMS, α= 0.05). Likewise, the main additive effects and multiplicative interaction (AMMI) model was used to classify the environments and identify outstanding genotypes for their grain yield and less interaction with the environment (Gauch and Zobel, 1996).
For the analysis of variance and stability parameters, the SAS computer program (SAS Institute, 1999) was used and in the development of the AMMI analysis the recommendations of Vargas and Crossa (2000) were followed.
Results and discussion
Grain yield
According to the combined analysis, the performance varied significantly (p≤ 0.01) between environments, genotypes and in the interaction of both factors. Table 2 shows that, in Carranza, Chiapas, autumn-winter cycle of 2016-2017, under residual humidity conditions (A3), the highest average yield was obtained, which was significantly higher than the rest of the environments.
Table 2 Grain yield (kg ha-1) of black bean genotypes evaluated in 10 environments of Veracruz and Chiapas, Mexico. Summer cycles of 2016, autumn-winter of 2016-2017 and winter-spring of 2017.
T |
Genotype |
Test environments |
|||||
|
|||||||
G1 |
Papaloapan/SEN 46-3-7 |
2 116 * |
1 120 |
1 379 |
2 097 * |
1 367 |
|
G2 |
Papaloapan/SEN 46-6-6 |
1 403 |
1 004 |
1 449 |
1 952 * |
1 097 |
|
G3 |
Papaloapan/SEN 46-7-7 |
1 973 * |
560 |
1 538 |
1 693 |
1 518 |
|
G4 |
Papaloapan/SEN 46-7-11 |
1 181 |
848 |
2 357 * |
1 980 * |
1 713 * |
|
G5 |
N Citlali/XRAV-187-3-1-6 |
1 905 |
1 007 |
2 096 * |
1 238 |
1 580 * |
|
G6 |
N Citlali/XRAV-187-3-1-8 |
1 655 |
1 068 |
2 409 * |
1 298 |
1 742 * |
|
G7 |
N Citlali/XRAV-187-3-14-6 |
1 748 |
1 068 |
1 872 |
1 720 * |
1 260 |
|
G8 |
N Citlali/XRAV-187-3-14-7 |
1 401 |
568 |
2 420 * |
1 438 |
1 548 * |
|
G9 |
N Citlali/XRAV-187-3-16-7 |
1 343 |
1 335 * |
1 378 |
1 368 |
1 368 |
|
G10 |
Jamapa Plus/XRAV-187-3-1-8 |
1 615 |
1 231 |
2 586 * |
1 447 |
1 460 |
|
G11 |
Jamapa Plus/XRAV-187-3-1-2 |
2 276 * |
1 304 * |
1 692 |
1 505 |
1 660 * |
|
G12 |
Jamapa PlusX/RAV-187-3-4-4 |
1 144 |
1 071 |
2 159 * |
1 563 |
1 887 * |
|
G13 |
Negro Comapa |
1 876 |
1 484 * |
2 387 * |
1 480 |
1 270 |
|
G14 |
Negro Grijalva |
1 863 |
1 324 * |
2 038 |
1 469 |
1 450 |
|
|
Average |
1 678 b |
1 071 c |
1 983 a |
1 589 b |
1 494 b |
|
|
ANVA |
** |
** |
** |
* |
** |
|
|
CV (%) |
12.52 |
13.67 |
15.10 |
19.60 |
14.35 |
|
|
DMS (0.05) |
352.8 |
245.7 |
502.7 |
522.8 |
360.0 |
|
|
|
Promedio |
|||||
G1 |
Papaloapan/SEN 46-3-7 |
598 |
482 |
1 755 * |
1 328 |
1 094 |
1 333.5 abcde |
G2 |
Papaloapan/SEN 46-6-6 |
693 |
505 |
1 645 * |
1 146 |
729 |
1 162.2 e |
G3 |
Papaloapan/SEN 46-7-7 |
653 |
394 |
1 603 |
1 276 |
820 |
1 202.8 de |
G4 |
Papaloapan/SEN 46-7-11 |
582 |
396 |
1 609 |
1 203 |
594 |
1 246.4 bcde |
G5 |
N Citlali/XRAV-187-3-1-6 |
633 |
455 |
1 729 * |
1 302 |
1 080 |
1 302.6 abcde |
G6 |
N Citlali/XRAV-187-3-1-8 |
911 * |
706 * |
1 876 * |
1 250 |
859 |
1 377.5 abcde |
G7 |
N Citlali/XRAV-187-3-14-6 |
627 |
442 |
1 375 |
1 031 |
573 |
1 171.6 e |
G8 |
N Citlali/XRAV-187-3-14-7 |
689 |
480 |
1 538 |
1 297 |
838 |
1221.7 cde |
G9 |
N Citlali/XRAV-187-3-16-7 |
576 |
369 |
1 473 |
1 318 |
922 |
1 144.9 e |
G10 |
Jamapa Plus/XRAV-187-3-1-8 |
603 |
481 |
1 775 * |
1 974 * |
1 203 |
1 437.3 abcd |
G11 |
Jamapa Plus/XRAV-187-3-1-2 |
715 |
475 |
1 609 |
2 271 * |
1 536 * |
1 504.3 a |
G12 |
Jamapa PlusX/RAV-187-3-4-4 |
767 |
576 |
1 759 * |
1 703 |
963 |
1 359.3 abcde |
G13 |
Negro Comapa |
661 |
512 |
1 444 |
1 964 * |
1 385 * |
1 446.2 abc |
G14 |
Negro Grijalva |
639 |
459 |
1 724 * |
2 307 * |
1 437 * |
1 471 ab |
|
Average |
668 d |
481 d |
1 637 b |
1 526 b |
1 002 c |
1 312.9 |
|
ANVA |
** |
** |
** |
** |
** |
** |
|
CV (%) |
11.08 |
11.77 |
8.75 |
20.04 |
16.29 |
16.36 |
|
DMS (0.05) |
124.2 |
94.9 |
240.3 |
513.4 |
274.1 |
238.7 |
T= treatment (genotype); G= genotype; A= environment; A1= New Mexico, Villaflores, Chiapas, with dolomite; A2= New Mexico, Villaflores, Chiapas, without dolomite; A3= Carranza, Ocozocoautla, Chiapas; A4= Rincón Grande, Orizaba, Veracruz; A5= El Rubi, Medellin, Veracruz; A6= Rodríguez Clara, Veracruz, with dolomite; A7= Rodríguez Clara, Veracruz, without dolomite; A8= CEIXTA, Tlapacoyan, Veracruz; A9= El Rubi, Medellin, Veracruz, irrigation; A10= El Rubi, Medellin, Veracruz, drought; *= statistically superior genotypes, according to the minimum significant difference (DMS, 0.05). Averages of environments and genotypes with the same letters in the row and column, respectively, are statistically similar according to the DMS test, 0.05.
The highest average yield obtained in this locality, was mainly due to the fact that the crop had adequate humidity during its development cycle (568 mm of rainfall in total), without occurrence of periods of terminal drought. In turn, in the environments of New Mexico, Chiapas, summer cycle 2016, under conditions of whitewashed acid soil (A1), CEIXTA, Veracruz (A8) and Rincón Grande, Veracruz (A4), both in autumn-winter of 2016-2017 with residual humidity, as well as in El Rubi, Veracruz, in winter-spring of 2017 under irrigation conditions (A9) and in autumn-winter of 2016-17 with residual humidity (A5), also high average yields were obtained, because in all cases, the humidity conditions for the development of the beans were adequate (more than 320 mm of water during the cycle, of which about 150 mm were provided through the application of irrigation or received for the rains that occurred during the reproductive stage of the crop). For an adequate development and yield of the bean crop, at least 300 mm of rainfall are well distributed during its phenological cycle, 50 to 90 mm being convenient, from flowering to pod filling (Acosta et al., 2009; Ruiz et al., 2013).
On the contrary, the lowest average yields were obtained at the Agricultural Technology Institute of Juan Rodríguez Clara (ITA-JRC), Veracruz, in autumn-winter 2016-17, in acid soil, with application of dolomite lime (A6) and without application of dolomite (A7) (Table 2). This was mainly due to the water stress suffered by bean plants during their phenological cycle, since in the experimental site where both trials were conducted, there was a rainfall of the sowing until the harvest of 150.4 mm, of which only 24.4 mm precipitated during the reproductive phase of the crop, specifically the stages of pod formation when filling them, which limited the development of genotypes in both soil acid conditions. The lack of moisture during flowering, the formation of pods and their filling, causes a significant decrease in grain yield, due to a reduction in the number of pods per plant and a poor filling of pods (Acosta et al., 2009).
The same table shows that; through the evaluation environments, Jamapa Plus/XRAV-187-3-1-2, was the most productive line, whose average grain yield was statistically similar to that of five other lines and the control varieties, Negro Comapa and Negro Grijalva This same line, together with Negro Citlali/XRAV-187-3-1-8, obtained a significantly outstanding grain yield in five of the 10 test environments. Negro Citlali/XRAV-187-3-1-8, ranked first in performance in the environments of CEIXTA, Veracruz, in autumn-winter 2016-17, as well as in the ITA-JRC, Veracruz, in the same agricultural cycle, in acid soil, with and without application of dolomite lime, where it was the one with the highest productive efficiency (Tosquy et al., 2018). Meanwhile, Jamapa Plus/XRAV-187-3-1-2 was located first in the environments of New Mexico, Chiapas, in summer 2016, in whitewashed acid soil, and in El Rubi, Veracruz, in winter-spring 2017, with irrigation suspension at the beginning of the reproductive stage of the crop, where it showed greater tolerance to terminal drought and productive efficiency (with irrigation and drought), than the Negro Comapa and Negro Grijalva varieties (Ibarra et al., 2018).
AMMI analysis
According to the AMMI analysis, highly significant variability was detected in the first five main components, which accumulated 96.1% in the explanation of the variance, of these five, the first three were the most important in the representation of the IGA, since they explained 81.9% of the sum of squares. According to Pereira et al. (2009), the first three main components of this analysis should explain more than 60%, to be considered sufficient and at least 70% satisfactory.
This model allowed us to identify three groups of relatively homogeneous and well-defined environments, based on their average performance and their interaction with genotypes (Williams et al., 2010). The first group included three environments from Veracruz: El CEIXTA (A8), Rincón Grande (A4) and El Rubi (A5), all of them are similar in crop cycle (AW 2016-17) and humidity condition (residual moisture with adequate distribution of rainfall). These environments combined high average grain yield, significantly higher than the general average of 1 312 kg ha-1 and low interaction with genotypes (CP 1= -6.4547, -7.9732 and -11.2433) (Table 3, Figure 1). These two characteristics, in the process of genetic improvement, make them ideal for identifying opaque black bean germplasm, with high and stable yield, for the northern areas and region of the High Mountains in the center of the state of Veracruz (López et al., 2015).
Table 3 Average yield of genotypes, environments and values of significant principal components.
| Type | Genotype/environment | Yield (kg ha-1) | CP 1 | CP 2 | CP 3 |
| G1 | Papaloapan/SEN 46-3-7 | 1 333.5 | 8.6001 | -20.7015 | 0.9565 |
| G10 | Jamapa Plus/XRAV-187-3-1-8 | 1 437.3 | 0.2246 | 16.4036 | -2.3564 |
| G11 | Jamapa Plus/XRAV-187-3-1-2 | 1 504.3 | 22.3616 | 2.5865 | 4.6737 |
| G12 | Jamapa PlusX/RAV-187-3-4-4 | 1 359.3 | -9.0003 | 7.5340 | -10.4285 |
| G13 | Negro Comapa (TR) | 1 446.2 | 9.7237 | 12.5242 | -2.7705 |
| G14 | Negro Grijalva (TR) | 1 471 | 15.4341 | 10.8310 | -3.9939 |
| G2 | Papaloapan/SEN 46-6-6 | 1 162.2 | -2.3531 | -16.2314 | -11.4931 |
| G3 | Papaloapan/SEN 46-7-7 | 1 202.8 | 1.0064 | -13.0445 | 12.9939 |
| G4 | Papaloapan/SEN 46-7-11 | 1 246.4 | -19.757 | -0.7866 | -7.2652 |
| G5 | N Citlali/XRAV-187-3-1-6 | 1 302.6 | -0.4576 | 2.8631 | 13.2464 |
| G6 | N Citlali/XRAV-187-3-1-8 | 1 377.5 | -12.615 | 5.0874 | 8.9055 |
| G7 | N Citlali/XRAV-187-3-14-6 | 1 171.6 | -5.1128 | -9.7054 | 1.7015 |
| G8 | N Citlali/XRAV-187-3-14-7 | 1 221.7 | -13.7884 | 7.4020 | 7.6905 |
| G9 | N Citlali/XRAV-187-3-16-7 | 1 144.9 | 5.7337 | -4.7624 | -11.8601 |
| A1 | Nuevo México, Villaflores, Chis., V 2016,T , acid soil - CD | 1 678.5 | 16.5182 | -11.5001 | 22.2422 |
| A10 | El Rubí, Medellín, Ver., IP 2017, terminal drought | 1 002.5 | 15.7745 | 6.2012 | 0.7924 |
| A2 | Nuevo México, Villaflores, Chis., V 2016,T , acid soil | 1 070.8 | 9.2583 | 0.7911 | -15.364 |
| A3 | Carranza, Ocozocoautla, Chis., OI 2016-17, HR | 1 982.8 | -21.6850 | 24.4266 | 5.4789 |
| A4 | Rincón Grande, Orizaba, Ver., OI 2016-17, HR | 1 589.2 | -7.9732 | -23.1999 | -11.4617 |
| A5 | El Rubí, Medellín, Ver., OI 2016-17, HR | 1 494.3 | -11.2433 | 0.8056 | 4.289 |
| A6 | ITA-JRC, Ver., OI 2016-17, HR , acid soil- CD | 667.6 | -7.0106 | -5.2081 | 1.0571 |
| A7 | ITA-JRC, Ver., OI 2016-17, HR , acid soil | 480.9 | -6.8706 | -4.7559 | -0.312 |
| A8 | CEIXTA, Tlapacoyan, Ver., OI 2016-17, HR | 1 636.7 | -6.4547 | -4.763 | 0.9338 |
| A9 | El Rubí, Medellín, Ver., IP 2017, irrigation | 1 526.4 | 19.6864 | 17.2024 | -7.6558 |
| Average | 1 312.9 |
CP= main component; G= genotype; A= environment; S= summer cycle; AW= autumn-winter cycle; WS= winter-spring cycle; T= temporary condition; HR= residual moisture condition; CD= with dolomite application; ITA-JRC= Agricultural Technology Institute of Juan Rodríguez Clara; CEIXTA= Experimental Field Ixtacuaco.
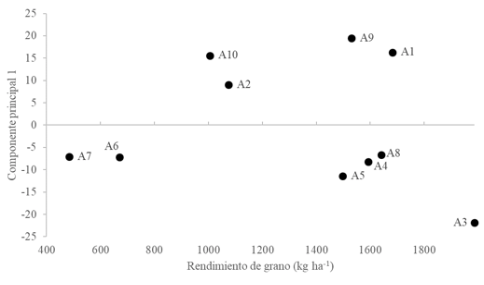
Figure 1 Main effects and interaction observed for 10 test environments. A1= New Mexico, Villaflores, Chiapas, with dolomite; A2= New Mexico, Villaflores, Chiapas, without dolomite; A3= Carranza, Ocozocoautla, Chiapas; A4= Rincón Grande, Orizaba, Veracruz; A5 = El Rubi, Medellín, Veracruz; A6= Rodríguez Clara, Veracruz, with dolomite; A7= Rodríguez Clara, Veracruz, without dolomite; A8= CEIXTA, Tlapacoyan, Veracruz; A9= El Rubi, Medellín, Veracruz, irrigation; A10= El Rubi, Medellín, Veracruz, drought.
The second group included two environments in the ITA-JRC, Veracruz, similar in crop cycle (AW 2016-17) and humidity condition (residual moisture with terminal drought) and different in soil management: one under soil conditions acid, without application of lime dolomite (A7) and another with application of lime dolomite (A6); both environments also showed reduced interaction with genotypes (CP 1= -6.8706 and -7.0106, respectively), but low average yield, much lower than the general average (Table 3, Figure 1). This behavior observed in both environments, is mainly attributed to the severity of water stress suffered by genotypes, which commonly occurs in that beans producing area (Morales et al., 2015), which did not allow them to express their potential for performance and that the differences between the vast majority of them were minimal.
The third group included three environments with adequate humidity during the crop cycle: Carranza, Chiapas, 2016-2017 AW cycle, with residual humidity (A3), El Rubi, Veracruz, 2017 WS cycle, with irrigation during the crop cycle (A9) and New Mexico, Chiapas, in the summer of 2016, under conditions of temporary and acid soil whitewashed with dolomite (A1), in which high average yield was observed and the highest interaction between the environment and genotypes (CP 1= -21.685, 19.6864 and 16.5182, respectively) (Table 3, Figure 1), this is mainly due to differences in the potential for performance and adaptation of genotypes in those evaluation environments, in which it was arranged of adequate humidity during crop development.
It should be noted that these three environments of high average performance, which are far from the axis of the ordinates (Figure 1) and that contributed more to the genotype-environment interaction, in certain cases, are suitable for bean production, if it has a genotype with specific adaptation to these environments (Acosta et al., 2012).
In relation to genotypes, two groups stood out: one formed with materials that showed very low interaction (close to zero) and therefore, a stable behavior (López et al., 2011), which includes the Jamapa line Plus/XRAV-187-3-1-8 (G10), which in addition to having obtained high average performance, showed the least interaction with the environment with a CP 1= 0.2246 (Table 3 and Figure 2), as well as at lines Negro Citlali/XRAV-187-3-1-6 (G5) and Papaloapan/SEN 46-7-7 (G3), which also showed reduced interaction with the environment (CP 1= -0.4576 and 1.0064, respectively), but their average yield was lower (Figure 2), these genotypes can be used in genetic improvement programs, for the generation of opaque black bean lines and varieties with wide adaptation. In the classification of genotypes for their stability, using the AMMI model, preferably those that are close to the axis of the ordinates should be selected, with CP 1 values equal to or close to zero (which are those that interact in a lesser degree with the environment) and show high grain yield (Vargas and Crossa 2000; Pereira et al., 2009).
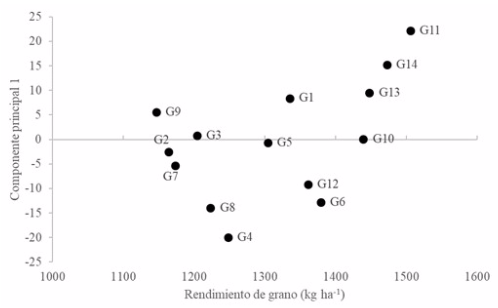
The other group consisted of three genotypes that presented high average yield but high interaction with the environment; This group includes the Jamapa Plus/XRAV-187-3-1-2 (G11) line, which was the most productive and the one that interacted most with the environment (CP 1= 22.33616) (Table 3, Figure 2). This line showed specific adaptation in environments, with and without abiotic stresses: due to acid soil, in New Mexico, Chiapas, And terminal drought, in El Rubi, Veracruz, conditions in which it obtained significantly outstanding grain yields, so in the future, it may represent an option for planting in this type of soil in the center of the state of Chiapas and in autumn-winter, under conditions of residual humidity, in the state of Veracruz, where the occurrence of drought during the reproductive stage of the crop (Tosquy et al., 2014). The other two genotypes were: Negro Grijalva (G14) with CP 1= 15.4341 and Negro Comapa (G13) with CP 1= 9.7237 (Table 3, Figure 2), these two varieties showed specific adaptation to irrigation conditions and terminal drought in El Rubi, Veracruz, and edaphic acidity in New Mexico, Chiapas; Negro Comapa also showed a significant response in grain yield, to the application of dolomite lime, in the latter environment. Specific adaptation in a given area is also desirable, if the genotype shows stability over years in that area and high grain yield (Acosta et al., 2012).
These results indicate that, the stability of the performance of the genotypes evaluated is not a function of the genetic heritage from which they come, since in general, materials that were derived from the same cross, showed differences in their performance potential and adaptation to the environments test.
Conclusions
The AMMI analysis allowed to identify genotypes based on their level of interaction with the environment and grain yield. The Jamapa Plus/XRAV-187-3-1-8 (G10) line was the one that showed the greatest stability in the evaluation environments (superior to that observed by the Negro Comapa and Negro Grijalva varieties), as well as high yield of grain, and therefore will be included in the validation process with cooperating farmers in the states of Veracruz and Chiapas. Meanwhile, the Jamapa Plus/XRAV-187-3-1-2 (G11) line was the one with the highest average performance and its adaptation was specific, so its use in the environments in which it obtained yields of significantly outstanding grain, mainly under conditions of acid soil in the center of the state of Chiapas and terminal drought in the center of the state of Veracruz.
Literatura citada
Acosta, D. E.; Acosta, G. J. A.; Trejo, L. C.; Padilla, R. J. S. and Amador, R. M. D. 2009. Adaptation traits in dry bean cultivars grown under drought stress. Agric. Téc. Méx. 35(4):416-425. [ Links ]
Acosta, G. J. A.; Espinoza, T. E.; Sánchez, G. B. M.; Jiménez, H. Y.; Salinas, P. R. A.; Rosales, R. S. R.; Zandate, H. R. y González, R. C. 2012. Adaptación del frijol tipo Flor de Junio a diferentes ambientes de México. Trop. Subtrop. Agroecosyst. 15(2):427-438. [ Links ]
Arias, R. J. H.; Rengifo, M. T. y Jaramillo, C. M. 2007. Manual técnico: buenas prácticas agrícolas en la producción de fríjol voluble. 1ª. ed. Corporación Colombiana de Investigación Agropecuaria (CORPOICA). Mejoramiento Alimentario y Nutricional de Antioquia (MANA). Organización de las Naciones Unidas para la Agricultura y la Alimentación (FAO). Medellin, Colombia. 170 p. [ Links ]
Brancourt-Hulmel, M. and Lecomte, C. 2003. Effect of environmental variates on genotype environment interaction of winter wheat: a comparison of biadditive factorial regression to AMMI. Crop Sci. 43(2):608-617. [ Links ]
Crossa, J.; Gauch, Jr., H. G. and Zobel, R. W. 1990. Additive main effects and multiplicative interaction analysis of two international maize cultivar trails. Crop Sci. 30(3):493-500. [ Links ]
Eberhart, S. A. and Russell, W. A. 1966. Stability parameters for comparing varieties. Crop Sci. 6(1):36-40. [ Links ]
FIRA. 2016. Fideicomiso Instituido con Relación a la Agricultura. Panorama agroalimentario. Dirección de Investigación y Evaluación Económica y Sectorial. Frijol 2016. FIRA. México. 36 p. [ Links ]
Gauch Jr., H. G. and Furnas, R. E. 1991. Statistical analysis of yield trails with MATMODEL. Agron. J. 83(5):916-920. [ Links ]
Gauch, H. G. and Zobel, R. W. 1996. AMMI analysis of yield trials. In: Kang, M. S. and Gauch, H. G. (eds.). Genotype-by-environment interaction. CRC Press. Boca Raton, FL, USA. 85-122 pp. [ Links ]
Ibarra, P. F. J.; Tosquy, V. O. H.; López, S. E.; Rodríguez, R. R.; Villar, S. B.; Anaya, L. J. L.; Garrido, R. E. and Zetina, L. R. 2018. Promising black-seeded common bean breeding lines resistant to BCMV, BCMNV and BGYMV with adaptation to terminal drought and acid soils of tropical southeastern Mexico. The LXI Ann. Rep. Bean Improv. Coop. 65-66 pp. [ Links ]
López, S. E.; Acosta, G. J. A.; Tosquy, V. O. H.; Salinas, P. R. A.; Sánchez, G. B. M.; Rosales, S. R.; González, R. C.; Moreno, G. T.; Villar, S. B.; Cortinas, E. H. M. y Zandate, H. R. 2011. Estabilidad de rendimiento en genotipos mesoamericanos de frijol de grano negro en México. Rev. Mex. Cienc. Agríc. 2(1):29-40. [ Links ]
López, S. E.; Tosquy, V. O. H.; Jiménez, H. Y.; Salinas, P. R. A.; Villar, S. B. y Acosta, G. J. A. 2012. Rendimiento y adaptación de la variedad de frijol Negro Comapa en dos regiones de México. Rev. Fitotec. Mex. 35(4):309-315. [ Links ]
López, S. E.; Tosquy, V. O. H.; Villar, S. B.; Acosta, G. J. A.; Rodríguez, R. J. R. y Meza, P. A. 2015. Rendimiento y estabilidad de líneas mejoradas de frijol negro en Veracruz y Chiapas, México. Rev. Fitotec. Mex. 38(2):173-181. [ Links ]
Morales, R. A.; López, C. C.; Kohashi, S. J.; Miranda, C. S. y García, E. A. 2015. Comparación de los componentes del rendimiento en variedades de frijol en condiciones de acidez y humedad residual del suelo en el sur de Veracruz. Terra Latinoam. 33(4):309-319. [ Links ]
Pereira, H. S.; Melo, L. C.; de Faria, L. C.; Díaz. J. L. C.; Del Peloso, M. J.; da Costa, J. G. C. and Wendland, A. 2009. Stability and adaptability of carioca common bean genotypes in states of the central South Region of Brazil. Crop Breed. Appl. Biotechnol. 9(2):181-188. [ Links ]
Rodríguez, L. G.; García, S. J. A.; Rebollar, R. S. y Cruz, C. A. C. 2010. Preferencias del consumidor de frijol (Phaseolus vulgaris L.) en México: factores y características que influyen en la decisión de compra diferenciada por tipo y variedad. Paradigma Económico. 2(1):121-145. [ Links ]
Ruiz, C. J. A.; Medina, G. G.; González, A. I. J.; Flores, L. H. E.; Ramírez, O. G.; Ortiz, T. C.; Byerly, M. K. F. y Martínez, P. R. A. 2013. Requerimientos agroecológicos de cultivos. 3ª. (Ed.). INIFAP. CIRPAC. Campo Experimental Centro Altos de Jalisco. Tepatitlán de Morelos, Jal., México. Libro técnico Núm. 3. 564 p. [ Links ]
SAS. 1999. Institute Statistical Analysis Systems. SAS/STAT user’s guide. Software versión 8.0. SAS Institute Inc. Cary, NC, USA. [ Links ]
SIAP. 2018. Servicio de Información Agroalimentaria y Pesquera. Avances de siembras y cosechas. Resumen por cultivo. SAGARPA. SIAP. Ciudad de México, México. http://infosiap.siap.gob.mx:8080/agricola-siap-gobmx/ResumenDelegacion.do. [ Links ]
Singh, S. P. 1982. A key for identification of different growth habits of Phaseolus vulgaris L. The XXV Ann. Rep. Bean Improv. Coop. 92-95 pp. [ Links ]
Tosquy, V. O. H.; López, S. E.; Esqueda, E. V. A.; Acosta, G. J. A.; Ugalde, A. F. J. y Villar, S. B. 2012. Rendimiento y reacción a enfermedades de genotipos de frijol en condiciones de temporal y humedad residual. Rev. Mex. Cienc. Agríc. 3(4):727-737. [ Links ]
Tosquy, V. O. H.; López, S. E.; Francisco, N. N.; Acosta, G. J. A y Villar, S. B. 2014. Genotipos de frijol negro opaco resistentes a sequía terminal. Rev. Mex. Cienc. Agríc. 5(7):1205-1217. [ Links ]
Tosquy, V. O. H.; López, S. E.; Zetina, L. R.; Ugalde, A. F. J.; Villar, S. B. y Cumpián, G. J. 2008. Selección de genotipos de frijol con adaptación a suelos ácidos. Terra Latinoam. 26(3):227-233. [ Links ]
Tosquy, V. O. H.; López, S. E.; Zetina, L. R.; Villar, S. B. y Rodríguez, R. J. R. 2017. Producción de genotipos de frijol negro en condiciones de humedad residual y sequía terminal. Terra Latinoam. 35(1):29-39. [ Links ]
Tosquy, V. O. H.; Zetina, L. R.; Ibarra, P. F. J. and López, S. E. 2018. Improved opaque black common bean gentopyes with adaptation to acid soils. The LXI Ann. Rep. Bean Improv. Coop. 207-208 pp. [ Links ]
Vallejo, C. F. A. 2005. Análisis estadístico para los diseños genéticos en fitomejoramiento. 1ª. ed. Universidad Nacional de Colombia. Palmira, Colombia. 249 p. [ Links ]
Vargas, E. E. A.; Vargas, S. J. E. y Baena, G. D. 2016. Análisis de estabilidad y adaptabilidad de híbridos de maíz de alta calidad proteica en diferentes zonas Agroecológicas de Colombia. Acta Agron. 65(1):72-79. doi: https://doi.org/10.15446/acag.v65n1.43417. [ Links ]
Vargas, H. M. y Crossa, J. 2000. El análisis AMMI y la gráfica del biplot en SAS. 1ª. (Ed.). Centro Internacional para el Mejoramiento de Maíz y Trigo (CIMMYT). México, D. F. 42 p. [ Links ]
Villar, S. B.; López, S. E. y Acosta, G. J. A. 2003. Selección de genotipos de frijol por rendimiento y resistencia al mosaico dorado y suelos ácidos. Rev. Fitotec. Mex. 26(2):109-114. [ Links ]
Villar, S. B.; López, S. E. y Tosquy, V. O. H. 2009. Negro Grijalva, nuevo cultivar de frijol para el trópico húmedo de México. Agric. Téc. Méx. 35(3):349-352. [ Links ]
Williams, A. H.; Pecina, Q. V.; Zavala, G. F.; Montes, G. N.; Gámez, V. A. J.; Arcos, C. G.; García, G. M. A.; Montes, H. S. y Alcalá, S. L. 2010. Modelo de Finlay y Wilkinson vs. el modelo AMMI para analizar la interacción genotipo-ambiente en sorgo. Rev. Fitotec. Mex. 33(2):117-123. [ Links ]
Received: May 01, 2019; Accepted: August 01, 2019
 Este es un artículo publicado en acceso abierto bajo una licencia
Creative Commons
Este es un artículo publicado en acceso abierto bajo una licencia
Creative Commons
