


Services on Demand
Journal
Article
 text in
  English (pdf)
 Article in xml format
 Article references
 Send this article by e-mail
Indicators
-
 Cited by SciELO
 -
 Access statistics
Related links
-
 Similars in
SciELO
Similars in
SciELO
Share

 Permalink
Revista mexicana de ciencias agrícolas
Print version ISSN 2007-0934
Rev. Mex. Cienc. Agríc vol.10 n.5 Texcoco Jun./Aug. 2019 Epub Mar 03, 2020
https://doi.org/10.29312/remexca.v10i5.572
Investigation note
Mapping of the value chain of tilapia in the state of Veracruz
1Departamento de Ciencias Económico Administrativas-Universidad Iberoamericana León. Blvd. Jorge Vértiz Campero 1640, Col. Cañada de Alfaro, León, Guanajuato, México. AP. 1-26. CP. 37238. Tel. 477 7100600, ext. 2619. (cristobal.hernandez@iberoleon.mx).
2Colegio de Postgraduados-Campus Veracruz. Carretera Federal Xalapa-Veracruz km 88.5, Tepetates, Manlio Fabio Altamirano, Veracruz, México. CP. 91690. Tel. 229 9207256. (aasiain@colpos.mx; parturo@colpos.mx; dplatas@colpos.mx).
3Colegio de Postgraduados-Campus Córdoba. Carretera Federal Córdoba-Veracruz km 348, Manuel León, Amatlán de los Reyes, Veracruz, México. CP. 94946. Tel. 271 7166000. (davalos@colpos.mx).
4Universidad del Mar-Campus Puerto Escondido-Ciudad Universitaria. Carretera Vía Sola de Vega-Puerto Escondido, San Pedro Mixtepec, Juquila, Oaxaca, México. CP. 71980. Tel. 954 5824990. (rebe@zicatela.umar.mx).
The objective of the present study was to map the productive chain of tilapia of the state of Veracruz, carried out during the months of July to September 2016. For this purpose, the study was carried out in two stages. In the first, the different actors of the production of tilapia in the links (raw materials, type of producers, process and commercialization) of the production chain were classified. In the second, the following aspects were determined: type of species, category of producers, level of production by category, form of commercialization, presentation of the product, added value, markets for purchase and sale and problems for the sale of the final product. The results of the first stage of the study determined that the main inputs are imported and the market of greater importance is local. Likewise, the producers were classified according to their production (self-consumption, semi-commercial and commercial) and the market they are targeting (self-consumption, local and regional). In the second stage of the investigation it was found that the most representative species is tilapia and its sale is on foot of the farm with an intrinsic value added being the markets of sale more representative those of the big cities. It is concluded that by means of the schematization of the productive chain of tilapia of the state of Veracruz, the main inputs are imported, which must be replaced by national supply and technologies.
Keywords: aquaculture; competitiveness; market access
El objetivo del presente estudio fue mapear la cadena productiva de tilapia del estado de Veracruz, realizado durante los meses de julio a septiembre de 2016. Para tal efecto, el estudio se realizó en dos etapas. En la primera se efectuó la clasificación de los diferentes actores de la producción de tilapia en los eslabones (materias primas, tipología de productores, proceso y comercialización) de la cadena productiva. En la segunda fueron determinados los siguientes aspectos: tipo de especie, categoría de productores, nivel de producción por categoría, forma de comercialización, presentación del producto, valor agregado, mercados para compraventa y problemáticas para la venta del producto final. Los resultados de la primera etapa del estudio determinaron que los principales insumos son importados y el mercado de mayor importancia es el local. Asimismo, los productores fueron tipificados acorde a su producción (autoconsumo, semi-comercial y comercial) y al mercado que se dirigen (autoconsumo, local y regional). En la segunda etapa de la investigación se encontró que la especie más representativa es la tilapia y su venta es a pie de granja con un valor agregado intrínseco siendo los mercados de compraventa más representativos los de las grandes ciudades. Se concluye que mediante la esquematización de la cadena productiva de la tilapia del estado de Veracruz los principales insumos son importados los cuales deben ser sustituidos por proveeduría y tecnologías nacionales.
Palabras claves: acceso a mercados; acuicultura; competitividad
Tilapia is one of the species with the highest demand in the market in Mexico. The consumption of this species was close to 200 thousand t according to the Ministry of Agriculture, Livestock, Rural Development, Fisheries and Food (SAGARPA). (Basualdo-Ramírez et al., 2012). However, there has been a deficit because consumption is derived from imports and not from national production. In this sense, in 2014, an approximate production of 75 000 t was registered, which positioned Mexico as the second importer of tilapia worldwide (CONACYT, 2014). Hernández-Arzaba et al. (2015a) mentioned that fish consumption in Mexico was low (12 kg per capita) compared to the global average (20 kg per capita).
Although the per capita consumption in Mexico is low, the producers did not manage to cover the domestic market demand, estimated at 240 000 t, for which around 150 000 t of Asian countries were supplied. This same scenario also occurred in the state of Veracruz, where 4 000 t were consumed, of which 2 600 t were produced locally (Hernández-Arzaba et al., 2015b).
The aforementioned consumer market is marketed depending on its origin. The frozen tilapia imported is distributed through large traders (example: restaurant chains and supermarkets). In contrast, local producers’ market fresh tilapia in local markets and restaurants. Currently local tilapia producers are conglomerates due to low labor costs and access to natural resources; however, they are considered of low relevance due to the scarce technology, competitiveness and market penetration (Porter, 2003). In view of this situation, the local aquaculture production of Veracruz has a commercial challenge and the integration of the value chain. That is why it is necessary to map the value chain of tilapia in order to diagnose areas of opportunity for the generation of public policies. For all the above, the objective of this study was to map the productive chain of tilapia from the state of Veracruz.
The geographic area of coverage of this study was carried out in the physiographic regions named Totonaca, Nautla, Capital, Sotavento, Montañas, Papaloapan and Los Tuxtlas of the state of Veracruz. The study was carried out during the months of June to September 2016. In the first stage, the different actors of tilapia production were classified in the links of the productive chain. This chain was formed by the following four links: 1) raw materials; 2) type of producers according to their production and target market; 3) process; and 4) marketing.
For this purpose, information was obtained from 814 producers included in the aquaculture census of the state of Veracruz 2010. In the second stage, descriptive statistics were obtained in the following aspects: type of species, category of producers, level of production by category, form of marketing, presentation of the product, added value, markets for purchase and sale and problems for the sale of the final product. The aforementioned aspects were represented by pie charts showing the percentage.
Discussion
There is a large area of opportunity for local producers to promote and optimize their marketing channels in their local markets through innovative strategies such as: live tilapia sales outlets, sale in self-service stores (packed fillets) and in fast food trucks. This already has a proven acceptance of the final consumer, despite paying a premium for this service and the freshness of the fish. To achieve the above, it is necessary to train and empower aquaculturists in these issues, optimize government programs to support the aquaculture industry and promote the consumption of tilapia with added value. Producers should not seek to compete with import markets, but rather develop a new market niche to achieve positioning. In addition, they must venture into added value such as smoking, filleting, selling by-products such as skin (for medical and tannery applications).
Fitzsimmons (2004) postulated in 2002, that tilapia would be the key factor for aquaculture in the present century due to its easy handling and genetic potential; and acceptance in the saucer of the large global markets. In this regard, Mexico went from being the second producer of tilapia in the world in 2002 to 2nd place as importer of tilapia now, only after the United States of America.
Analysis of the value chain
Figure 1 shows the schematization of the productive chain of tilapia in Veracruz showing its links, as well as the different markets to which they belong. Next, each of the links is described.

Supply and destination markets according to their origin. Elaboration with data of the aquaculture ordinance 2010 (Reta and Asiain, 2010).
Figure 1 Mapping of the value chain of tilapia in Veracruz.
Link 1: raw materials. This link is made up of suppliers, mostly importing inputs (example: food and technology). This effect can be minimized through the creation of networks of local suppliers that generate diets based on the availability of regional raw materials and their own innovations. Aquaculture is dependent on variables of global financial markets (peso/dollar exchange rate, free trade agreements, among others).
The supply of fingerlings has been developed in Veracruz, but its offer is still very restricted. It is necessary to develop this chain of inputs with the selection of the best genetic material, making the offspring more resistant and with a higher percentage of meat (CONACYT, 2014). Another of the innovations that some research centers have been developing, such as the Technological Institute of Boca del Río in Veracruz (ITBOCA), have contributed to the creation of super macho that allows to avoid the process of sexual reversion up to 80%.
Link 2: type of producers. In the Table 1 shows the typology of producers based on their production and the target market and each category is described below:
Table 1 Characterization of tilapia producers from the state of Veracruz, based on the scale of production.
|
Category |
Production |
Producers |
Annual production |
Destination market |
|||
|
Number |
(%) |
t |
(%) |
||||
|
Self-consumption |
(<720 kg year-1) |
333 |
53.97 |
74.5 |
4.63 |
Self-consumption |
|
|
Semi-commercial |
(720-10 000 kg year-1) |
252 |
40.84 |
712 |
44.26 |
Local |
|
|
Commercial |
(>10 t year-1) |
32 |
5.19 |
822 |
51.1 |
Regional/state |
|
|
Total |
617 |
100 |
1608.5 |
100 |
|||
Elaboration with data of the aquaculture ordinance of the state of Veracruz 2010.
Self-consumption
It includes aquaculturists with total annual production of less than 720 kg year-1; that is, an average of 2 kg day-1 of consumption; so, it is inferred that their destiny is for themselves. These producers represent 54% of the tilapia farms, more than half of the most important aquaculture activity in the state (72.5% tilapia). The values shown above indicate that the consumption of tilapia in Mexico is below the levels presented in Asian countries, since they have a per capita consumption that exceeds 20 kg and in Mexico barely exceeds the barrier of 10 kg. Tilapia is the species with the greatest presence in the state of Veracruz (Table 1).
The most representative species of aquaculture in Veracruz is tilapia since it represents almost 75% of the farms, followed by trout with a little more than 20%, with almost 4% the ornamental fish and other species such as the oyster, snail and shrimp (Figure 2a).

Elaboration with data of the aquaculture ordinance of the state of Veracruz (2010).
Figure 2 a) species by common name; b) producers by category; c) production by category; and d) form of commercialization.
The producers of self-consumption represent more than 50%, but they contribute 4.6% of the total annual production. This group of producers contribute to food security, although they do not solve it, given that they do not create microeconomic dynamics in their area of influence. Therefore, it is important to develop public policies to encourage the support of this activity for the construction of a food security pyramid, an alternate supply of animal protein, a balanced diet, and a primary triggering activity in local economies. This can be done through the provision of information programs, training extension to producers with the aim of making more efficient self-consumption farms with available resources and thus have surpluses that are destined to the market.
Semi-commercial
This type of growers are the predominant ones in the production of tilapia in Veracruz, they are almost in balance according to the percentage of producers and the production they provide; presenting a ratio of 1.08 (number of farms/productive capacity) as shown in Table 2.
Table 2 Financial reason for tilapia producers
|
Variable |
Producers (%) |
Production (%) |
Ratio |
|
Self-consumption |
53.97 |
4.63 |
0.09 |
|
Semi-commercial |
40.84 |
44.26 |
1.08 |
|
Commercial |
5.19 |
51.1 |
9.85 |
Elaboration with data of the aquaculture ordinance of the state of Veracruz 2010.
Additionally, this category produces surpluses that can be commercialized and that develop economic dynamics given that they are on the production possibilities frontier, (FPP). It was also observed that this category has access to local markets, the owner of the farm self-employed and at least one day laborer with a tendency to family participation.
Commercial
This category achieves a production of tilapia greater than 10 tons per year and is classified within the area of MSMEs. They represent a small group of producers, only 5.19% of the total (Figure 2b). However, their production capacity is important because with 5% of farms they contribute more than half of the annual production (51.1%) as shown in Figure 2c.
The commercial sector has well defined that the production of tilapia is a profitable business, its market is regional, state and in a few cases interstate or for export purposes. To strengthen this category, it must be consolidated in the short and medium term, developing a market without competing with Asian imports. Subsequently, diversify and give added value to be competitive in the medium and long term. In the long term, it should consider the option of exporting and covering the national demand for tilapia, which will allow the start of a competitive market for quality and freshness.
Due to the growing demand for fish, this category can seek strategic alliances with the semi-commercial category to increase its productive capacity. The commercial category can provide techniques and requirements of standardization of the desired product to the semi-commercial sector, as well as offer purchase by volume. In contrast, the self-consumption sector can obtain knowledge for a better management and technification of the farm aspiring to potentiate its production and commercialization.
Link 3 and 4. Process and marketing
In Figure 2d, it can be observed that commercialization at the farm level predominates (89.7%) over the rest of the sale forms. The participation in the local market is representative (95.42%), with almost no participation in regional and national markets. The above data can be derived due to the lack of infrastructure and maintenance of the existing one, transport costs and the lack of business management skills.
Based on the information presented in Figure 3a, it can be observed that the highest consumption is based at the farm level: live or fresh. This type of presentation can be considered as an added value that presents quality and freshness of the product. However, the lack of commercial expansion may be due to the lack of investment and infrastructure in cold chains.

Figure 3 a) presentation of the product; b) added value of the product; c) main markets for sale clearly detected; and d) main market (for purchase).
Regarding the aggregation of value to the product (Figure 3b), 82.34% of the producers do not give added value. This type of response justifies the implementation of practices (training in the presentation of the product, other forms of sale, among others) to increase the income of the fish farmers. Whereas the average price of live and aligned tilapia is $41.48 kg; the types of added value are first when the fish farmers transforms his production into a dish in his restaurant, in the form of fillets without/with packing, and smoked.
In the Figure 3c shows that the predominant markets for sale are Xico (21%), Alvarado (8%), Veracruz (8%), Xalapa (8%) and Mexico City (7%), which together represent more than half of the market (51%). This may be due to the fact that the first four cities are part of the two largest metropolitan areas of the state of Veracruz and in the case of Mexico City, it is the country's highest consumption market.
On the other hand, in Figure 3d, the buying markets are represented by Xalapa (11.57%), Cd. Cardel (7.65%), Cuitlahuac (6.47%), Cordoba (6.08%), Veracruz (5.69%), Xico (5.29%) and Orizaba (4.51%), adding almost half of this market (47.26%). This may be due to the fact that these populations belong to three of the largest metropolitan areas in the state of Veracruz.
In Figure 4a, it was observed that more than 91% of the interviewees do not have problems in the commercialization, so it is assumed that the tilapia is a product that sells itself, but the lack of access to markets must be the company of the government sector, improving and creating infrastructure.
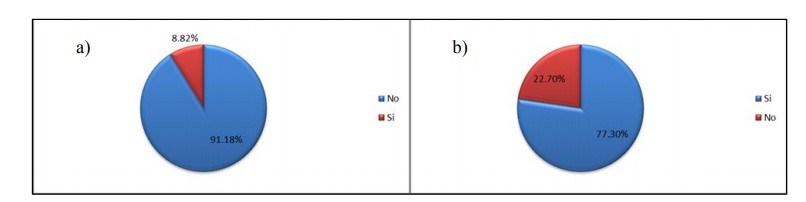
Figure 4 a) do you have problems selling your product? and b) would you be interested in joining an integrating company?
Finally, in Figure 4b it was observed that 77.3% of the fish farmers have an interest in belonging to an integrating company, this may be due to the benefits of the producer unions (for example: share knowledge of management and production, commercialize by volume and lower input costs for wholesale purchases, among others).
However, the remaining 22.7% answered no, this may be due to the corruption of the leaders, the malfunctioning of the product-systems, as well as the idiosyncrasy and culture of the producer.
Conclusions
In the through the schematization of the productive chain of tilapia of the state of Veracruz, the main inputs are imported, which must be replaced by national supplies and technologies. In the same way, the typology of the fish farmers according to their production showed that they must be trained in the management and marketing of their products. Also that producers do not have a diversification of the added value of their products, inhibiting their access to the local and regional market. The fish farmers do not promote the consumption of their own products, while the government makes a superficial propaganda. Finally, it is recommended that government support be channeled to the most predominant aquaculture crops and to commercial producers.
Literatura citada
CONACYT. 2014. Consejo Nacional de Ciencia y Tecnología. Agencia Informativa. Diseñan modelo integral para la producción de tilapias. http://www.conacytprensa.mx/index.php/ ciencia/mundo-vivo/591-produccion-de-tilapias. [ Links ]
Basualdo-Ramírez, L. J.; Jiménez-Guzmán, F.; Jiménez-Saavedra, A. C.; Macal-Niño, F. J.; Basualdo-Ramírez, E. A. M.; Montaño-Aguilar, D. M. A. y Gutiérrez, U. E. 2012. Criterios técnicos y económicos para la producción sustentable de tilapia en México. https://www.conapesca.gob.mx/work/sites/cona/dgof/publicaciones/CriteriosTecnicosEconomicosTilapiaEnMexico.pdf. [ Links ]
Fitzsimmons, K. 2004. Producción y mercado internacional de tilapia. In: International symposia on tilapia in aquaculture. Septiembre. Manila, Filipinas. 133-149 pp. [ Links ]
Hernández-Arzaba, J. C.; Platas-Rosado, D. E.; González-Reynoso, L.; Preza-Lagunes, L. y Torres-Tadeo, C. M. 2015a. Mapeo en la cadena de comercialización/consumo de tilapia en Veracruz. In:I Reunión Internacional Científica y Tecnológica. Veracruz, México. 107-115 pp. [ Links ]
Hernández-Arzaba, J. C.; Platas-Rosado, D. E.; González-Reynoso, L.; Preza-Lagunes, L. y Torres-Tadeo, C. M. 2015b. Evidenciando el desarrollo de la acuacultura. Mapeo en la cadena de valor de tilapia en México. En P. Pérez (Presidencia), XLII Reunión Científica de la Asociación Mexicana para la Producción Animal y Seguridad Alimentaria A. C. Reunión llevada a cabo en Montecillo, Texcoco, Estado de México. [ Links ]
Porter, M. E. 2003. The economic performance of regions. Regional Studies. 37(6-7):549-578. doi: 10.1080/0034340032000108688. [ Links ]
Reta-Mendiola, J. L. y Asiain-Hoyos, A. 2010. Ordenamiento acuícola del estado de Veracruz. SAGARPA/CONAPESCA/Colegio de Postgraduados. 26 p. [ Links ]
Received: June 01, 2019; Accepted: July 01, 2019
 Este es un artículo publicado en acceso abierto bajo una licencia Creative Commons
