


Services on Demand
Journal
Article
 text in
  English (pdf)
 Article in xml format
 Article references
 Send this article by e-mail
Indicators
-
 Cited by SciELO
 -
 Access statistics
Related links
-
 Similars in
SciELO
Similars in
SciELO
Share

 Permalink
Revista mexicana de ciencias agrícolas
Print version ISSN 2007-0934
Rev. Mex. Cienc. Agríc vol.10 n.5 Texcoco Jun./Aug. 2019 Epub Mar 03, 2020
https://doi.org/10.29312/remexca.v10i5.1606
Articles
Characterization and grouping of barleys beardless using infrared sensors and forage yield
1 Facultad de Ciencias Biológicas-Universidad Autónoma de Nuevo León. Ave. Pedro de Alba s/n cruz con Ave. Manuel L. Barragán, San Nicolás de los Garza, Nuevo León, México. (atorres-tapia@hotmail.com; rahim.forough@gmail.com; nheyamaginot@yahoo.fr).
2 Departamento de Fitomejoramiento-Universidad Autónoma Agraria Antonio Narro. Calzada Antonio Narro 1923, Col. Buenavista, Saltillo, Coahuila. México. CP. 25315. (modesto.colin@uaaan.mx).
In the northeast of Mexico, it is necessary to have varieties of barley adapted to extreme climates as an alternative in forage production. For the estimation of biomass, there are remote infrared sensors that have not been applied in forage barley. The objectives were to characterize, group and select lines of barley forage beardless, and estimate the association of sensors with performance. 45 lines against commercial varieties were evaluated in two municipalities of the state of Coahuila, during autumn-winter 2016-17; an alpha-lattice design with three replications was carried out, forage yield, plant height, phenological stage was determined, and an infrared sensor was an IP-54 thermometer, a GreenSeekerTM for standardized differential vegetation index (NDVI) and a SPAD-420 for chlorophyll content; evaluating in two samplings. An analysis was made subdivided plots for variables, correlations for relationship estimation and a multivariate analysis by sampling. The results indicated highly significant differences in yield between genotypes, localities and interactions. Lines 6, 43, 44, 40 and 1 presented desirable forage production characteristics. The analysis of conglomerates at 75 and 90 dds retained five and seven interest groups respectively, marking differences between groups in the T2 test, forming different groups in commercial varieties and lines. A positive and significant association between NDVI and yield was not detected for the genotypes studied. The multivariate methods were useful tools to select fast production forage lines. Affirming the barleys as a good option for fodder production in winter times in semi-arid zones, compared to oats and wheat.
Keywords: barley without edge; dry matter yield; NDVI
En el noreste de México es necesario tener variedades de cebada adaptadas a climas extremos como alternativa en la producción de forraje. Para la estimación de biomasa, existen sensores infrarrojos remotos que no han sido aplicados en cebadas forrajeras. Los objetivos fueron caracterizar, agrupar y seleccionar líneas de cebada forrajera imberbe, y estimar la asociación de sensores con el rendimiento. Se evaluaron 45 líneas contra variedades comerciales en dos municipios del estado de Coahuila, durante el otoño-invierno 2016-17; se realizó un diseño alfa-látice con tres repeticiones, se determinó rendimiento de forraje, altura de planta, etapa fenológica, y como sensores infrarrojos un termómetro IP-54, un GreenSeekerTM para índice de vegetación diferencial normalizado (NDVI) y un SPAD-420 para contenido de clorofila; evaluando en dos muestreos. Se realizó un análisis parcelas subdivididas para variables, correlaciones para estimación de relación y un análisis de multivariados por muestreo. Los resultados indicaron diferencias altamente significativas en rendimiento entre genotipos, localidades e interacciones. Las líneas 6, 43, 44, 40 y 1 presentaron características deseables de producción forrajera. El análisis de conglomerados a 75 y 90 dds retuvo cinco y siete grupos de interés respectivamente, marcando diferencias entre grupos en la prueba de T2, formando grupos diferentes en variedades comerciales y líneas. No se detectó una asociación positiva y significativa entre NDVI y rendimiento para los genotipos estudiados. Los métodos multivariados resultaron herramientas útiles para seleccionar líneas forrajeras de rápida producción. Afirmando a las cebadas como una buena opción para la producción forrajera en épocas invernales en zonas semiáridas, en comparación de avena y trigo.
Palabras clave: cebada sin arista; rendimiento de materia seca; NDVI
Introduction
Winter cereals are a sustainable alternative for livestock production, due to the efficient use of water despite the increasing frequency of frost due to climate change. However, there is competition between them for intensive livestock systems (Colín et al., 2009; Calderón et al., 2015). In Mexico, barley, besides being the main input in the brewing industry, also has the alternative of being used as fodder, for grazing, for silage or to be harvested in both grain and green foliage (Newman and Newman, 2008; Zamora et al., 2017).
Barley has interesting advantages over other cereals of the same cycle, it is more vigorous, resistant to drought and salinity, it can be grown in marginal soils (Colín et al., 2007; 2009; Keles et al., 2013; Wilson et al., 2017). It has been documented that barley, like other winter cereals, has high yields, is rich in proteins, vitamins and carbohydrates (Cherney and Marten, 1982; Cash et al., 2004) and in particular barley, does not diminish so much. forage quality in stages after anthesis, probably due to the greater amount of grain (Colín et al., 2007, 2009).
In order to maintain or increase the production of barley fodder, it is necessary to select new genotypes, more efficient, sustainable production methods that can also adapt to climatic changes (Nelson et al., 2009); in addition, it is necessary to consider desirable characteristics for the producer in intensive systems such as: precocity, plant height and high yield of dry forage.
In the evaluation of biomass or aerial dry matter production, samplings or forage cuts are usually carried out, but recently an indirect and non-destructive sampling method has been developed through the use of infrared sensors known as standardized differential vegetation index (NDVI), having a high percentage of coincidence with the production in wheat and corn (Verhulst et al., 2010; Bastidas et al., 2016); however, this relation has not been studied in barley, neither with canopy temperature and chlorophyll content, nor the possible correlation between these and with the production of total biomass as in other species (Medina et al., 2009; Freeman et al., 2007; Chávez et al., 2017; Castro et al., 2011; Zajac et al., 2013).
The objective of this research was to characterize, group and select lines of forage barley without edges and to estimate the association of infrared sensors with each other and with dry matter yield of this species.
Materials and methods
The study was established in two localities in the state of Coahuila de Zaragoza: Common San Lorenzo, municipality of San Pedro de las Colonias (locality 1) and the experimental field of the Autonomous Agrarian University Antonio Narro in the Municipality of Zaragoza (Locality 2), during the autumn-winter 2016-2017 cycle. San Lorenzo is located at 25º 43’ 26” north latitude and 103º 09’ 12” west longitude, at an altitude of 1 090 masl, with a very arid and semi-warm climate, with a temperature between 18 ºC (coldest month) and 22 ºC (hottest month), summer rains from 5 to 10% per year with 181 mm. The locality of Zaragoza is located at 28º 30’ north latitude and 100º 55’ west longitude, with an altitude of 360 masl, with arid and warm climate; average annual temperature greater than 22 ºC, rains between summer and winter greater than 18% per year between 300 and 400 mm (Arriaga et al., 2000).
45 progenies lines of barley forage barley were evaluated, product of the cross between the variety GABYAN95 with the commercial variety Esperanza, using as witnesses an oat (Cuauhtemoc cv.), a malting barley (cv. Cerro prieto), the forage barley (cv. GABYAN95), a grain triticale (cv. Eronga-83), additionally an experimental wheat line (AN-266-99). These genotypes were established in an alpha-lattice design with three replications, considering the experimental plot of 5.4 m2 (6 rows of 3 m in length, spaced at 0.3 m).
The preparation of the land consisted of the traditional work in the regions, under irrigation conditions, fallowing, tracking and leveling, seeding dry, manually and chorrillo, at a density of 100 kg ha-1. At planting, 80 units of phosphorus were applied using monoammonium phosphate (MAP) and 60 units of nitrogen using urea. In the first aid irrigation, another 60 units of nitrogen were applied. The weeds were controlled with 2,4-D amine at a dose of 1.5 l ha-1, no fungicide or insecticide was applied.
In both locations there was a sowing irrigation and three auxiliary irrigations. The approximate total sheet during the crop cycle was 40 cm. Two samplings were made at 75 and 90 days after sowing, cutting with a sickle 50 cm from a row with complete competition, sectioning at an approximate height of 5 cm above the soil surface. Samples of harvested green forage were placed in paper bags and dried in a forced air oven at 65 °C for 48 hours, then weighed and the dry forage yield was determined in grams (dry matter), transforming into tons per hectare (REND), at the time of cutting the variables were recorded: height of the plant in centimeters (HEIGHT), canopy temperature in degrees Celsius (TEMP), chlorophyll concentration index (CCI), standardized differential vegetation index (NDVI) and the phenological stage (STAGE) according to the scale of Zadocks et al. (1974).
The TEMP was determined with an infrared thermometer IP-54, Fluke brand, with laser sight, indicating in the middle part of each experimental plot. To measure the CCI, a chlorophyllometer SPAD-420, brand Konica Minolta, was used, taking the reading in the middle part of 10 flags leaves of each plot. The NDVI, was measured through a portable sensor, GreenSeekerTM brand, evaluating in the central part of each plot.
The information was analyzed by means of a design of plots subdivided with arrangement in random blocks, considering the localities as a large plot, the samplings as a medium plot and the genotypes as a small plot, the means were compared using the DMS test at 0.05% probability using the use of the SAS package (SAS, 1989).
Subsequently, phenotypic correlations between pairs of variables were obtained. With the means of the genotypes; through the localities, multivariate analysis of main components (ACP) and conglomerates (AC) was carried out for each sample, the analysis of main components in order to reduce the dimensionality of the data, detect associations between variables and characterization partial of the genotypes (Manly, 1986). The analysis of clusters was made to form groups of genotypes similar to each other and different from those of other groups, these analyzes were performed with the Statistica program (Statistica, 1994), to decide on the significance between the groups generated, the test T2 of Hotteling was used (Jhonson and Wichern, 1988).
Results and discussion
The analysis of variance showed highly significant differences between genotypes and localities for TEMP, NDVI, HEIGHT, CCI and REND; likewise, in the interaction genotypes by locality showed highly significant differences in all the mentioned variables and in the interaction genotypes by sampling in the variables HEIGHT, CCI and NDVI differences were also found (p≤ 0.01), while in REND and TEMP no differences were reported.
When ranking the factors and considering the localities as a large plot at the time of the data analysis, it was in recognition of the importance of environmental conditions and their great influence on production (Shao et al., 1995), especially due to changes in temperature that can occur in agricultural areas, generating an impact on the distribution, phenology and physiology of the crop and even on the yield of the crops (Wahid et al., 2007; Jarvis et al., 2008), which could have been the factor that caused the significant difference between the evaluation locations.
The differences between the samples, reflected the effect that time and phenology imposed on the genotypes in most of the evaluated variables except the REND, partially due to the precocity of the barley species (Colín et al., 2007, 2009; Domínguez; et al., 2016), since in general the increase in TEMP, HEIGHT, CCI and STAGE combined with lower NDVI was observed from one sample to another, coinciding with other authors that at early stages the NDVI values are low to a stage where the value maximizes and decreases in later stages (Teal et al., 2006; Freeman et al., 2007).
In the interactions localities by sampling and localities by genotype, differential behaviors were detected, endorsed by the significance of the triple interaction, especially in NDVI and CCI evaluated with the optical sensors for the first time in these immature forage materials and suggesting a detailed study of the genotype environment interaction in these variables. Comparisons of means confirmed that location 1 (San Pedro de las Colonias, Coahuila), highlighted by the greater response REND, STAGE, CCI and NDVI combined with lower TEMP, while, that the effect of temperature and other environmental factors it was more evident in Zaragoza, Coahuila (locality 2), possibly causing a slight degradation of the chlorophyll reflected in the low CCI values obtained in this locality.
It is possible that the temperature has accelerated the phenology of the genotypes (Karsai et al., 2008), which was reflected in the lower CCI contents found, as has been reported in durum wheat mutant lines (Spano et al., 2003). There were 12 groups of significance for the variable TEMP, finding the genotypes 17, 5, 13, 1, 2, 3, 32, 4 and 25 with average values above 24.2 °C, forming the first group; similarly, 13 groups were formed in REND excelling genotypes 43, 6, 44, 19, 25, 1, 11, 23, 2 and 21 with a production between 11.7-12.8 t ha-1 within the 25 genotypes of the first statistical group, confirming the wide adaptation of barley (Nelson et al., 2009), even in arid and semi-arid conditions mentioned by Sadeghpour et al. (2013), coinciding with Domínguez et al. (2016) in the high biomass index in barley compared with wheat and triticale.
Continuing with the comparison of means, 19 groups were obtained in both NDVI and HEIGHT, highlighting in the first variable, the wheat controls AN-266-99 and GABYAN95 with the highest values (0.79 and 0.76 of NDVI respectively), and in genotypes 33, 32, 36, 35, 19, 6, 8, 29, 34 and 4 having shown higher heights of 107.92 cm, in the CCI reported to the control oats with the highest index (54.61 Spad units). Oats (cv Cuauhtémoc), wheat (AN-266-99) and triticale (cv Eronga-83) showed higher NDVI and CCI, but lower REND.
Due to the fact that in the intensive forage production systems, early genotypes are required and the difference between samplings reported by the analysis of variance, the information of the two samplings was analyzed separately using multivariate methods, as well as the analysis of principal components (ACP). for the first sampling at 75 dds, explained 63.82% of the total variance with the first two main components (CP), CP1 contained 39.95% of the variance and with the first two components Figure 1 was generated, allowing visualization in the first quadrant a positive relation of the variables TEMP, REND and HEIGHT between them and positive with both components, having higher association HEIGHT (0.89) with the first component, followed by REND and STAGE.
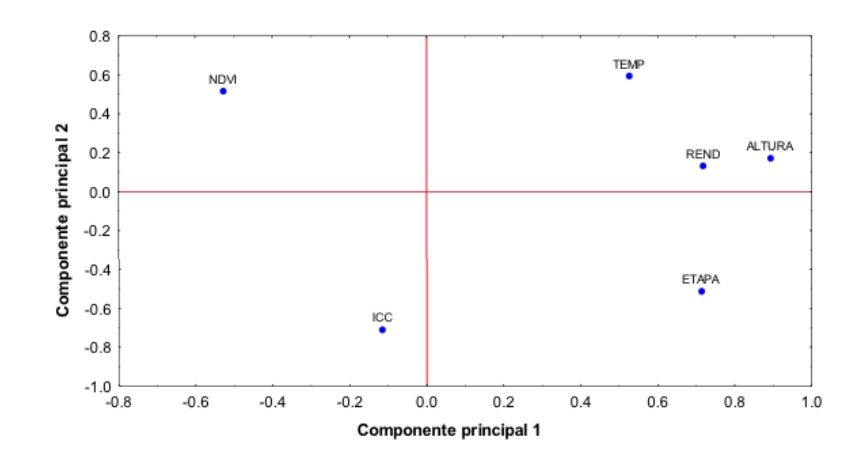
Figure 1 Relationships between the variables evaluated in the plane of the two main components in a first sample (75 days
This suggests that the CP1 is a component of production, precocity and morphology, which can make a separation between the genotypes with higher yield of dry forage, earlier and higher that also have higher canopy temperatures, but with lower NDVI and CCI.
The second CP separates the earliest and highest CCI genotypes from those with higher NDVI, TEMP, HEIGHT and dry forage yield. The relationship detected by this component (CP2) suggests the existence of genotypes that could present the stay green, given that a higher phenological stage still maintains a high chlorophyll content.
This ACP for the first sampling allowed to detect the inverse relationship between the yield of dry matter and NDVI that in other crops has been reported positively and significantly related to the production of biomass (Teal et al., 2006; Freeman et al., 2007; Raun et al., 2008); however, barley seems not to occur or be very affected by the precocity of this species, which could also be related to the lower amount of chlorophyll, as suggested by Spano et al. (2003).
In Figure 2, the genotypes are visualized in the plane generated by the first two CP, where in the first quadrant genotypes 1, 6, 19, 29, 32 and 33, among others, have the highest yield of dry forage, height of plant and temperature, genotypes 25, 37, 44, 41, 42, 43 and 45 were located in the second quadrant, being considered the earliest. In the third quadrant, genotypes 7, 14 and the triticale and oats controls were located, presenting the highest CCI; while oats and genotypes 7 and 14 were located near the next quadrant with high CCI and NDVI values. In the fourth quadrant were Cerro Prieto, GABYAN95 and wheat, as well as genotypes 11, 12, 13, 16 among others, having the highest values of NDVI, but less yielding and late at 75 dds.

Figure 2 Distribution of genotypes in the plane of the two main components in a first sample (75 days).
Some progenies of forage barley were shown to be superior to their progenitor (GABYAN95) in TEMP, HEIGHT, STAGE and REND, which allows the preliminary selection of genotypes such as 40, 41, 42, 43, 44, 45, 25 and 1, which based on their production are potential options to produce adequate amount of forage at 75 dds. A preliminary selection is based on the lack of knowledge of its nutritional composition and other parameters to make the final selection, although the embed stage has been defined to obtain a higher forage quality in cereal crops (Espitia et al., 2012, 2016), where barley is not the exception (Colín et al., 2007, 2009).
In order to clarify the relationships detected by the ACP, Pearson correlations were made between pairs of variables, which showed that HEIGHT was the variable that was most associated with others, because it maintained a positive and significant association with TEMP (r= 0.51). ), with the REND (r= 0.61) and with the STAGE (r= 0.51), but it was negatively and significantly related to the NDVI (r= -0.31), confirming the relationships detected by the ACP shown in Figure 1, where the aforementioned was appreciated. For the CCI, no significant associations were found at this stage.
The STAGE was positively and significantly associated with the REND (r= 0.32), but negatively and significantly with the NDVI (r= -0.51). Thus, it can be established that, for this group of materials, at 75 dds the forage yield is influenced by a higher phenological stage, a higher plant height, and a higher canopy temperature. These results reaffirm what was reported by Colín et al. (2007), regarding the relationship between REND, HEIGHT and STAGE found in barley.
From the analysis of conglomerates (AC) performed at 75 dds, five groups were retained, which the test of T2 declared different from each other, which allowed to establish that oats and triticale (Group 4), behaved very different from those barley evaluated, while wheat was grouped with barley genotypes 7, 9 and 14 forming group 2, indicating a similar behavior.
In this aspect, AC showed to be an effective tool to separate these species and identify genotypes of barley with similar behavior. On the other hand, the Cerro prieto and GABYAN95 witnesses were grouped together with 29 more genotypes of barley forage barley in group 1, another 6 genotypes of barley formed group 3 by having very similar characteristics, as well as those that made up group 5 (Table 1). All the groups were different from each other from the multivariate point of view.
Table 1 Number of members (n), mean and standard deviation of the groups generated by the cluster analysis at a first sample of 75 days.
|
Variable |
Group 1 |
Group 2 |
Group 3 |
Group 4 |
Group 5 |
|
31 |
4 |
6 |
2 |
7 |
|
|
Temperature |
21.2 ±0.24 |
20.5 ±0.457 |
20.7 ±0.197 |
20.4 ±0.082 |
20.9 ±0.197 |
|
NDVI |
0.8 ±0.009 |
0.81 ±0.012 |
0.78 ±0.008 |
0.8 ±0.065 |
0.78 ±0.009 |
|
HEIGHT |
98.5 ±3.867 |
65.8 ±8.305 |
98.8 ±2.97 |
85 ±0 |
98.9 ±2.955 |
|
CCI |
42.67 ±1.365 |
43.26 ±1.98 |
45.57 ±1.023 |
51.97 ±0.46 |
41.69 ±1.104 |
|
Yield |
11 ±1.052 |
8.7 ±0.505 |
11.4 ±0.929 |
9.7 ±2.302 |
11.9 ±1.053 |
|
Stage |
43.9 ±1.777 |
37.3 ±2.872 |
54.8 ±2.23 |
39 ±5.657 |
43.6 ±0.787 |
By analyzing the characteristics of the groups, it was possible to make a more complete characterization of its members and with it a preliminary selection, so that if genotypes with higher fodder yield and higher plant height and a stage of embuche are desired, they could be ideal genotypes belonging to group 5, but if you want to make a forage cut earlier (less than 75 days), the genotypes of group 3 are even earlier, with a yield of 11.4 t ha-1 dry forage and the second highest amount of chlorophyll. These two groups meet the characteristics detected by the ACP related to a higher yield of dry forage, primary objective in forage improvement.
Oats and triticale (group 1), behaved later than barleys, showing plant height and acceptable yields, cool temperature and higher chlorophyll content (CCI), although this was not reflected in a higher NDVI value. The above, supports the assertion that forage barleys represent a good option in the production of forage at a shorter time than the controls of other species, reaffirming the precocity of the barley species (Dominguez et al., 2016), being an alternative for early forage production in semi-arid zones (Colín et al., 2007, 2009; Sadeghpour et al., 2013).
For the second sampling performed at 90 days, the ACP explained 66% of the total variance with the first two main components (CP). The first CP contained 44.21% of the variance, placing the NDVI variable in the first quadrant with a positive relationship in both CP, in the second quadrant the CCI was identified with a positive relation in CP1 and negative with CP2 (Figure 3). This component can be interpreted as performance and appearance, since the right side identifies genotypes with greater greenness, but linked to lower yield, height, stage and temperature.

Figure 3 Relations between the variables evaluated in the plane of the two main components in a second sample (90 days).
The second component contained 21.79% of the variance and suggests that the TEMP presented a negative relationship with the rest of the variables, placing it in the third quadrant (Figure 3). In this second sampling, the positive relationship between the yield of dry forage (REND) with the STAGE, HEIGHT and TEMP reported in the first sampling was maintained. The negative relationship detected by the ACP between the NDVI and the dry forage produced at 90 dds was also maintained, which is contrary to that reported in other species (Teal et al., 2006; Freeman et al., 2007; Raun et al., 2008). It is reaffirmed that the first CP is a component of production, precocity and morphology.
Figure 4 shows the genotypes in the plane generated with the two CP, for their respective partial characterization, thus, located in the first quadrant the wheat and GABYAN95 controls and the genotypes 10, 15, 22, 23, 33, 34, 35, 37, 38 and 39, presented high values of the NDVI at 90 dds, while in the second quadrant those with higher chlorophyll content were located, comprising the Cerro prieto, triticale, oats, and the genotypes 7, 9, 12 , 14 and 16. In this sampling, progenies were also found that showed higher values than the GABYAN95 progenitor in the variables of STAGE, REND, HEIGHT and TEMP, excelling genotypes such as 6, 43, 44, 40 and 1, highlighting that, except for the genotype 6, the remaining genotypes maintained this behavior from the first sampling, with the advantage of not presenting edges in the spike (Flores, 1977; Colín et al., 2009).

Figure 4 Genotype distribution in the plane of the two main components in a second sample (90 days).
In the third quadrant were located genotypes 1, 4, 5, 17, 18, 19, 40, 43, 44 and 45 characterized by higher TEMP and REND, HEIGHT and STAGE, in the fourth quadrant the rest of the genotypes were found with values of higher REND, HEIGHT and STAGE. The wheat was located in a position distant from the rest of the evaluated genotypes, presenting higher NDVI, but being later (low STAGE) and with lower REND in comparison with the evaluated barleys, affirming in it, the relationship that exists between the ranges of NDVI, crop phenology and yield (De la Casa et al., 2007; Grohs et al., 2009; Lara and Gandin, 2015). In addition, in this second sample, some genotypes of barley forage beardless were highlighted, such as 6, 2, 43, 44, 40 and 1, due to higher forage yield, plant height and precocity.
The correlations estimated in this second sampling showed that all the variables studied were significantly related to the yield of dry forage, thus the HEIGHT, STAGE and TEMP were positively related to REND in magnitudes of r= 0.3, r= 0.64 and r= 0.29, respectively; but it was negatively related to the NDVI (r= -0.4) and the chlorophyll content (r= -0.34). The TEMP had a negative and significant relationship with the NDVI (r= -0.63), but positive and significant the STAGE (r= 0.48).
The negative and significant association between NDVI and REND (r= -0.4) is highlighted, which in other species has been reported as positively associated with dry matter yield (Teal et al., 2006; Freeman et al., 2007; Raun et al., 2008) and that justifies the realization of specific studies in barley to determine if the NDVI can be used in the prediction of REND, since in this study only two determinations of the mentioned index were made. The correlations affirmed the results of the ACP and confirmed the significant and negative relationship between the NDVI with the yield of dry matter (REND), which from the first sampling evidenced the aforementioned relationship.
In the second sample, seven groups of interest were retained from those reported by the cluster analysis, since the AC placed wheat as the only member of group 5, separated from the rest of the genotypes studied. As in the previous sampling, the oat and triticale control formed a group (group 4, from Table 2) and they were the ones with the highest HEIGHT and CCI, the lowest REND and the second longest after the wheat, the Group 7 was formed by the Cerro Prieto variety and progenies 12 and 16 of forage barley, with HEIGHT similar to Group 1 but with lower REND, in this sampling progenies 7, 9 and 14 behaved like the later barleys (group 2).
Table 2 Number of members (n), mean and standard deviation of the groups generated by the cluster analysis in the second sample of 90 dds.
|
Variable |
Group 1 |
Group 2 |
Group 3 |
Group 4 |
Group 5 |
Grupo 6 |
Grupo 7 |
|
10 |
3 |
12 |
2 |
1 |
19 |
3 |
|
|
TEMP |
27.3 ±0.317 |
26.8 ±0.357 |
27.3 ±0.34 |
26.7 ±0.507 |
25 ±0 |
26.7 ±0.27 |
26.5 ±0.328 |
|
NDVI |
0.55 ±0.028 |
0.64 ±0.02 |
0.59 ±0.015 |
0.63 ±0.028 |
0.77 ±0 |
0.63 ±0.029 |
0.62 ±0.052 |
|
Height |
108 ±3.384 |
83 ±0.12 |
112 ±2.714 |
121 ±1.178 |
105 ±0 |
114 ±2.845 |
108 ±2.887 |
|
CCI |
48.4 ±0.846 |
48.4 ±1.119 |
46.3 ±0.814 |
55.4 ±2.223 |
44.9 ±0 |
46.4 ±0.842 |
47.7 ±1.937 |
|
REND |
11.9 ±1.053 |
8.5 ±0.962 |
10.8 ±0.682 |
7.9 ±1.406 |
9.4 ±0 |
10.8 ±0.504 |
8.4 ±0.472 |
|
Stage |
72.3 ±1.585 |
53.34.933 |
64.64.124 |
52.54.950 |
43 ±0 |
63.73.656 |
60.83.175 |
As in the first sampling, the AC in this second sampling effectively separated the controls of another species, confirming the different behavior of forage barleys with respect to these controls and demonstrating that AC can be used as a tool in the selection of genotypes. The genotypes of barley forage beardless more yielding and precocious were located in group 1 (Table 2), which at 90 dds were in the stage of milky grain, constituting itself, as well as one of the desirable groups to select, while the rest of the barren foragers were grouped in groups 3 (half of flowering) and 6 (beginning of flowering), the latter groups with similar yields.
This differential in the stages of the barleys, in addition to showing part of the variability that the species possesses, represents options for the production of forage, because comparatively with the oats that were at the beginning of earning, can mean the saving of an irrigation when it is intended to harvest the forage with some grain (Colín et al., 2009)
Other crops such as oats and triticale (group 4) were in a herd emergence stage, with the highest plant height, but with low forage yields. The comparison of the new genotypes against oats is emphasized, given that oats are still the most used in the production of winter forage and it is desired to establish that some genotypes of barley are viable options for intensive forage production schemes. If you want to select genotypes of higher barley forage barley, those of group 6 showed to be the highest among the barleys, in this group the variety GABYAN95 was found, all of them with good precocity, not as advanced as groups 1, but similar to group 3 and earlier than groups 2, 4, 5 and 7.
Once again, the analysis of clusters allowed a more complete characterization of the groups, coinciding with Colín et al. (2007) who placed the oat and triticale crops in a different group. The report reported by Colín et al. (2009), with respect to the fact that the barley forage barley has more precocity and yield among small grain cereals.
As mentioned above, this differential in the phenological stages reached by the barleys, in addition to showing part of the variability that the species possesses, represent options for the production of forage, since comparatively with oats, it can mean the saving of an irrigation when it is intended to harvest the forage with some grain, as occurs in the intensive farms of the semi-arid zones (Colín et al., 2007; Sadeghpour et al., 2013).
Conclusions
The effect imposed by the localities in the dry forage production of the evaluated genotypes was confirmed, as well as the one referring to the sampling stages. The multivariate methods were an efficient support to understand the relationships between variables and provide a partial characterization of the evaluated genotypes, allowing even selecting by desirable characteristics. Among the groups formed there are barren forage barley genotypes desirable for the rapid production of forage in winter, such as 6, 43, 44, 40 and 1.
In the materials evaluated, no positive association was detected between the NDVI and the dry forage production evaluated through the samplings carried out in the localities used. According to this study, it was observed that forage barleys, due to their precocity, are an alternative for forage production during the winter
Acknowledgments
Special thanks are due to the Autonomous University Antonio Narro for the support provided in carrying out this research work. Also, to the SEP-SES for the conventional national support for doctorate studies no. 6690/18.
REFERENCES
Arriaga, L.; Espinoza, J. M.; Aguilar, C.; Martínez, E.; Gómez, L. y Loa, E. 2000. Regiones terrestres prioritarias de México. Comisión Nacional para el Conocimiento y Uso de la Biodiversidad (CONABIO) México, DF. 611 p. [ Links ]
Bastidas, A.; Barahona, R. and Cerón, M. 2016. Variation in the normalized difference vegetation index (NDVI) in dairy farms in northern Antioquia. Livestock Research for Rural Development. Volume 28, Article #43. Retrieved January 16, 2018, from Retrieved January 16, 2018, from http://www.lrrd.org/lrrd28/3/bast28043.html . [ Links ]
Calderón, G. J.; Monterroso, R. A. y Gómez, D. J. 2015. Cambio climático en el centro de México: impacto en la producción de cebada (Hordeum vulgare) en Tlaxcala. Ra Ximhai. 11(5):37-46. [ Links ]
Cash, S. D.; Staber, L. M. M.; Wichman, D. M. and Hensleigh, P. F. 2004. Forage yield, quality and nitrate concentration of barley grown under irrigation. Montana State University. 4 p. [ Links ]
Castro, R. R.; Hernández, G. A.; Aguilar, B. G. y Ramírez, R. O. 2011. Comparación de métodos para estimar rendimiento de forraje en praderas asociadas. Naturaleza y Desarrollo 9(1):38-46. [ Links ]
Chávez, C. E.; Paz, P. F. y Bolaños, G. M. A. 2017. Estimación de biomasa y cobertura aérea usando radiometría e imágenes digitales a nivel de campo en pastizales y matorrales. Terra Latinoam. 35(3):247-257. [ Links ]
Cherney, J. H. and Marten, G. C. 1982. Small grain crop forage potential: I. biological and chemical determinants of quality, and yield. Crop. Sci. 22(2):227-231. [ Links ]
Colín, R. M.; Zamora, V. V. M.; Lozano del R, A. J.; Martínez, Z. G. y Torres, T. M. A. 2007. Caracterización y selección de nuevos genotipos imberbes de cebada forrajera para el norte y centro de México. Téc. Pec. Méx. 45(3):249-262. [ Links ]
Colín, R. M.; Zamora, V. V. M.; Torres, T. M. A. y Jaramillo, S. M. A. 2009. Producción y valor nutritivo de genotipos imberbes de cebada forrajera en el norte de México. Téc. Pec. Méx. 47(1):27-40. [ Links ]
De la Casa, A. and Ovando, G. 2007. Normalized difference vegetation index (NDVI) and phenological data integration to estimate country yield of corn in Córdoba, Argentina. Agric. Téc. 67(4):362-371. [ Links ]
Domínguez, M.; López, C. L. E.; Benítez, R. C. I. y Mejía, C. J. A. 2016. Desarrollo radical y rendimiento en diferentes variedades de trigo, cebada y triticale bajo condiciones limitantes de humedad del suelo. Terra Latinoam. 34(4):393-407. [ Links ]
Espitia, R. E.; Villaseñor, M. H. E.; Tovar, G. R.; Olán, M. y Limón, O. A. 2012. Momento óptimo de corte para rendimiento y calidad de variedades de avena forrajera. Rev. Mex. Cienc. Agríc. 3(4):771-783. [ Links ]
Flores, M. J. A. 1977. Bromatología animal. Edición Limusa. México. 1096 p. [ Links ]
Flores, N. M. de J.; Sánchez, G. R. A.; Echavarría, Ch. F. G.; Gutiérrez, L. R.; Rosales, N. C. A. y Salinas, G. H. 2016. Producción y calidad de forraje en mezclas de veza común con cebada, avena y triticale en cuatro etapas fenológicas. Rev. Mex. Cienc. Pec. 7(3):275-291. [ Links ]
Freeman, K. W.; Girma, K.; Arnall, D. B.; Mullen, R. W.; Martin, K. L.; Teal, R. K. and Raun, W. R. 2007. By-plant prediction of corn forage biomass and nitrogen uptake at various growth stages using remote sensing and plant height. Agron. J. 99(2):530-536. doi: 10.2134/agronj2006.0135. [ Links ]
Grohs, S. D.; Bredemier, C.; Mundstock, M. C. y Poletto, N. 2009. Modelo para estimativa do potencial produtivo em trigo e cevada por medio do sensor GreeSeeker. Eng. Agríc. Jaboticabal. 29(1):101-112. [ Links ]
Jarvis, A.; Lane, A. and Hijmans, R. 2008. The effect of climate change on crop wild relatives. Agr. Ecosyst. Environm. 126(1):13-23. [ Links ]
Jhonson, R. A. and Wichern, D. W. 2007. Applied multivariate statistical analysis. 6th (Ed.). Upper Saddle River, NJ, USA. Prentice-Hall. ISBN 0-13-187715-1. 767 p. [ Links ]
Karsai, I.; Szucs, P.; Kõszegi, B.; Hayes, P.M.; Casas, A.; Bedõ, Z. and Veisz, O. 2008. Effects of photo and thermo cycles on flowering time in barley: a genetical phenomics approach. J. Exp. Bot. 59(10):2707-2715. [ Links ]
Keles, G.; Ates, S.; Coskun, B. and Koc, S. 2013. Re-growth yield and nutritive value of winter cereals. Proceedings of the 22nd International Grassland Congress. Sídney Australia. ISBN: 9781742565439. 951-953. pp. [ Links ]
Lara, B. Y. y Gandini, M. 2016. Caracterización del comportamineto fenlógico de las coberturas vegetales en un sector de la Pampa Deprimida (Argentina): una aproximación utilizando series temporales de NDVI. Ambiência Guarapuava (PR). 12(14):765-783. [ Links ]
Manly, B. F. J. 1986. Multivariate statistical methods: a primer. London: Chapman and Hall. London-New York. ISBN: 0-412-28610-6. 159 p. [ Links ]
Medina, G.; Gutiérrez, R.; Echavarría, F.; Amador, M. y Ruiz, J. 2009. Estimación de la producción de forraje con imágenes de satélite en los pastizales de Zacatecas. Téc. Pec. Méx. 47(2):135-144. [ Links ]
Nelson, C.; Rosegrant, M.; Koo, J.; Robertson, R.; Sulser, T.; Zhu, T.; Ringler, C.; Msangi, S.; Palazo, A.; Batka, M.; Magalhaes, M.; Valmonte-Santos, R.; Ewing, M. y Lee, D. 2009. Cambio climático: el impacto en la agricultura y los costos de adaptación. Instituto Internacional de Investigación sobre políticas alimentarias IPFRI. 30 p. [ Links ]
Newman, R. K. and Newman, W. C. 2008. Barley history: relationship of humans and barley through the ages. In: Newman, R. K. and Newman, C. W. Barley for food and health. science, technology and products. John Wiley & Sons, Inc (Ed.). New Jersey. ISBN: 978-0-470-10249-7. 243 p. [ Links ]
Raun, W. R.; Solie, J. B.; Taylor, R. K.; Arnall, D. B.; Mack, C. J. and Edmon, D. E. 2008. Ramp calibration strip technology for determining midseason nitrogen rates in corn and wheat. Agron. J. 100(4):1088-1093. [ Links ]
Repková, J.; Brestič, M. and Olšovská, K. 2009. Leaf growth under temperature and light control. Plant Soil Environ. 55(12):551-557. [ Links ]
Sadeghpour, A.; Jahanzad, E.; Esmaeili, A.; Hosseini, M. B. and Hashemi, M. 2013. Forege yield, quality and economic benefit of intercropped barley and anual medic in semi-arid conditions: Additive series. Field Crops Res. 148(79:43-48. [ Links ]
SAS. 1989. Institute Inc. SAS/STAT User’s guide. Versión 6. Fourth edition. SAS Institute Inc., Cary, NC. [ Links ]
Shao, G. and Halpin, P. N. 1995 Climatic controls of eastern North American coastal tree and shrub distributions. J. Biogeography. 22(6):1083-1089. [ Links ]
Spano, G.; Di Fonzo, N.; Perrota, C.; Platani, C.; Ronga, G.; Lawlor, D. W.; Napier, J. A. and Shewry, P. R. 2003. Physiological characterization of ’stay green’ mutants in durum wheat. J. Exp. Bot. 54(5):1415-1420. [ Links ]
Statistica, 1994. Statistica for windows (ver. 4.5) Tulsa Ok, USA: StatSoft, Inc. [ Links ]
Teal, R. K.; Tubana, B.; Girma, K.; Freeman, K. W.; Arnall, D. B.; Walsh, O. and Raun, W. R. 2006. In-season prediction of corn yield potential using normalized difference vegetation index. Agron. J. 98(10):1488-1494. [ Links ]
Verhulst, N.; Govaerts, B. y Fuentes, P. M. 2010. Sensor portátil GreenSeekerTM para la medición del índice diferencial de vegetación normalizado (NDVI): una herramienta para la evaluación integral de las prácticas agronómicas. Parte A: conceptos y estudios de caso. México, DF. Centro Internacional del Maíz y Trigo (CIMMYT). El Batán, Estado de México. 13 p. [ Links ]
Wahid, A.; Gelani, S.; Ashraf, H. and Foolad, M. R. 2007. Heat tolerance in plants: an overview. Environm. Exp. Botany. 61(3):199-223. [ Links ]
Wilson, G. C. Y.; Hernández, G. A.; Ortega, C. M. E.; López, C. C.; Bárcena, G. R.; Zaragoza, R. J. L. y Aranda, O. G. 2017. Análisis del crecimiento de tres líneas de cebada para producción de forraje, en el valle de México. Rev. FCA UNCUYO. 49(2):79-92. [ Links ]
Zadocks, J. C.; Chang, T. T. and Konzak, C. F. 1974. A decimal code for the growth stages of cereals. Weed Res. 14(12):415-421. Doi:10.111/j.1365-3180.1974.tb01084.x. [ Links ]
Zajac, C. C.; Vallejos, A. G.; Zajac, E. E. y Galantini, J. 2013. Análisis del rendimiento en cereales de invierno mediante mapas de rendimiento y el índice de vegetación de diferencia normalizada (NDVI) en el Sudoeste Bonaerense, Argentina. Chilean J. Agric. Anim: Sci., ex Agro-Ciencia. 29(2):95-102. [ Links ]
Zamora, D. M.; Pérez, R. J.; Huerta, A. R.; López, C. M.; Gómez, M. R. y Rojas, M. I. 2017. Maravilla: variedad de cebada forrajera para Valles Altos de México. Rev. Mex. Cienc. Agríc. 8(6):1449-1454. [ Links ]
Received: March 01, 2019; Accepted: July 01, 2019
 Este es un artículo publicado en acceso abierto bajo una licencia Creative Commons
