


Services on Demand
Journal
Article
 text in
  English (pdf)
 Article in xml format
 Article references
 Send this article by e-mail
Indicators
-
 Cited by SciELO
 -
 Access statistics
Related links
-
 Similars in
SciELO
Similars in
SciELO
Share

 Permalink
Revista mexicana de ciencias agrícolas
Print version ISSN 2007-0934
Rev. Mex. Cienc. Agríc vol.9 n.2 Texcoco Feb./Mar. 2018
https://doi.org/10.29312/remexca.v9i2.1081
Articles
Genetic variability in some cultivated and wild amaranth species
1Departamento de Fitotecnia-Universidad Autónoma Chapingo, Texcoco, México. Carretera México-Texcoco km 38.5, Chapingo, Estado de México. CP. 56230. Tel. 01(595) 9521500.
2Campo Experimental Valle de México-Instituto Nacional de Investigaciones Forestales, Agrícolas y Pecuarias. Carretera Los Reyes-Texcoco km 13.5, Coatlinchán, Texcoco, Estado de México. CP. 56250.
The genus Amaranthus is widely distributed in America. The study of genetic diversity within and between populations and species of Amaranthus is important to plan strategies for their conservation and continuity. In the present study, 2 species of cultivated species (A. hypochondriacus and A. cruentus) and 5 wild species (A. hybridus, A. retroflexus, A. powellii, A. palmerii and A. spinosus) were evaluated using ISSR-type molecular markers. The 154 loci were analyzed, finding that the average polymorphism percentage for the initiators was 97.9%. Cultivated amaranths were genetically closely related to each other and to their possible wild progenitors (A. hybridus and A. powellii). Among the wild materials those that were closest were A. hybridus, A. powellii and A. retroflexus, while A. spinosus and A. palmerii were the most distant. Most of the detectable genetic diversity was found between species and populations, while the least part was within them.
Keywords: Amaranthus spp.; genetic differentiation; genetic relationships; ISSR
El género Amaranthus se distribuye ampliamente en América. El estudio de la diversidad genética dentro y entre las poblaciones y especies de Amaranthus es importante para planear estrategias de su conservación y la continuidad. En el presente estudio, se evaluó mediante marcadores moleculares tipo ISSR 2 especies cultivadas (A. hypochondriacus y A. cruentus) y 5 especies silvestres (A. hybridus, A. retroflexus, A. powellii, A. palmerii y A. spinosus). Se analizaron 154 loci, encontrándose que el porcentaje de polimorfismo promedio para los iniciadores fue de 97.9%. Los amarantos cultivados mostraron estar genéticamente muy relacionados entre sí y con sus posibles progenitores silvestres (A. hybridus y A. powellii). Dentro de los materiales silvestres los que estuvieron más cercanos fueron A. hybridus, A. powellii y A. retroflexus, mientras que A. spinosus y A. palmerii fueron los más alejados. La mayor parte de la diversidad genética detectable se encontró entre las especies y las poblaciones, mientras que la menor parte estuvo dentro de las mismas.
Palabras clave: Amaranthus spp.; diferenciación genética; ISSR; relaciones genéticas
Introduction
Amaranth is a predominantly tropical annual herbaceous plant that belongs to the genus Amaranthus. This genus contains more than 70 species of which the majority are native to America and only 15 come from Europe, Asia, Africa or Australia. In the USA and Mexico have approximately 29 species. The genus Amaranthus is widely distributed in America, showing great genetic variability, which is observed when observing plant characteristics such as inflorescence type, seed color, precocity, protein content of the seed and resistance to pests and diseases (Akaneme and Ani, 2013; Erum et al., 2012; Mwase et al., 2014). It is an easy crop to establish since it thrives in rainfed regions where basic crops have little success, adapts to various types of soil, altitudes, temperatures and photoperiod, as well as various pH and precipitation requirements (Espitia et al., 2010).
Within the genus are the species A. cruentus, A. hypochondriacus and A. caudatus which are the most important for the production of amaranth grain. The first two are widely distributed in Mexico, forming the most important center of diversity (Espitia et al., 2010; Ruiz et al., 2013).
Mexico is considered a mega-diverse country because of its high number of species, but also because of its richness of endemisms (exclusive species of Mexico), of ecosystems and because of the great genetic variability shown in many taxonomic groups, the result of evolution or natural diversification and cultural in the country, in its territory are between 4 and 8% of the total number of plant species in the world, of which 51% are endemic. For this reason, there is great concern about the conservation of mexican flora, since several activities and factors that threaten it have been detected (Sosa and De-Nova, 2012).
Genetic variability in the broad sense is the most basic component of biodiversity and is defined as the heritable variations that occur in each organism, between individuals in a population and between populations within a species. In the characterization of a species, the variability existing in the genome of the population of individuals that comprise it is estimated (Piñero, 2008).
The study of genetic diversity within and between populations and species of Amaranthus is important to plan conservation strategies for the continuity of such species and populations, as well as to meet the demands of changing environments through the genetic improvement of amaranth and this It will depend to a large extent on the magnitude of the variability available in your gene pool. Therefore, the objective of the present investigation was to analyze the genetic diversity within and between the populations and species of Amaranthus, as well as to compare genotypic identities among the accessions of the seven mexican species under study.
Materials and methods
Vegetal material
Two cultivated species and five wild amaranth species were studied, represented by 13 national amaranth accessions, previously identified morphologically and coming from the INIFAP Genetic Resources program, Valley of Mexico Experimental Field located in Coatlinchan, Texcoco, México (Table 1). The collections and the sampling strategies that were followed for them were determined based on the mandate of the Germplasm Bank and the objectives of the collection. From each accession, 5 individuals were evaluated for the genetic diversity analysis.
Table 1 Accessions used for the analysis of genetic diversity in Amaranthus populations.
| Species | Accession | Abbreviation | Type of sex |
| A. hypochondriacus | Tlax-089 | 89HYP | Monoecious |
| Pue-027 | 27HYP | ||
| A. cruentus | Gto-092 | 92CRU | Monoecious |
| Mor-042 | 42CRU | ||
| A. hybridus | Silv-39 | 39HYB | Monoecious |
| Silv-43 | 43HYB | ||
| A. retroflexus | Silv-26 | 26RETR | Monoecious |
| Silv-38 | 38RETR | ||
| A. powellii | Silv-49 | 49POW | Monoecious |
| Silv-50 | 50POW | ||
| A. palmerii | Silv-27 | 27PALM | Dioic |
| Silv-35 | 35PALM | ||
| A. spinosus | Silv-47 | 47SPIN | Monoecious |
DNA purification
The DNA extraction was done according to the protocol of De la Cruz et al. (1997), with some modifications. Young leaves (0.3 g) were taken and macerated in liquid nitrogen. The macerate was transferred to a 1.5 mL micro tube (Eppendorf) containing 600 μL of extraction buffer (20 mL 1 M Tris-HCL, pH 8, 20 mL 0.5 M EDTA, pH 8, 20 mL 5 M NaCl; μL β-Mercaptoethanol, 40 mL of sodium dodecyl sulphate 20%) and incubated at 65 °C for 10 min in a Standard Heatblock of VWR® Scientific Products, with occasional inversion of the tubes. Then, 200 μL of 5M potassium acetate was added, mixed by inversion and incubated for 30 min at 0 °C.
It was centrifuged at 15 000x g for 10 min at room temperature, and the supernatant was transferred to another tube containing 700 μL cold isopropanol (-20 °C). It was mixed by inversion and incubated at -20 °C for 30 min, then centrifuged for 5 min at 10 000 x g at room temperature. The supernatant was removed and the precipitate was dissolved in 200 μL of dilute solution (50 mM Tris-HCl, 10 mM EDTA-Na2, pH 8), stirred gently until the precipitate was well diluted. 2 μL of RNase A was added and incubated at 37 °C for 1 h in a Felisa® incubator.
Then 20 μL of 3M sodium acetate plus 200 μL of isopropanol was added, mixed by inversion and allowed to precipitate at -20 °C for 2 h. It was centrifuged at 10 000 × g for 5 min at room temperature. The supernatant was removed and the precipitate was washed with 300 μL of 70% ethanol. The pellet was dried and dissolved in TE buffer (10 mM Tris-HCl, 1 mM EDTA-Na2, pH 8) and finally stored at 4 °C. The concentration of the DNA was determined using a Genesys 10 UV Scanning® spectrophotometer (Thermo Scientific) and the quality thereof was observed by electrophoresis in a 0.8% agarose gel. The DNA was used in subsequent PCR reactions.
PCR reaction
The DNA concentration of each sample was adjusted to 10 ng∙μL-1 and 10 primers previously selected were used for the amplification (Table 2). The amplification reactions were performed in a volume of 25 μL, which included 3.2 μL of sterile double distilled water, 10 μL of dNTPs (500 μM), 2.5 μL of 10X buffer (Tris-HCl 750 mM, pH 8.8; (NH4)2S04 200 mM; Tween 20 at 1% (v/v)); 2 μL MgCl2 (25 μM); 3 μL of initiator at a concentration of 10 pM; 0.3 μL of Taq DNA polymerase enzyme at a concentration of 5U μL-1 and 4 μL of genomic DNA at a concentration of 10 ng μL-1. The PCR reactions were performed in a Techne® 28 TC-512 thermal cycler. The reaction conditions were: an initial denaturation step at 94 °C for 3 min, 30 cycles with denaturation at 94 °C for 1 min, alignment at 50 °C for 1 min, and extension at 72 °C for 2 min and finally a final extension cycle at 72 °C for 10 min.
Table 2 List of initiators, their sequence, number of amplified products and percentage of polymorphism detected.
| Initiator ISSR | Sequence | Products amplified | Polymorphism (%) |
| A3 | 5’-CTCCTCCTCCTCCTCCTC- 3’ | 17 | 100% |
| A8 | 5’-AGAGAGAGAGAGAGAGT- 3’ | 21 | 100% |
| A10 | 5’-GAGAGAGAGAGAGAGA- 3’ | 17 | 94.1% |
| P2 | 5’-CTGAGAGAGAGAGAGAGAG- 3’ | 16 | 93.7% |
| P3 | 5’-AGAGAGAGAGAGAGAGTG- 3’ | 13 | 100% |
| IAH-01 | 5’-ACACACACACACA- 3’ | 16 | 100% |
| IAH-02 | 5’-GTGTGTGTGTGTGG- 3’ | 16 | 100% |
| ISSR 01 | 5’-AGGAGGAGGAGGAGGAGG- 3’ | 12 | 91.6% |
| ISSR 04 | 5’-GAGAGAGAGAGAGAGAGAC- 3’ | 6 | 100% |
| (AG) 8YA | 5’-AGAGAGAGAGAGAGAGYA- 3’ | 20 | 100% |
The amplified fragments were separated by electrophoresis in agarose gels at a concentration of 1.2% (w/v) with TAE buffer (40 mM Tris-acetate, pH 7.6, 1 mM Na2 EDTA), from 1 h to 120 V. For the sagging of the samples, 12 μL of the PCR reaction product were used adding 1 μL of charge buffer (0.1% bromophenol blue, 0.1% xylen cyanol, 30% Ficoll and 1% SDS). For reference, the 1kb DNA ladder plus marker (GeneRuler) was used. The gels were stained with ethidium bromide (0.5 mg mL-1) for 5 min and the excess dye was eliminated by rinsing in water for 5 min and documented using the Kodak® High Perfomance Ultraviolet Transilluminator EDAS-290, under UV light.
Data analysis
The materials were compared based on similarities and differences in banding patterns, assigning a value of 1 to the presence of a band and 0 to the absence of it, assuming that bands of equal molecular weight are identical between populations and species, building a Basic Data Matrix (MBD). With the use of the POPGENE 32 program (Yeh et al., 1999), the following parameters were estimated: percentage of polymorphic loci for the species and accessions considered as populations, the Nei genetic diversity coefficient, the Shannon information index, the GST parameter or coefficient of genetic differentiation between species and between populations, and the Nm or number of effective migrants, as well as the matrix of distances and genetic identities of Nei (1973).
In addition, with the software NTSYS-pc version 2.2 (Rohlf, 2000) the dendrogram generated in the POPGENE 32 program was visualized. Finally, the present variation among the species and populations was quantified by the molecular analysis of variance (Amova) using the GenAlEx 6.5 program (Peakall and Smouse, 2006) with 999 permutations.
Results
We studied 154 loci generated using ten ISSR-type primers to amplify the DNA of five individuals from each accession. In Figures 1A and 1B, an example of the patterns obtained using the primer P2 is shown. The average of bands generated per initiator was 15.4, with a range of 6 to 21. The average polymorphism percentage for the initiators was 97.9%, with a minimum of 91.6% and a maximum of 100% (Table 2).
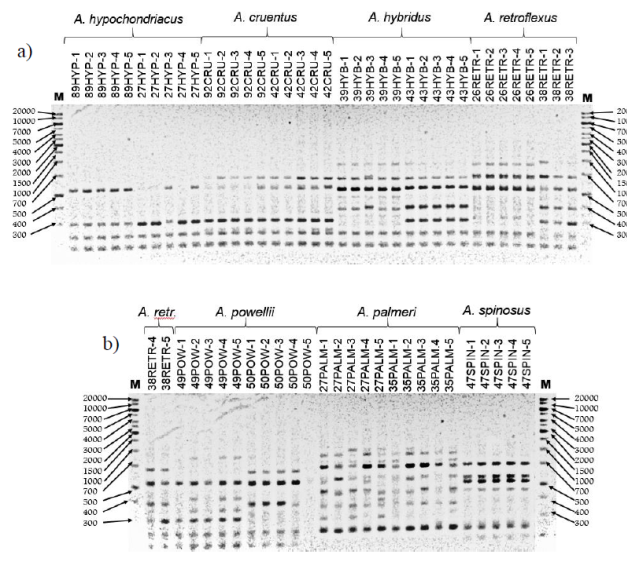
Figure 1 A. Banding patterns obtained with the P2 primer for a sample of 5 individuals from the populations of A. hypochondriacus, A. cruentus, A. hybridus and A. retroflexus. B. Banding patterns obtained with the P2 primer for a sample of 5 individuals from the populations of A. retroflexus, A. powellii, A. palmerii and A. spinosus. M, molecular weight marker, pb.
Genetic diversity in 13 amaranth populations
In Figure 2, the identity dendrogram is shown where the genetic relationships between thirteen amaranth populations corresponding to seven species are established and using the Nei coefficient. At an identity coefficient of 0.718 the formation of two groups is observed.
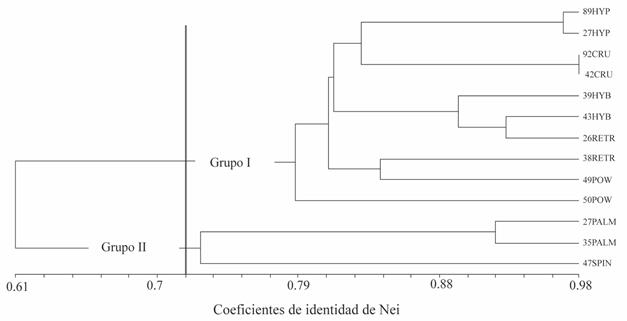
Figure 2 Dendrogram of genetic relationships between populations and amaranth species, constructed using the Nei identity coefficient.
The group I was divided into four subgroups. The first sub-group included the cultivated species A. hypochondriacus and A. cruentus, where the most identical materials were those belonging to the species of A. cruentus (92CRU, 42 CRU), followed by the materials of A. hypochondriacus (89HYP, 27HYP). The most distant materials within this sub-group were A. hypochondriacus (89HYP) and A. cruentus (42CRU). The second sub-group was formed with accessions of A. hybridus and A. retroflexus. The third sub-group included materials from A. powellii (49POW) and A. retroflexus (38RETR), while the fourth sub-group only integrated a material from A. powellii (50POW).
The group II included A. palmerii dioic amaranths and the monoecious material with the presence of spines of A. spinosus, where the most similar accessions are those belonging to A. palmerii (27PALM and 35PALM), while the most distant were 27PALM of A. palmerii and 47SPIN of A. spinosus. The above results suggest that the cultivated amaranths A. hypochondriacus and A. cruentus are closely related to each other and then moderately related to the wild amaranths A. hybridus, A. retroflexus and A. powellii, in the order indicated, and less related to the species A. palmerii and A. spinosus.
With regard to wild amaranths, it was observed that the genetically most related species were A. hybridus with A. retroflexus and A. powellii, and A. palmerii with A. spinosus. Among these, the least related were A. palmerii and A. spinosus.
In Table 3, the indices of diversity calculated within 13 amaranth populations are shown. It is observed that the majority of the populations have low polymorphic loci percentages, with an average of 13.18% and a range that goes from 3.25% for the accession 26RETR, belonging to the species A. retroflexus to 30.52% of the accession 27PALM belonging to the species A. palmerii.
Table 3 Indices of genetic diversity within 13 populations of the genus Amaranthus.
| Species | Accession | NA | NE | H | I | NLP | LP (%) | |
| A. hypochondriacus | 89HYP |
|
1.1039 | 1.093 | 0.0487 | 0.0687 | 16 | 10.39 |
| σ | 0.3061 | 0.278 | 0.1443 | 0.2029 | ||||
| 27HYP |
|
1.1364 | 1.0997 | 0.0549 | 0.0799 | 21 | 13.64 | |
| σ | 0.3443 | 0.2737 | 0.1453 | 0.2076 | ||||
| A. cruentus | 92CRU |
|
1.1234 | 1.1144 | 0.0586 | 0.0822 | 19 | 12.34 |
| σ | 0.3299 | 0.3116 | 0.1586 | 0.2214 | ||||
| 42CRU |
|
1.0649 | 1.051 | 0.0274 | 0.0393 | 10 | 6.49 | |
| σ | 0.2472 | 0.207 | 0.1084 | 0.1536 | ||||
| A. hybridus | 39HYB |
|
1.0455 | 1.0334 | 0.0181 | 0.0263 | 7 | 4.55 |
| σ | 0.209 | 0.168 | 0.0881 | 0.1253 | ||||
| 43HYB |
|
1.0584 | 1.0446 | 0.024 | 0.0346 | 9 | 5.84 | |
| σ | 0.2353 | 0.1952 | 0.1013 | 0.1438 | ||||
| A. retroflexus | 26RETR |
|
1.0325 | 1.0192 | 0.0111 | 0.0168 | 5 | 3.25 |
| σ | 0.1778 | 0.1213 | 0.0658 | 0.0961 | ||||
| 38RETR |
|
1.1623 | 1.0964 | 0.0584 | 0.0877 | 25 | 16.23 | |
| σ | 0.37 | 0.2385 | 0.1382 | 0.2046 | ||||
| A. powellii | 49POW |
|
1.1104 | 1.0811 | 0.0451 | 0.0656 | 17 | 11.04 |
| σ | 0.3144 | 0.2464 | 0.1328 | 0.1906 | ||||
| 50POW |
|
1.1948 | 1.1573 | 0.085 | 0.1216 | 30 | 19.48 | |
| σ | 0.3973 | 0.3358 | 0.1774 | 0.2517 | ||||
| A. palmerii | 27PALM |
|
1.3052 | 1.2253 | 0.1245 | 0.1808 | 47 | 30.52 |
| σ | 0.462 | 0.3727 | 0.1977 | 0.2819 | ||||
| 35PALM |
|
1.2987 | 1.2014 | 0.1132 | 0.1667 | 46 | 29.87 | |
| σ | 0.4592 | 0.3536 | 0.1877 | 0.2686 | ||||
| A. spinosus | 47SPIN |
|
1.0779 | 1.0511 | 0.0287 | 0.0425 | 12 | 7.79 |
| σ | 0.2689 | 0.2001 | 0.1062 | 0.153 |
NA= number of alleles per locus; NE= effective number of alleles per locus; H= genetic diversity of Nei’s; I= Shannon index; NLP= number of polymorphic loci; % LP= percentage of polymorphic loci.
The Shannon indexes (I) and genetic diversity of Nei (H) (Table 3) were also low for the populations. The Shannon indexes had an average of 0.077, with a range of 0.0168 for the accession 26RETR of A. retroflexus and 0.1808 for the accession 27PALM of A. palmerii, while the index of diversity of Nei (H) showed an average of 0.054, with a range of 0.011 for the accession 26RETR of A. retroflexus and 0.124 for the accession 27PALM of A. palmerii.
For the number of alleles per locus (NA) and the effective number of alleles per locus (NE) the range of values between the populations was between 1 032 to 1 305 and 1 019 to 1 225, respectively. The analysis of genetic diversity among the thirteen populations showed that the percentage of polymorphic loci (LP %) was 99.35%. The coefficient of genetic differentiation between populations was high (GST= 0.82), and indicates that approximately 82% of the variation detected can be attributed to genetic differences between populations. The rest (18%) represents genetic diversity within the populations. Based on the coefficient of total genetic differentiation between populations (GST) the estimated gene flow level (Nm) was 0.11. This indicates that there is less than one migrant individual per generation among the populations, which also explains the high level of differentiation detected among them.
Genetic diversity in seven amaranth species
The genetically closest species were the wild A. hybridus and A. retroflexus with a coefficient of 0.93, followed by A. powellii with a coefficient of 0.87. The cultivated species were genetically close to each other, although related to the wild species mentioned above. A. hypochondriacus was related to A. cruentus to a coefficient of genetic identity of Nei equal to 0.86. In addition, the related A. palmerii and A. spinosus wild species were far removed from the cultivated amaranths A. hypochondriacus and A. cruentus, as well as the wild amaranths A. hybridus, A. retroflexus and A. powellii.
With regard to the genetic diversity indices calculated within species, Table 4 shows that the percentage of polymorphic loci was quite low for the seven species evaluated, with an average of 24.02% and a range of values that goes of 7.79% for A. spinosus and 44.16% for A. palmerii.
Table 4 Indices of genetic diversity within seven species of the genus Amaranthus.
| Species | NA | NE | H | I | NLP | LP (%) | |
| A. hypochondriacus |
|
1.1948 | 1.1254 | 0.071 | 0.1049 | 30 | 19.48 |
| Σ | 0.3973 | 0.2916 | 0.1579 | 0.2271 | |||
| A. cruentus |
|
1.1429 | 1.102 | 0.0575 | 0.0837 | 22 | 14.29 |
| Σ | 0.3511 | 0.2671 | 0.1464 | 0.2108 | |||
| A. hybridus |
|
1.1623 | 1.1139 | 0.0656 | 0.0959 | 25 | 16.23 |
| Σ | 0.37 | 0.2695 | 0.1529 | 0.2218 | |||
| A. retroflexus |
|
1.2922 | 1.1732 | 0.1023 | 0.1534 | 45 | 29.22 |
| Σ | 0.4563 | 0.3107 | 0.1738 | 0.2531 | |||
| A. powellii |
|
1.3701 | 1.2404 | 0.1409 | 0.2085 | 57 | 37.01 |
| Σ | 0.4844 | 0.3433 | 0.1937 | 0.2817 | |||
| A. palmerii |
|
1.4416 | 1.2699 | 0.1574 | 0.2348 | 68 | 44.16 |
| Σ | 0.4982 | 0.3607 | 0.1972 | 0.2842 | |||
| A. spinosus |
|
1.0779 | 1.0511 | 0.0287 | 0.0425 | 12 | 7.79 |
| Σ | 0.2689 | 0.2001 | 0.1062 | 0.153 |
NA= number of alleles per locus; NE= effective number of alleles per locus; H= genetic diversity of Nei; I= Shannon index; NLP= number of polymorphic loci; (%) LP= percentage of polymorphic loci.
The Shannon (I) and genetic diversity indexes of Nei (H) were also low (Table 4), the Shannon indexes showed an average of 0.132, with a range of values ranging from 0.042 for the species A. spinosus and of 0.235 for the species A. palmerii, while the index of diversity of Nei (H) showed an average of 0.089, with a range of 0.029 and 0.157.
For the number of alleles per locus (NA) and the effective number of alleles per locus (NE), the range of values for the evaluated species was between 1 078 to 1 442 and 1 051 to 1.27, respectively.
The analysis of genetic diversity among the species indicated a percentage of polymorphic loci (% LP) equal to 99.35%. The coefficient of genetic differentiation between the species was high (GST= 0.7), and indicates that approximately 70% of the genetic variation detected can be attributed to genetic differences between the species. The rest (30%) represents genetic diversity within the species. Based on the coefficient of total genetic differentiation between species (GST) the estimated gene flow level (Nm) was 0.21. This suggests that there is less than one individual migrant per generation among species, which also explains the high level of differentiation detected among them.
The genetically closest species were A. hybridus and A. retroflexus with an identity value of 0.927, while the most distant species were A. spinosus and A. hybridus with a value of 0.534.
Analysis of molecular variance (Amova)
The results of the molecular variance analysis (Amova) indicated significant genetic differences (p≤ 0.001) among the populations studied (Table 5). A genetic variability value equal to 79% was detected among the populations, while the remaining 21% is within the populations. When considering species, it was found that between them 68% of the total genetic variation is present and only 32% is within the species.
Table 5 Analysis of molecular variance (Amova) of amaranth species and accessions.
| Source of variation | Analysis | Df | SS | MS | Est. var. | Vt (%) | PhiPT | Value Px |
| Between accessions | Between | 12 | 1177.385 | 98.115 | 18.645 | 79 | 0.792 | *** |
| Inside | 52 | 254.4 | 4.892 | 4.892 | 21 | |||
| Between species | Between | 6 | 970.485 | 161.747 | 16.661 | 68 | 0.677 | *** |
| Inside | 58 | 461.3 | 7.953 | 7.953 | 32 | |||
| Cultivated vs wild | Between | 1 | 171.212 | 171.212 | 5.46 | 21 | 0.214 | *** |
| Inside | 63 | 1260.572 | 20.009 | 20.009 | 79 | |||
| Between cultivated | Between | 1 | 119.85 | 119.85 | 11.531 | 72 | 0.718 | *** |
| Inside | 18 | 81.7 | 4.539 | 4.539 | 28 | |||
| Between wild | Between | 4 | 679.422 | 169.856 | 18.041 | 66 | 0.655 | *** |
| Inside | 40 | 379.6 | 9.49 | 9.49 | 34 | |||
| Between dioicos vs monoicos | Between | 1 | 284.948 | 284.948 | 15.762 | 46 | 0.464 | *** |
| Inside | 63 | 1146.836 | 18.204 | 18.204 | 54 |
Df= degrees of freedom; SS= sum of squares; MS= sum of mean squares; vt (%)= percentage of variation; Px= probability, *= 0.05, **= 0.01, ***= 0.001.
When comparing the cultivated materials against the wild ones it was found that the genetic variation present within both types of materials is very low with a value of 21%, while the variation among them was very high (79%), which indicates the existence of genetic variation susceptible to use in breeding programs for cultivated amaranths.
Also, it was found that genetic variation among cultivated amaranth populations was 72%, while only 28% is within them, which also demonstrates the high degree of genetic differentiation present between A. hypochondriacus and A. cruentus
When only wild materials were compared, 66% of the genetic variation was found among the populations and only 34% within them. And finally, when making the comparison between the wild materials dioecious against the monoecious, the results indicated that the genetic variation present between the populations is 46% and the rest (54%) is within the populations.
Discussion
The results of the clustering analyze of this work indicate that the cultivated amaranths A. hypochondriacus and A. cruentus are closely related to each other and then moderately related to the wild amaranths A. hybridus, A. retroflexus and A. powellii, and less related with the species A. palmerii and A. spinosus (Figure 2). Pal and Khoshoo (1972) propose A. hybridus L. and A. powellii as the possible progenitors of cultivated amaranths, which may explain the genetic closeness of these species.
In wild amaranths it was observed that the genetically most related species were A. hybridus with A. retroflexus and A. powellii, and A. palmerii with A. spinosus. Among these, those with the lowest percentage of similarity were A. palmerii and A. spinosus (Figure 2).
The highest percentages of polymorphism were found in the wild materials of A. powellii (37.01%), A. palmerii (44.16%) and A. retroflexus (29.22%) (Table 4) because these materials may have been less exposed to a selection pressure either by biotic or abiotic environment factors or by man through genetic improvement (Maughan et al., 2011). Also, the type of sex or pollination of the species could be influencing the genetic variability present (Štefunova, 2014) since the dioic species A. palmerii presented the highest value of polymorphism in comparison with the rest of the species, which are monoecious (Tables 1 and 4).
The genetic diversity index of Nei (H) had an average of 0.089 within the populations, with a range of 0.029 to 0.157 (Table 4), which means low genetic variability in the species and populations studied (Nei, 1973). This low genetic variability present within the different populations and species of amaranth can be explained by the high percentage of self-pollination that occurs in the plant (Agong and Ayiecho, 1991). The low level of polymorphism detected in Amaranthus may reflect the high level of inbreeding that exists in the species (Htet and Park, 2013).
Interspecific hybridization works have been carried out in both wild materials and cultivated materials. When crossbreeding between Amaranthus species has been made, it has been difficult to obtain hybrids due to their low survival rate. Trucco et al. (2005) obtained only 5.9% hybridization between A. hybridus and A. tuberculatus, while Gaines et al. (2012) when crossing between A. palmerii and A. spinosus obtained 0.01% to 0.4% hybridization, between A. palmerii and A. tuberculatus less than 0.2% hybridization and between A. palmerii and A. hybridus less than 0.01% hybridization.
For cultivated species A. hypochondriacus, A. cruentus and A. caudatus, crossing percentages ranging from 5 to 30% have been reported. In this regard, Agong and Ayiecho (1991) estimate between 10.4% and 10.9% of hybridization between A. hypochondriacus and A. cruentus. With this low percentage of cross-links, it is possible to deduce the high rate of differentiation between the different species and the low genetic variability present within the populations (Table 5), because the gene flow between the species is very limited.
The coefficient of genetic differentiation (GST) among the populations was 0.82 and among the species 0.7. These values are high and resemble those reported by Chan and Sun (1997) for the cultivated grain amaranths (A. caudatus, A. cruentus and A. hypochondriacus), which indicate an average value of GST equal to 0.98 at the level of species. For wild species A. hybridus, A. powellii and A. quitensis, the same authors report a value of 0.96.
The number of migrating individuals (Nm), which gives an idea of the degree of gene flow, was 0.112 between the populations and 0.214 between the species. These values indicate that on average there is less than one migrant individual per generation between populations and between species, which confirms the low percentage of crossing and the high degree of differentiation between populations and species.
When comparing the cultivated materials against the wild ones, it was found that the genetic variation present within both types of materials is very low with a value of 21% (Table 5), while the variation between them was very high (79%). which indicates the existence of genetic variation susceptible to use in breeding programs for cultivated amaranths, as well as to define strategies for the conservation of the genus.
Conclusions
Cultivated grain amaranths are genetically closely related to each other and to their possible wild progenitor’s A. hybridus and A. powellii. Among the wild materials those that were closest were A. hybridus, A. powellii and A. retroflexus, while A. spinosus and A. palmerii were the most distant. Most of the detectable genetic diversity was found between species and populations, while the least part was within them. The ISSR type molecular markers were useful for characterizing accessions and estimating genetic diversity in Amaranthus populations.
Literatura citada
Agong, S. G. and Ayiecho, P. O. 1991. The rate of outcrossing in grain amaranths. USA. Plant Breeding. 107:156-160. [ Links ]
Akaneme, F. I. and Ani, G.O. 2013. Morphological assessment of genetic variability among accessions of Amaranthus hybridus. World Appl. Sci. J. 28(4):568-577. [ Links ]
Chan, K. F. and Sun, M. 1997. Genetic diversity and relationships detected by isozyme and RAPD analysis of crop and wild species of Amaranthus. USA. Theor. Appl. Gen. 95:865-873. [ Links ]
De la Cruz, M.; Ramírez, F. and Hernández, H. 1997. DNA isolation and amplification from cacti. USA. Plant Mol. Biol. Reporter. 15:319-325. [ Links ]
Erum, S.; Naeemullah, M.; Masood, S.; Qayyum, A. and Rabbani, M. A. 2012. Genetic divergence in Amaranthus collected from Pakistan. J. Animal Plant Sci. 22(3):653-658. [ Links ]
Espitia, R. E.; Mapes, S. C.; Escobedo, L. D.; De la O, O. M; Rivas, V. P.; Martínez, T. G.; Cortés, E. L. y Hernández, C. J. M. 2010. Conservación y uso de los recursos genéticos de Amaranto en México. INIFAP. Centro de Investigación Regional Centro. Celaya, Guanajuato, México. 200 p. [ Links ]
Gaines, T. A.; Ward, S. M.; Bukun, B.; Preston, C.; Leach, J. E. and Westra, P. 2012. Interspecific transfer of glyphosate resistance. Evol. Appl. 5(1):29-38. [ Links ]
Htet, O. W. and Park, Y. J. 2013. Analysis of the genetic diversity and population structure of Amaranth from South America using 14 SSR Markers. Korean J. Crop Sci. 58(4):336-346 [ Links ]
Maughan, P. J.; Smith, S. M.; Fairbanks, D. J. and Jellen, E. N. 2011. Development, characterization, and linkage mapping of single nucleotide polymorphisms in the grain amaranths (Amaranthus sp.). USA. The Plant Genome. 4:92-101. [ Links ]
Mwase, W. F.; Kachiguma, N.; Manduwa, D. and Maliro, M. 2014. Agromorphological diversity of Amaranthus species in Central Malawi. Inter. J. AgriSci. 4(4):235-241. [ Links ]
Nei, M. 1973. Analysis of gene diversity in subdivided populations. USA. Proceedings of the National Academy of Sciences USA. 70:3321-3323. [ Links ]
Pal, M. and Khoshoo, T. N. 1972. Evolution and improvement of cultivated amaranths. V. Inviability, weakness, and sterility in hybrids. USA. J. Heredity. 63:78-82 [ Links ]
Peakall, R. and Smouse, P. E. 2006. GENALEX 6: genetic analysis in Excel. Population genetic software for teaching and research. USA. Mol. Ecol. Notes. 6:288-295. [ Links ]
Piñero, D. 2008. La diversidad genética como instrumento para la conservación y el aprovechamiento de la biodiversidad: estudios en especies mexicanas. In: capital natural de México. I: Conocimiento actual de la biodiversidad. Piñero, D. (Ed.). CONABIO. México. 437-494 pp. [ Links ]
Rohlf, F. J. 2000. NTSYS-pc Numerical taxonomy and multivariate analysis system, Version 2.1. User Guide. Department of Ecology and Evolution. State University of New York. Stony Brook, NY. [ Links ]
Ruiz H, V. C.; De la O, M.; Espitia, R, E.; Sangerman, J. D. M.; Hernández, C. J. M. y Schwentesius R. R. 2013. Variabilidad cualitativa y cuantitativa de accesiones de amaranto determinada mediante caracterización morfológica. Rev. Mex. Cienc. Agríc. 4(5):789-801. [ Links ]
Sosa, V. y De-Nova, J. A. 2012. Endemic angiosperm lineages in Mexico: hotspots for conservation. México. Acta Bot. Mex. 100:293-315. [ Links ]
Štefúnová, V.; Bežo, M.; Labajová, M. and Senková, S. 2014. Genetic analysis of three Amaranths species using ISSR markers. Emir. J. Food Agric. 26(1):35-43. [ Links ]
Trucco, F.; Jeschke, M. R.; Rayburn, A. L. and Tranel, P. J. 2005. Amaranthus hybridus can be pollinated frequently by A. tuberculatus under field conditions. USA. Heredity. 94:64-70. [ Links ]
Yeh, F. C.; Yang, R. and Boyle T. 1999. POPGENE v1.31. University of Alberta and Centre for International Forestry Research. Canada. [ Links ]
Received: January 00, 2018; Accepted: February 00, 2018
 Este es un artículo publicado en acceso abierto bajo una licencia Creative Commons
