


Services on Demand
Journal
Article
 text in
  English (pdf)
 Article in xml format
 Article references
 Send this article by e-mail
Indicators
-
 Cited by SciELO
 -
 Access statistics
Related links
-
 Similars in
SciELO
Similars in
SciELO
Share

 Permalink
Revista mexicana de ciencias agrícolas
Print version ISSN 2007-0934
Rev. Mex. Cienc. Agríc vol.8 spe 19 Texcoco Nov./Dec. 2017
https://doi.org/10.29312/remexca.v0i19.653
Articles
Environment and growth regulators in the expression of Flowering Locus T in mango
1Instituto Nacional de Investigaciones Forestales, Agrícolas y Pecuarias. Carretera Internacional México-Nogales km 6, Santiago Ixcuintla, Nayarit. CP. 63300. Tel. 38718700, ext. 84416.
2Colegio de Postgraduados-RGP-Fruticultura. Carretera México-Texcoco km 36.5, Montecillo, Texcoco, Estado de México. CP. 56230. Tel. 595 9520200. (alexge@colpos.mx; racm@colpos.mx).
3Instituto Nacional de Investigaciones Forestales, Agrícolas y Pecuarias. Campo Experimental Costa de Hermosillo. Pascual Encinas Félix núm. 21, Col. La Manga, Hermosillo, Sonora. CP. 83220. Tel. 55 38718700, ext. 81313. (perez.adriana@inifap.gob.mx).
4Centro de Investigación en Alimentación y Desarrollo. Carretera El Dorado km 5.5, Col. Campo El Diez, Culiacán, Sinaloa. CP. 80129. (osuna@ciad.mx).
The quantification and expression of genes related to flowering is an important tool to understand this process. Studies carried out in Arabidopsis ssp. have served as a basis for molecular studies in fruit trees. The objective was to quantify the expression of the gene flowering locus T (MiFT) in ‘Ataulfo’ mango and its relationship with environment and growth regulators. Two experiments were carried out: 1) trees with 2 500 mg L-1 of paclobutrazol (PBZ) were applied in a single application (1X) at 30 days after pruning (ddp). The mature leaves were collected from September to December 2013 and January to February 2014 under sunny and shaded conditions. Experiment 2: growth regulators, PBZ (2 500 mg L-1, 1X), calcium prohexadione (P-Ca) (500 mg L-1, 3X) and gibberellic acid (250 mg L-1, 1X) were applied. The expression MiFT was quantified, the number and type of growth emerged in flowering, temperature and precipitation were evaluated. The experimental design was completely randomized with factorial arrangement in experiment 1 and completely randomized in experiment 2. MiFT was expressed in all sampled months, the expression varied from 0.3 to 31.4%. On the other hand, when evaluating the expression of the gene with respect to the orientation of the outbreak, the results were 0.081% on the shaded side and 12% on the sunny side. Sunny shoots had the highest flowering ptercentage (66%). MiFT was expressed in leaves treated with PBZ and P-Ca, the highest expression was in December, cooler month, with 4.7 and 30.3%, respectively, which favored flowering. Gibberellins inhibited the expression of the gene and therefore flowering.
Keywords: Mangifera indica L.; flowering; gene expression; growth regulators
La cuantificación y expresión de genes relacionados con floración constituye una herramienta importante para entender este proceso. Trabajos realizados en Arabidopsis spp. han servido como base para estudios moleculares en frutales. El objetivo fue cuantificar la expresión del gen flowering locus T (MiFT) en mango ‘Ataulfo’ y su relación con ambiente y reguladores de crecimiento. Se llevaron a cabo dos experimentos: 1) se aplicaron árboles con 2 500 mg L-1 de paclobutrazol (PBZ) en una sola aplicación (1X) a 30 días después de la poda (ddp). Se colectaron hojas maduras de septiembre a diciembre 2013 y enero a febrero 2014 bajo condiciones de sol y sombreadas. Experimento 2: se aplicaron reguladores de crecimiento, PBZ (2 500 mg L-1, 1X), Prohexadiona de calcio (P-Ca) (500 mg L-1, 3X) y ácido giberélico (250 mg L-1, 1X). Se cuantificó la expresión MiFT, se evaluó el número y tipo de crecimiento emergido en floración, temperatura y precipitación. El diseño experimental fue completamente al azar con arreglo factorial en experimento 1 y completamente al azar en el experimento 2. MiFT se expresó en todos los meses muestreados, la expresión varió de 0.3 hasta 31.4%. Por otra parte, al evaluar la expresión del gen con respecto a la orientación del brote, los resultados fueron de 0.081% el lado sombreado y 12% el soleado. Brotes soleados presentaron el mayor porcentaje de floración (66%). MiFT se expresó en hojas tratadas con PBZ y P-Ca, la mayor expresión fue en diciembre, mes más frío, con 4.7 y 30.3%, respectivamente, lo que favoreció floración. Giberelinas inhibió la expresión del gen y por ende floración.
Palabras claves: Mangifera indica L.; expresión de genes; floración; reguladores de crecimiento
Introduction
Currently, identification, quantification and expression of genes related to flowering is an important tool for understanding the process from induction, floral initiation and differentiation in many fruit (Nishikawa et al., 2007; Muñoz et al., 2012) bIn mango, several studies mention that the mature leaves are able to perceive the environmental stimulus for flowering and produce large amounts of “florigero” under inductive conditions and transport it to the apical meristem from a distance of up to 100 cm in subtropical conditions and 52 in tropical (Davenport and Ying, 2004; Davenport et al., 2006; Ramírez and Davenport, 2010). The floral induction is manifested by the generation of this “flower” on the leaf, apparently unknown.
In Arabidopsis thaliana, an annual species, four routes have been identified that allow flowering; photoperiod, vernalization, gibberellins and autonomous, and their relation at genetic level has been well studied (Wilkie et al., 2008). In the photoperiod path that triggers flowering in Arabidopsis, the circadian clock is involved, which leads to many metabolites and molecular processes, such as gene expression, varying throughout the day. Constans (CO), the key gene in controlling the flowering of this species, provides the link between the mechanism that detects daylight and the production of the flowering signal. CO is then a transcription factor that activates the flowering locus T (FT) gene which generates the flowering signal through its FT mRNA transcript which translates into FT protein (Corbesier et al., 2007; Zeevaart, 2008).
This protein is considered the “florígero” situation mentioned hypothetically long as responsible for flowering in many species and mentioned that a similar mechanism in fruits including mango (Wilkie et al., 2008) could be involved in floral induction (Brunner and Nilsson, 2004).
Studies in Arabidopsis have served as the basis for molecular studies in fruit species. In tropical, studies generally include a relationship of gene expression with initiation and floral development, environment and growth regulators. In ‘Satsuma’ mandarin, levels of the homologous FT gene increased with cold temperatures during floral induction time (Nishikawa et al., 2007) and in sweet orange there is evidence that levels of leafy (LFY) and apetala (AP1) homologues increase during and after floral induction with cold temperatures (Pillitteri et al., 2004).
In the citrus transgenic hybrid (Citrus sinensis L. Osbeck x Poncitrus trifoliata L. Raf) an overexpression of LFY and AP1 substantially reduced the juvenile phase, although flowering apparently depended on environmental control (Peña et al., 2001) . In Poncirus trifoliata the expression of FT gives it early flowering (Endo et al., 2005). While in mandarin ‘Moncada’ FT is inhibited by fruit loading (Muñoz et al., 2011).
In sweet orange trees ‘Salustiana’, it was observed that gibberellins inhibited flowering by repressing the expression of homologous genes flowering locus T (CiFT), in leaves; whereas paclobutrazol (PBZ) increased the flowering stimulating its expression. The activity of the terminal flower 1, flowering locus C, suppressor of overexpression of constans 1, and apetala 1 homologues were not affected by regulators (Muñoz et al., 2012).
In mango there is little information about this, recently a gene like flowering locus T (FT) was identified and characterized. The flowering locus T (MiFT) sequence showed a high identity to the FT gene of other plants and its expression increased in leaves under inductive flowering conditions (low temperatures) and in trees with low fruit production. The application of 250 mg L-1 of gibberellic acid (AG3) completely inhibited the flowering and expression of MiFT in both high and low production. In this study they conclude that MiFT is the key factor in the flowering of the mango (Nakagawa et al., 2012).
According to the above, genes related to the flowering process in herbaceous plants such as Arabidopsis, have served as a basis for studies in fruit trees. In subtropical and tropical, there are works in this respect in citrus, but in mango the information is very scarce and null in the case of ‘Ataulfo’ mango. In this species it is necessary to carry out studies at the molecular level to try to counteract the effects of climate on induction, differentiation and floral bud. Based on the above, the objective of this study was to quantify the expression of the flowering locus T (MiFT) in ‘Ataulfo’ mango and its relationship with environment and growth regulators.
Materials and methods
The study was conducted during the period 2013-2014 with warm weather (32-35/23-24 °C; day, night) and rainfall during october (122 mm), november (161 mm) and december (105 mm) . A six year old ‘Ataulfo’/ creole regional mango orchard was selected in the municipality of Santiago Ixcuintla, Nayarit. The planting distance was 3 × 2.5 m between row and tree, respectively and managed in hedge type. The orchard was managed under a drip irrigation system, lateral pruning (cut of approximately 50 cm, only on east side and west) and fertilization with 2 kg of Triple 17 per tree at the beginning of the rainy season (June) and 1 kg of organic fertilizer (manure) per tree applied in September.
In this orchard, 60 trees of uniform vigor were selected, in which two experiments were performed. Experiment 1. Expression of MiFT in leaves treated with PBZ by effect of sampling time and orientation in the tree. A single dose (1X) of 2 500 mg L-1 de PBZ was applied to12 trees, 30 days after pruning (ddp). As a control, shoots were collected before the application of PBZ (September 30) and later at 60, 90, 120 and 150 days after application (dda); that is, each month, beginning on november 30, 2013 until February 2014 (beginning of flowering). At each date, 36 outbreaks were selected from only six trees per treatment previously assigned for sampling and 12 outbreaks were taken in north orientation (shaded side), 12 in the east (sunny side in the morning) and 12 in the west (sunny side by the afternoon). The leaves were separated, identified and stored at -80 °C until used for RNA extraction.
Experiment 2. Expression of MiFT in leaves of Mango ‘Ataulfo’ by effect of growth regulators. Four treatments were evaluated. 1. The dose of 500 mg L-1 of calcium prohexadione (P-Ca), in three applications (3X) at 30 + 45 + 60 days after pruning (ddp). 2. A dose of 2 500 mg L-1 of PBZ in a single application (1X) 30 ddp. 3. A dose of 200 mg L-1 of AG3, one application (1X) at 120 ddp and 4. Control. In all cases, 12 trees were sprinkled. For the treatments with P-Ca and PBZ, emerged shoots were collected at 0 days after application (dda) and later at 60, 90, 120 and 150 days after application (dda); that is, from November 2013 to February 2014 (beginning of flowering). In trees sprayed with AG3 (November 30, 2013) shoots were collected at 0, 30 and 90 days after application. In the control, the shoots were collected at a similar date to the treatments P-Ca and PBZ. At each date, 36 outbreaks were selected from only six trees (around and half) per treatment previously assigned for sampling. Like the previous experiment, the leaves were separated, identified and stored at -80 °C until their use for RNA extraction.
In both experiments PBZ (Austar®) was applied to the soil by bathing the main stem at a height of 30 cm from the soil base. In the second experiment, the solution of P-Ca (Apogee®) was prepared with tap water and 1 ml L-1 of Inex® surfactant was used. P-Ca was applied to the foliage to drip point by motorized spray pump. The AG3 solution was prepared with tap water and 1% leaf urea was used as the penetrating agent and 1 ml L-1 of Inex® surfactant was used. The control trees were sprayed with water + urea + surfactant.
The variables evaluated in both experiments were the following:
1. Extraction, quantity and quality of RNA and cDNA. For the extraction of RNA, the methodology of Nakagawa et al. (2012). Extraction was done using an RNAqueous Kit (Applied Biosystems). To remove the phenols, the Plant RNA isolation Aid kit (Applied Biosystems) was used, which was added in the first step of the extraction procedure. Subsequently the extraction was treated with TURBO DNA-free Kit (Applied Biosystems) to remove the genomic DNA and to purify and clean the sample. Quantification and quality evaluation was performed by UV spectrophotometry (Thermo Scientific NanoDrop 2000).
Subsequent to this we proceeded to the synthesis of complementary DNA; the first strand of the cDNA was synthesized by retrotranscriptase, using SuperScript® VILO™ cDNA Synthesis Kit (Applied Biosystems). Quantification and evaluation were similar to RNA.
2. Relative expression of the MiFT gene. Following the extraction of RNA and complementary DNA synthesis cDNA, the quantification of relative expression (means that the level of the gene of interest in the treated sample represents only one (%) of the endogenous gene level) was by Real Time PCR, real-time polymerase chain reaction (qPCR), following the methodology of Nakagawa et al. (2012).
The forward and reverse primers used for the quantification and expression of the MiFT gene in ‘Ataulfo’ mango were those reported by Nakagawa et al. (2012) and the sequences of the primers were as follows:
The real-time PCR was performed with Platinum® SYBR® Green qPCR SuperMix-UDG (Applied Biosystems) using StepOne (Applied Biosystems) following the manufacturer’s instructions. Each reaction contained 12.5 µl of Platinum® SYBR® Green, 0.5 µl of each of the forward and reverse primers, 0.5 µl of ROX, 9 μl of deionized water (dH2O), 2 µl of sample cDNA. The thermocycler conditions were 95 °C for 30 s followed by 40 cycles of 95 °C for 5 s and 60 °C for 30 s. A mango amplifier factor gene (MiEF) was used as an internal (endogenous) control. PCR real-time was performed on three replicates and transcript levels were normalized against MiEF. The relative expression of the gene was calculated using the 2-ΔΔCT method proposed by Livak and Schmittgen (2001).
3. Number and type of growth. In both experiments and in the six remaining trees (without outbreak sampling) of each treatment, 30 tree-1 apical shoots emerged after summer pruning (August 5, 2013); that is, 180 per treatment. In these outbreaks, the number and type of growth (vegetative, reproductive and inactive) emerged in the apical bud of shoots during the flowering period. With these data, the percentage of floral, inactive and vegetative shoots was calculated, considering the number of each of them among the total number of outbreaks evaluated, e.g. number of floral outbreaks/total outbreaks marked.
4. Temperature and precipitation. The temperature data were taken from the sensor placed in the previous experiment and the precipitation of the station Verdineño, located 2 km from the orchard (Network of Agroclimatological Stationsof the state of Nayarit).
In experiment 1, Shapiro-Wilks normality tests were performed, because the values obtained from QR (relative amount) had no normal distribution. They were adjusted with transformations and analyzed under a randomized experimental design with factorial treatments (5x3), where the factors were as follows: Dates (September, November, December, January and February) and orientation in the tree (east, west and north). Fifteen treatments, plus one control, with three replicates were evaluated and analyzed with non-parametric statistics, with the Kruskal-Wallis test, which allowed multiple comparison.
In Experiment 2, the experimental design was completely randomized, evaluating four treatments with six replicates, 30 shoots per replicate as a useful plot. The Tukey test (p≤ 0.05) was used for comparison of means. The SAS version 9.2 program was used.
Results and discussion
Quantification and quality of RNA
In general, the average amount of RNA in mature leaves with PBZ (2 500 mg L-1, 1X at 30 dpp) was 44.7 ng µL-1 reaching a 260/280 ratio of 1.96 on average. The average amount of cDNA was 2103.6 ng µL-1 and a 260/280 ratio of 1.87 (Table 1). In leaves with P-Ca (500 mg L-1, 3X at 30 + 45 + 60 ddp) the amount of RNA was 42.3 ng µ L-1, with a ratio of 1.95 (260/280), while that of cDNA was 2025 ng µL-1 and a ratio of1.87. WithAG3, the amount of RNA was 36.1 ng µ L-1 and of 2006.7 the cDNA content with a 260/280 ratio of 1.92 and 1.85, respectively. In leaves without regulator, we found an amount of 33.6 ng µ L-1 RNA and 2006.3 ng µL-1 cDNA, the 260/280 ratio was 1.89 and 1.85, respectively.
Table 1 Quantity and quality of RNA and cDNA in ‘Ataulfo’ mango leaves.
| Tratamiento | RNA (ng µl-1) | Relación (260/280z) | cDNA (ng µl-1) | Relación (260/280z) |
| PBZ 2 500 1X | 44.7 | 1.96 | 2 103.6 | 1.87 |
| P-Ca 500 3X | 42.3 | 1.95 | 2 025.5 | 1.87 |
| AG3 200 1X | 36.1 | 1.92 | 2 006.7 | 1.86 |
| Testigo | 33.6 | 1.89 | 2 006.3 | 1.85 |
| CV | 52.9 | 4.37 | 5.56 | 1.81 |
z= Longitud de onda para absorción de los ácidos nucleicos/proteínas (Luz UV).
Irrespective of the experiment, the extracted amount of RNA in ‘Ataulfo’ mango leaves was sufficient to achieve an outstanding amount of cDNA once converted by retrotranscriptase, an enzyme that exists in nature as part of the virus replication mechanism, and uses a tRNA as oligonucleotide or primer (Falcon and Valera, 2007).
The extracted RNA was of excellent quality, according to the ratio 260/280 obtained in the spectrophotometer. The ratio between the readings obtained at 260 nm and 280 nm (OD260/ OD280) provides an estimate of the purity of the nucleic acids. Nucleic acids have a maximum absorption at a wavelength of 260 nm. At this length therefore, the absorption is indicative of the concentration, whereas in the 280 nm length, the absorption shows proteins and phenol compounds. Nucleic acid extractions of good quality and purity should have a 260/280 ratio with values between 1.8-2, lesser amounts mean that there are presence of proteins, phenols or other contaminants that could interfere with the results of the tests to be performed (Wilfinger et al., 1997; Anonimo, 2007). Likewise the amount of cDNA obtained was of good quality without contamination of compounds as mentioned above. This allowed the qPCR to be efficiently performed to quantify the expression of the MiFT gene in both experiments.
Temperature and precipitation
In 2013-2014, the minimum temperature in October and November remained between 23 and 24 °C, while the maximum temperature was between 32 and 35 °C, in December the minimum temperature dropped to 17 °C and in January and February remained between 15 and 18 °C. Rainfall was observed during October and November (122 and 161 mm, respectively), in december rainfall was 105 mm and there was little rainfall in January and February (Figure 1).

Figure 1 Maximum temperature, minimum and precipitation presented during the period of induction, initiation and floral sprouting in ‘Ataulfo’mango.
Experiment 1. Expression of MiFT by period effect and orientation in the tree.The analysis of variance for the QR variable, relative amount of expression of the gene of interest MiFT, showed high significance for the intercept and months (Table 2). While the multiple comparison with Kruskal-Wallis of the MiFT gene expression according to the orientation, showed a relation for the west and east side (Table 3).
Table 2 Analysis of variance for transformed data (Ln X+1) of gene expression.
| Efecto | SC | GL | CM | F | P |
| Intercepto | 42.86635 | 1 | 42.86635 | 637.4918 | 0 |
| Meses | 7.31809 | 4 | 1.82952 | 27.208 | 0 |
| Orientación | 9.67863 | 2 | 4.83932 | 71.9685 | |
| Meses*orientación | 32.51464 | 8 | 4.06433 | 60.4431 | |
| Error | 2.01727 | 30 | 0.06724 |
Table 3 Multiple comparison of the MiFT gene expression according to the orientation in the tree. Kruskal- Wallis.
| Orientación | Norte (N) | Oriente (O) | Poniente (P) |
| Norte (N) | 0.820157 | 1.862729 | |
| Oriente (O) | 0.820157 | 2.682885 | |
| Poniente (P) | 1.862729 | 2.682885 |
In Figure 2, the results obtained in the expression of the gene of interest MiFT in relation to the endogenous MiEF gene are shown. Regarding the time of sampling, the relative expression of MiFT was observed in all months sampled. The expression varied from 0.30 to 3.4 with respect to MiEF. The month of greatest expression was december followed by january and february. Regarding orientation, the relative expression of MiFT was on average 0.81, 1.9 and 0.54 on the north, east and west sides, respectively (Figure 2).
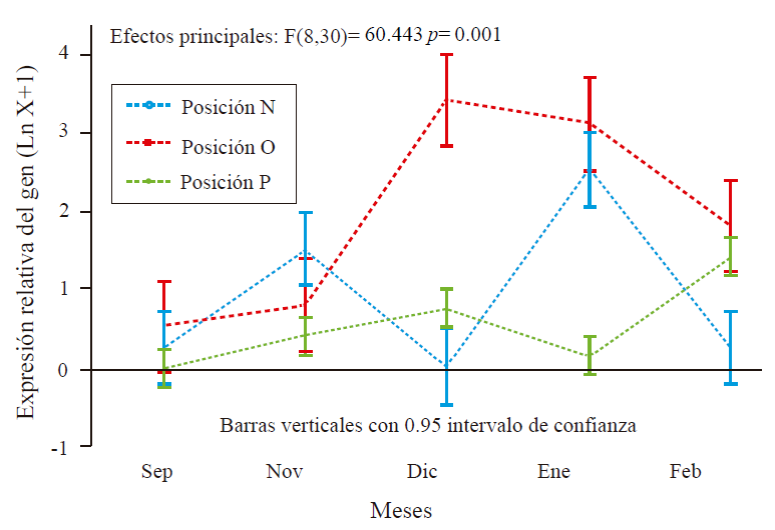
Figure 2 Relative expression of MiFT relative to MiEF in ‘Ataulfo’ mango leaves treated with PBZ. N, O and P, correspond to north, east and west of the tree.
Considering the interaction it was found that in September the expression was MiFT was 0.25 and 0.53 in north and east side, respectively, in November the expression was 1.51, 0.8 and 0.4 in north, east and west side, in December MiFT was expressed only on the east side with 3.4 and west with 0.75, while in january the expression was 2.5 and 0.15 north and west sides and 3.1 on east side. In February, the expression was on the north, east and west sides of 0.25, 1.8 and 0.5, respectively.
In leaves treated with PBZ, the expression of MiFT (gene of interest) was observed in all months of study, but only in leaves of sunny buds during the morning was expressed in greater quantity with respect to leaves of sunny shoots in the afternoon and completely shaded leaves. In leaves of shaded shoots (north side), the expression greater expression was in the months of November and January; but it was minimal compared to the east side. This indicates that the MiFT gene is probably regulated by light when expressed in greater quantity on the soil side and a minimum expression on the north side where the trees are always shaded by the union of tree tops (hedge-like formation).
It can be observed that in the month of September (before the application of PBZ), the expression was null in leaves with orientation west, but there was a minimal expression of the gene in sunny leaves of the east side; in the following months MiFT presented a minimal expression in leaves shaded probably by effect of the regulator PBZ, which resulted in that a small percentage of shaded shoots flourished.
In ‘Fuji’ apple tree (36° north latitude, 139° west longitude and 747 meter above sea level) found no difference in flowering locus T (MdFT1) gene expression (MiFT homolog) in apical buds of shaded and sunny buds but the expression of MiTFL1 (floral repressor) was higher in shaded shoots (Kittikorn et al., 2011), results that do not coincide with our study, despite results in apple, were obtained in different species and tissue and shading was only 50% and in the present study conducted under field conditions very different from those of apple tree (21°north latitude 105° west longitude, 150 m), at least on the north side, the shade was about 90%.
The highest expression was found in December and January on a sunny side, which coincided with the presence of colder temperatures and probably with the time when induction and floral initiation occurred in mango, as reported in mandarin ‘Satsuma’ by Nakagawa et al. (2007) where the level of the orthologous gene flowering locus T (CiFT) increased with cold temperatures during floral induction time and in sweet orange tree LFY and AP1 increased during and after floral induction (Pillitteri et al., 2004). On the other hand, Nakagawa et al. (2012) identified a gene as the flowering locus T (MiFT) on leaves of ‘Irwin’ mango trees that developed under inductive temperatures at flowering (15°C).
In our study we observed a greater expression of the gene mentioned in leaves of ‘Ataulfo’ in the months of December and January, months in which the temperatures were lower than in September, October or November (Figure 1).
In sunny leaves and with application of PBZ, it was found that MiFT was expressed in the majority of months evaluated; although the expression was highly increased in the month of December, January and February. The above indicates that the regulator favors gene expression probably through its effect on the inhibition of gibberellin synthesis; in addition to this, the months of december to february were the freshest compared to September, October and November. Similar results are reported in fresh orange leaf ‘Salustiana’ where PBZ stimulated the flowering of homologous genes to flowering locus T, CiFT (Muñoz et al., 2012).
Type of growth emerged during the flowering season. During the flowering season, on the east side (sunny shoots), 66% of shoots had flowering, 12% had only vegetative shoots and 25% were inactive. On the west side (shaded in the morning and sunny in the afternoon), 40% of the shoots had flowering, 50% only vegetative growth and 12% were inactive. On the north side (shaded side) most shoots were inactive (76%), although 12% presented flowering (Figure 3).

Figure 3 Percentage and type of growth emerged during the flowering period in ‘Ataulfo’ mango shoots treated with PBZ and in different orientation in the tree. BF= floral bud; BV= vegetative shoot; BI= inactive bud. East (O), west (P) and north (N) of the tree, 2014. The bars at each point represent the average of 160 outbreaks per treatment ± standard error.
In the flowering period, the percentage of flower buds was higher on the sunny side when PBZ was applied, which coincides with the greater expression of MiFT. In addition, it is likely that PBZ by inhibiting the synthesis of gibberellins favored the expression of the gene responsible for floral induction as reported by Nakagawa et al. (2012). On the west side (sunny in the afternoon) and north (shade of approximately 90%) the percentage of buds with flowers was minimal, but flowers were present on both sides when PBZ was applied. The above indicates that the regulator induced, although in smaller quantity, the expression of the MiFT gene provoking the induction of flowering in this type of shoots and therefore the presence of flowers; however, the light is strongly regulating its expression.
On both sunny and shaded sides a large number of shoots remained inactive, which could be due to the fact that the environmental conditions during November, when induction and floral initiation in mango usually occur (Pérez et al., 2009), were not adequate for flowering since there were temperatures above 20 °C and presence of rain; however, with the application of PBZ, an adequate percentage of floral shoots were obtained on sunny side, which coincided also with the greater expression of MiFT in December, when thentemperature was lower to 20 °C.
Experiment 2. Expression of MiFT by effect of growth regulators.The relative expression in leaves with P-Ca was 0.02% in September, 1.1% in November and increased in December to 4.7% and decreased in January with 1.1%, in October and February the expression was 0 (Figure 4). In leaves applied with PBZ the relative expression of MiFT in relation to MiEF was 0.7% in September, in November the expression was 2.8% increasing in december to 30.3 and 22.2% in January, in February it was 6.5%. In control leaves (without regulator) the expression was 0.06% in September, zero in October, November and December, 0.87% in January and zero in February; while in leaves with AG3, the expression was 0 in all months evaluated except for february which had 0.02% expression.
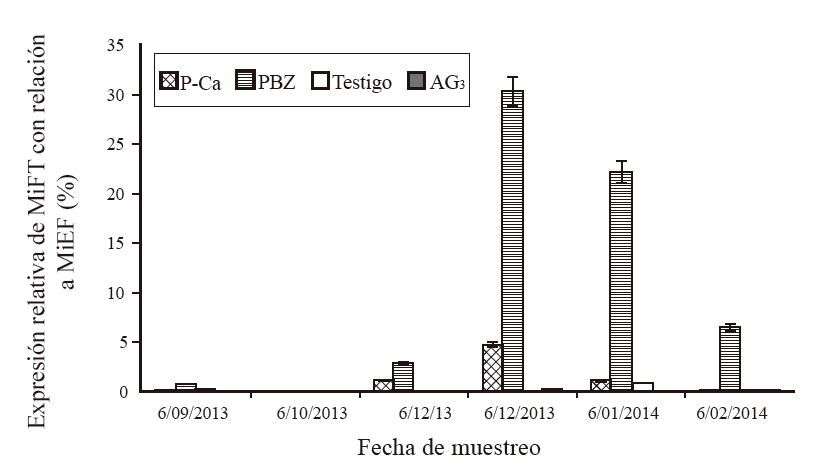
Figure 4 Relative expression of MiFT over MiEF in ‘Ataulfo’ mango leaves with and without growth regulator. The bars at each point represent the average of three replicates per treatment ± standard error.
Results similar to those obtained in PBZ were presented in leaves treated with P-Ca, another inhibitor of gibberellin synthesis, although the expression was lower compared to PBZ. In leaves applied with AG3, the expression was practically null, indicating that this regulator inhibited the expression of MiFT. The results agree with those obtained in sweet orange ‘Salustiana’ (Muñoz et al., 2012) and ‘Irwin’ mango (Nakagawa et al., 2012), where it is reported that gibberellins repress the expression of genes related to flowering as CiFT and MiFT, respectively.
Type of emerged growth. Regarding the type of growth emerged during the flowering period, a percentage of flower buds of 36, 51, 0 and 12% were found as a result of P-Ca, PBZ, AG3 and without control (control), respectively. Trees treated with AG3 had the highest percentage of vegetative shoots. The remainder of the outbreaks of each treatment
remained inactive with 57, 39, 74 and 73% in P-Ca, PBA, AG3 and control, respectively (Figure 5).

Figure 5 Percentage and type of growth emerged during the flowering period in bud of ‘Ataulfo’ mango by regulators effect. 2014. The bars at each point represent the average of 160 outbreaks per treatment ± standard error.
During the flowering period, the percentage of flower buds was higher when PBZ was applied, followed by those treated with P-Ca, although the percentage was lower compared to PBZ. Which coincides with the expression of MiFT in the two regulators. Probably by inhibiting the synthesis of gibberellins, PBZ and P-Ca favored the expression of the gene responsible for floral induction as reported by Nakagawa et al. (2012), these authors also demonstrated that MiFT is regulated by gibberellins by finding that the content of active gibberellins such as AG1 and AG4 was increased by downstream regulation of the MiGA3-ox and MiGA 20-ox, genes, inhibiting the expression of MiFT in leaves and therefore flowering on ‘Irwin’ mango trees with high yield.
On the other hand, in all treatments a large number of outbreaks remained inactive, although the percentage was 23 and 47% higher in outbreaks treated with AG3 and control with regard to P-Ca and PBZ. Bangerth (2009) mentions that in fruit trees the perenniality is given by the meristemos that remain vegetative, contrary to the annual plants where all meristems flourish at the same time with the inevitable death of the plants; however, in this study the majority remained inactive, which could be due to the fact that the environmental conditions during November, when induction and floral initiation in mango (Pérez et al., 2009), were normally not adequate for flowering (temperatures above 20 °C and presence of rain).
However, despite these environmental conditions, with the application of inhibitors of gibberellins, but especially with PBZ, an adequate percentage of floral shoots was achieved. In outbreaks with AG 3, there was no flowering, which coincided with the lack of expression of MiFT, which corroborates the antagonistic effect of this regulator on the flowering of mango and other fruit trees as mentioned by Nakagawa et al. (2012) in mango ‘Irwin’ and Muñoz et al. (2012) in sweet orange ‘Salustiana’.
Conclusions
In mature leaves of ‘Ataulfo’ mango, the MiFT gene is expressed in greater quantity on the sunny side, whereas on the shaded side it is expressed in lesser quantity so we could say that this gene is regulated by light and that the shading inhibits its expression.
The highest expression of MiFT was achieved in the months with cold temperatures (≤20 °C). PBZ and P-Ca favored the expression of the gene, probably through its effect on the inhibition of gibberellin synthesis, favoring a greater flowering
A higher percentage of flowering was achieved on the sunny side, coinciding with the greater expression of the MIFT gene.
It was demonstrated that the application of gibberellins inhibited the expression of MiFT and therefore floral bud.
Literatura citada
Anónimo 2007. 260/280 and 260/230 Ratios NanoDrop® ND-1000 and ND-8000 8- Sample. Spectrophotometers. NanoDrop and design are registered trademarks of NanoDrop Technical Support Bulletin T009. Technologies Wilmington, Delaware USA ©2007 NanoDrop Technologies, Inc. http://www.nanodrop.com. [ Links ]
Bangerth, K. F. 2009. Floral induction in mature, perennial angiosperm fruit trees: Similarities and discrepancies with annual/biennial plants and the involvement of plant hormones. Scientia Hortic. 122:153-163. [ Links ]
Brunner, A. M. and Nilsson, O. 2004. Revisiting tree maturation and floral initiation in the poplar functional genomics era. New Phytol. 164(1):43-51. [ Links ]
Corbesier, L.; Vincent, C.; Jang, S.; Fornara, F.; Fan, Q.; Searle, I.; Giakountis, A.; Farrona, S.; Gissot, L.; Turnbull, C. G. N. and Coupland, G. 2007. FT protein movement contributes to long-distance signaling in floral induction of Arabidopsis. Science. 316(8):1030-1033. [ Links ]
Davenport, T. L. and Ying, Z. 2004. Translocation of the mango florigenic promoter. HortScience . 39(4):887-898. [ Links ]
Davenport, T. L. ; Ying, Z. and Kulkarni, V. 2006. Evidence for a translocatable florigenic promoter in mango. Scientia Hort. 110(2):150-159. [ Links ]
Davenport, T. L. 2007. Reproductive physiology of mango. Braz. J. Plant Physiol. 19(4):363-376. [ Links ]
Endo, T.; Shimada, T.; Fujii, H.; Kobayashi, Y.; Araki, T. and Omura, M. 2005. Ectopic expression of an FT homolog from citrus confers an early flowering phenotype on trifoliate orange (Poncirus trifoliata L. Raf.). Transgenic Research. 14(5): 703-712. [ Links ]
Falcon, L. I. y Valera, A. 2007. Extracción de ácidos nucleicos. In: ecología molecular. Eguiarte, L. E.; Souza, V. y Aguirre, X. (Comp.). (SEMARNAT- INECOL-UNAM-CONABIO). 1ra, Edición, México, D. F. 499-516 pp. [ Links ]
Kittikorn, M.; Okawa, K.; Ohara, H.; Kotoda, N.; Wada, M.; Yokoyama, M.; Ifuku, O.; Yoshida, S. and Kondo, S. 2011. Effects of fruit load, shading, and 9,10-ketol-octadecadienoic acid (KODA) application on MdTFL1 and MdFT1 genes in apple buds. Plant Growth Regul. 64(1):75-81. [ Links ]
Livak, K. J. and Schmittgen, T. D. 2001. Analysis of relative gene expression data using real -time quantitative PCR and the 22DDCT Method. Methods 25(4):402-408. [ Links ]
Muñoz, F. N; Mesejo, C.; González-Mas, M. C.; Primo-Millo, E.; Agustí, M. and Iglesias, D. J. 2011. Fruit regulates seasonal expression of flowering genes in alternate-bearing Moncada’ mandarin. Ann. Bot. 108(3):511-519. [ Links ]
Muñoz, F. N .; Mesejo, C. ; González-Mas, M. C. ; Iglesias, D. J. ; Primo-Millo, E. and Agust, M. 2012. Gibberellic acid reduces flowering intensity in sweet orange [Citrus sinensis (L.) Osbeck] by repressing CiFT Gene Expression. J. Plant Growth Reg. 31(4):529-536. [ Links ]
Nakagawa, M.; Honsho, C.; Kanzaki, S.; Shimizu, K. and Utsunomiya, N. 2012. Isolation and expression analysis of FLOWERING LOCUS T-like and gibberellin metabolism genes in biennial-bearing mango trees. Sci. Hortic. 139:108-117. [ Links ]
Nishikawa, F.; Endo, T.; Shimada, T.; Fuji, H.; Shimizu, T.; Omura, M. and Ikoma, Y. 2007. Increased CiFT abundance in the stem correlates with floral induction by low temperature in Satsuma mandarin (Citrus unshiu Marc.). J. Exp. Bot. 58(14):3915-3927. [ Links ]
Peña, L. L.; Martín-Trillo, M.; Juárez, J.; Pina, J. A.; Navarro, L. and Martínez-Zapater, J. M. 2001. Constitutive expression of Arabidopsis LEAFY or APETALA1 genes in citrus reduces their generation time. Nature Biotechnol. 19:263-267. [ Links ]
Pérez, B. M. H.; Vázquez, V. V. and Osuna, G. J. A. 2009. Floral bud development of ‘Tommy Atkis’ mango under tropical condition in Nayarit, Mexico. Acta Hortic. 820:197-204. [ Links ]
Pillitteri, L. J.; Lovatt, C. J. and Walling, L. L. 2004. Isolation and characterization of a terminal flower homolog and its correlation with juvenility in citrus. Plant Physiol. 135(3): 1540-1551. [ Links ]
Ramirez, F. and Davenport, T. L. 2010. Mango (Mangifera indica L.) flowering physiology. Sci. Hortic . 126(2): 65-72. [ Links ]
Wilfinger, W. W.; Mackey, K. and Chomczynski, P. 1997. Effect of pH and ionic strength on the spectrophotometric assessment of nucleic acid purity. BioTechniques. 22(3):474-481. [ Links ]
Wilkie, J. D.; Sedgley, M. and Olesen, T. 2008. Regulation of initiation in horticultural trees. J. Exp. Bot . 59(12): 3215-3228. [ Links ]
Zeevaart, J. A. 2008. Leaf-produced floral signals. Current Opinion in Plant Biology. 11(5):541-547. [ Links ]
Received: March 00, 2017; Accepted: May 00, 2017
 Este es un artículo publicado en acceso abierto bajo una licencia Creative Commons
