


Services on Demand
Journal
Article
 text in
  English (pdf)
 Article in xml format
 Article references
 Send this article by e-mail
Indicators
-
 Cited by SciELO
 -
 Access statistics
Related links
-
 Similars in
SciELO
Similars in
SciELO
Share

 Permalink
Revista mexicana de ciencias agrícolas
Print version ISSN 2007-0934
Rev. Mex. Cienc. Agríc vol.8 n.6 Texcoco Aug./Sep. 2017
Articles
Conventional versus automatic weather station evaluated differences with statistical indixes Chapingo, Mexico
1Universidad Autónoma Chapingo-Departamento de Irrigación. Sección Meteorología Agrícola. Carretera México-Texcoco km 38.5. Estado de México, México. CP. 56230. Tel: 01 (595) 9521500, ext. 5157. (rarteagar@taurus.chapingo.mx; mvazquezp@correo.chapingo.mx)
2Instituto Nacional de Investigaciones Forestales, Agrícolas y Pecuarias, Campo Experimental Valle de México, Carretera Los Reyes-Texcoco km 13.5. Coatlinchán, Texcoco, Estado de México, México. CP. 56230, AP. 307 y 10. Tel. 01 (800) 0882222, ext. 85565. (cervantes.osornio@gmail.com).
3Instituto Mexicano de Tecnología del Agua. Paseo Cuauhnáhuac 8532, Colonia Progreso, Jiutepec, Morelos, México. CP. 62550. Tel. 01 (777) 3293600, ext. 445 (wojeda@tlaloc.imta.mx).
The objective of this research was to compare the meteorological data measured by a conventional station against the same but obtained by an automatic one, both stations are located at Universidad Autónoma Chapingo, these data were: maximum temperature, minimum, maximum relative humidity and mínimum, theses were collected on a daily basis and analyzed graphically and statistically, by means of the inconsistency and consistency coefficient, the square root of the mean square error and normalized, the concordance index or Willmott, the determination coefficient, a regression analysis, systematic error and random error, of the period from January 2004 to June, 2013. It was found that for the variables maximum temperature and minimum temperature, the data of the automatic meteorological station or those of the conventional one can be used without distinction since the data are similar.
Keywords: automatic station; comparison; conventional
El objetivo del presente trabajo fue realizar la comparación de los datos meteorológicos medidos por una estación convencional contra los mismos obtenidos por una automática, ambas estaciones están ubicadas en la Universidad Autónoma Chapingo, estos datos fueron: temperatura máxima, mínima, humedad relativa máxima y mínima, colectados de manera diaria y analizados de forma gráfica y estadística, por medio del coeficiente de inconsistencia y consistencia, la raíz cuadrada del cuadrado medio del error y normalizado, el índice de concordancia o Willmott, el coeficiente de determinación, un análisis de regresión, error sistemático y error aleatorio, el periodo comprendido de enero 2004 a junio, 2013. Se encontró, que para las variables temperatura máxima y temperatura mínima, se pueden usar indistintamente los datos de la estación meteorológica automática o los de la convencional ya que los datos son semejantes.
Palabras clave: comparación; convencional; estación automática
Introduction
The availability of reliable and representative meteorological information for an area contributes to good planning in urban planning, engineering or land-use planning. It is also used for weather analysis, forecasting, extreme weather warnings, local operations that depend on climate (in the airport or a flight, construction works on land and sea). In agriculture it is important for: the estimation of reference evapotranspiration, to estimate the water consumption. The essential variables or climatic elements in an meteorological station to be measured are: temperature, air humidity, wind, solar radiation, precipitation and evaporation, it is necessary to determine the value of the collected information in relation to its usefulness and purpose and the measuring instruments must be approved, be robust and well calibrated (Romo and Arteaga, 1989; WMO, 1993; Elias and Castellvi, 2001; Texeira et al., 2003; WMO, 2008; Funari et al., 2010).
Meteorological services have traditionally used conventional stations (EC) but in recent years the use of automatic stations (AE) has been increasing. The automatic stations contribute to improve the standardization of meteorological information, since they eliminate some problems of the traditional system such as observer subjectivity and typing errors (Ureña-Elizondo, 2011, SE, 2013). In México, the Servicio Meteorológico Nacional (SMN) reports that in the period from 1990 to 2004 there were 94 automatic stations and from 2005 to 2010 the network of automatic stations was expanded to 133 and 30 automatic synoptic stations were installed (CONAGUA, 2010).
However, WMO (1993) states that there must be a parallel operation between conventional and automatic stations and indicates that a year of simultaneous measures is not sufficient and recommends that they operate for at least two years according to the climatic region, WMO (2008) points out that when an EA is going to replace an EC that has been operating for an extended period, there must be enough overlap between the observations of both stations depending on the variable in question, 12 months are recommended for speed and direction of the wind, 24 for temperature, humidity, insolation and evaporation, and 60 for precipitation or as a general rule to measure in parallel for at least two seasonal periods (24 months).
The meteorological station located in the area of Meteorología Agrícola del Departamento de Irrigación de la Universidad Autónoma Chapingo (UACH), records data in its conventional station since 1924 until today and began automatically in the year 2003. However, it is necessary to compare information from a conventional and an automatic station, as mentioned by the World Meteorological Organization (WMO, 2008), it is also important to minimize the effect of changing an instrument in the measurement before replacing the observations obtained with the new instrument.
According to the above, the objective of this paper was to compare the daily data of: maximum temperature, minimum temperature, maximum relative humidity and minimum relative humidity, measured in a conventional way against simultaneous measured automatically by means of a graphic analysis and different statistical indicators for automatic (EA) and conventional (EC) meteorological stations, located at the section of Meteorología Agrícola del Departamento de Irrigación de la Universidad Autónoma Chapingo (UACH).
Materials and methods
The data used for this paper were obtained in two stages in the first one, daily data were obtained from the conventional meteorological station of maximum relative humidity, minimum relative humidity, maximum temperature and minimum temperature (end of January 2004 to June of 2013), in the second, the same data were obtained with the automatic station, since it records its data for periods of thirty minutes of each day of the year, data were calculated per day, for the whole year and for the indicated period.
Pre-processing of the data on a daily basis was carried out with Microsoft Office Excel®, and the shown graphs were generated from Matlab®. The coordinates of the station are: north latitude 19° 29’ 05’’, altitude 2 250 masl and longitude 98° 53’ 1’’. The technical specifications of the different instruments for the measurement of the different variables, as well as its sensor element are shown in Table 1 for the automatic and conventional meteorological stations.

Table 1 Technical specifications of the sensors of the conventional and automatic station of the agrometeorological station of the Department of Irrigation of the Universidad Autónoma Chapingo.
Statistical used to evaluate the comparison of EA versus EC
To compare the meteorological data of the automatic station against its conventionally obtained concurrent were used as statistical indicators: the inconsistency coefficient (CI), the consistency coefficient (CC), the concordance index or Willmott (d), the square root of the mean square error (RCCME) and normalized (RCCMEN), the determination coefficient (R2), the systematic error (Es) and random error (Ea), further analysis was performed by simple linear regression with ordinate to the origin, and the differences of EA minus EC for each of the study variables were plotted. These statistics are described below:
Inconsistency and consistency coefficient.
Where: CI = is the coefficient of inconsistency, dimensionless; V= represents the statistical-mathematical operator of the variance; X is the value of the variable from the automatic measurement and X* the value of the variable from the conventional measurement (Gattinoni et al., 2011) and CC = 1- CI, where CC is the coefficient of consistency, dimensionless.
Colotti et al. (2003) indicate that if there is no linear correlation between the two sets of measurements C(X, X*)= 0 then:
Also demonstrate that if r= 0, there is no linear correlation between the sample sets and therefore measurements are relatively independent. That is, there is a total incompatibility or inconsistency between the records of a conventional station and those of an automatic station. On the other hand if the linear correlation, r, was equal to 1, it implies that X = X* and therefore V (X-X*)= 0, this means that the coefficient of inconsistency, according to the above equation is zero. In summary inconsistency coefficient according Colotti et al. (2003) would vary as follows:
If r(X, X*) = 1 ⇒ C1= 0 ⇒ linearly dependent samples.
If r(X, X*) = 0 ⇒ C1= 1 ⇒ totally independent samples.
Willmott or concordance index.
Where: d = the concordance index or Willmott (Willmott et al., 1985); Pi= is the data collected from the EC; Oi= is the data collected from the EA; ō= is the average data value of EA; n= is the total number of data.
Square root of the mean square of the error and normalized.
Where: RCCME= is the square root of the mean square error; RCCMEN= is the square root of the mean square of the standard error (Pereira et al., 2008; Oliveira et al., 2010).
Correlation and determination coefficient. The correlation coefficient, R, is given by.
Where:= P= the average of data collected from the EC and the determination coefficient by R2, if the value measured in EA is equal to the EC, then RCCME= 0 and R2= d= 1 (Pereira et al., 2008).
Systematic error (Es) (Oliveira et al., 2010).
Random error (Ea)
Where: Pi= a+bOi, a and b are the linear and angular regression coefficients; Pi= is the predicted value (EC); Oi = observed value (EA); n= total number of data.
Simple linear regression. The linear regression analysis, with ordinate to the origin, between data from conventional station versus automatic, were performed: y = bx, where b is the parameter of the regression model, y and x are independent and dependent or regressive variable respectively, resulting in maximum accuracy when b= 1, and R2 = 1 (Strassburger et al., 2011).
Results and discussion
In the graphical comparison between the data from the EC and those of the EA for the whole period and for each of the variables, the maximum temperature is observed where the values of both stations are very similar throughout the period, but those of the EA are smaller (Figure 1a), and it is observed that for the minimum temperature on most days the values differ little but the EA data are higher (Figure 1b). For the maximum relative humidity (Figure 1c) it is observed that the data of the conventional station reaches values close to 100% and the values of the EA are smaller than these, that is to say, the values of the EA do not show values of 100% and are always below the EC about 13%.

Figure 1 Data Series from 2004 to 2013 for) Tmax, b) Tmin, c)HRMax, d) HRMin, both EA and EC station.
In Figure 1d) the data of the minimum relative humidity of the EA are 10% higher than those of the EC. This presupposes that the EA sensor could have a failure, since according to Allen et al. (1998), generally before the sun rises, the temperature of the dew point is similar to the minimum temperature, therefore the relative humidity reaches values at 100% or near this value.
Figure 2 shows the differences in the data of each of the variables measured by both stations. In Figure 2a)are shown the differences of the data of maximum temperatures of the EA-EC and most of them are in the range from 0 to -2, this indicates that EC data are larger than those of the EA, which coincides with the results reported by Pereira et al. (2008); Oliveira et al. (2010).

Figure 2 Differences of the variables data of both stations.Figures 2a) and 2b) differences of the variables maximum and minimum temperature (EA-EC),respectively. Figures 2c) and 3d) differences of the maximum and minimum relative humidity variables (EA-EC), respectively.
Figure 2b) shows the differences of the minimum temperatures data of EA-EC and most of them are in the range of 2 to 0. In this case the data of the EA are higher, which differs with was found by Pereira et al. (2008), for this variable.
When comparing the differences of the maximum temperature (Figure 2a) with those of minimum temperature (Figure 2b), the latter have a wider dispersion range for the entire period, the spectrum range of the maximum temperature differences would be reduced if the extreme value shown was eliminated.
The differences in the maximum relative humidity data of EA-EC are included in Figure 2c) where most of them are in the range of 0 to -20. Finally, most of the differences in the minimum relative humidity data (Figure 2d) range from 20 to 0. When comparing the differences between the maximum relative humidity and those of the minimum relative humidity, the latter have a lower dispersion and less wide differences than the maximum relative humidity variable.
According to the statistics shown in Table 2, corresponding to the whole period (2004-2013), the variable measured simultaneously by the EC and EA that widely differ in its measurements is the maximum relative humidity. Similar results were found by Oliveira et al. (2010) for the statistical: d, RCCME, Es and Ea for the average relative humidity measured simultaneously by EC and EA for the period of July 1997 to June 2002 in Jaboticabal-SP in Brazil and this difference is attributed to the fact that the measuring devices used by each station are different. Also these authors, for maximum temperature and minimum temperature found values with better fit for the statistics: d, RCCME, Es and Ea, which are similar to those shown in Table 2 for the same variables.
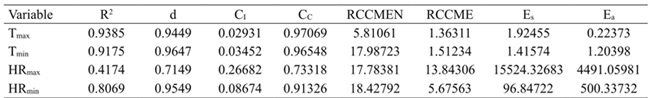
R2= Coeficiente de determinación; d= índice de Willmott; CI= coeficiente de inconsistencia; CC = coeficiente de consistencia; RCCMEN= raíz cuadrada del cuadrado medio del error normalizado; RCCME= raíz cuadrada del cuadrado medio del error; Es= error sistemático; Ea= error aleatorio.
Table 2 Coefficient for the maximum temperature, minimum, maximum relative humidity and minimum for the period 2004-2013.
Table 2, shows that the variable that obtained the best fit according to the statistics used for the whole period was the maximum temperature, followed by the minimum temperature, then the minimum relative humidity and finally the maximum relative humidity. Almeida and Hermenegidio (2013) made a comparison of the variables air temperature, relative humidity and precipitation between January 1st, 2006 and December 31st, 2008, observations were compared in the form of coordinated time units (UTC) of 12 , 18 and 24 (hours), the coefficients of determination (R2) found for air temperature at 12, 18 and 24 were: 0.87, 0.95 and 0.76, and for relative humidity: 0.85, 0.93 and 0.81 respectively and they also performed a linear regression model of the average relative humidity between EC and EA with an R2 of 0.834, and for minimum and maximum temperature the R2 was 0.932 and 0.989, respectively, the setting for these two last variables was better than the average relative humidity, results similar to those found in this work.
Pereira et al. (2008) and Oliveira et al. (2010) found RCCMEN values for Tmax of 1.47 and 3.84 respectively while in this research it was 5.81, which indicates a minimal difference between the results. These authors used the mean relative humidity and obtained RCCMEN values of 13.19 and 8.66, respectively, while in this research the maximum relative humidity was 17.78 and for the minimum relative humidity 18.42 these results are higher because extreme values were used unlike those studies in which averages of the variable in question were used.
Systematic error values (Es) and random (Ea), for the maximum temperature that were obtained by Pereira et al. (2008), Oliveira et al. (2010) and in this research were: 0.167 and 0.010; 0.94 and 0.3; 1.92 and 0.22, respectively. Regarding these errors (Es y Ea), for the low temperature, Pereira et al. (2008) and Oliveira et al. (2010) obtained values of: 0.083 and 0.001; 0.91 and 1.63, respectively, whereas in this research were of: 1.42 and 1.2. Oliveira et al. (2010), for the average relative humidity found values of Es and Ea of 30.61 and 11.8, respectively, in this paper these error values of Es and Ea rose as high relative humidity and minimum relative humidity were used, which are extreme values, it is important to clarify that a mean hides these values.
The difference between the values of HRmax EA to EC for this type of study might be due to the slow response of the sensor due to the hysteresis phenomenon, in the range of 90% to 100%, as pointed by Estevez et al. (2011). The EA sensor is invariably below for the same value of EC, and the EA rarely registers values of 100%.
Another possible cause as pointed by Almeida and Hermenegidio (2013) quoted by Almeida et al. (2008), in an automatic meteorological station, in which the psychrometer does not exist, the relative humidity is obtained through an algorithm, or has only one thermistor without the wet bulb thermometer, therefore, the current steam pressure (ea) for the wet bulb is estimated by a polynomial, and since it is directly proportional to relative humidity, if there were a sub or overestimation of the actual vapor pressure, it would affects either in an increase or decrease in the relative humidity, so this may be the main cause of the difference. A recommendation by Allen (1996) in this regard is to duplicate the relative humidity sensors used in climatic stations with electronic devices, it is mentioned that this practice is expensive but can save consumptions in the time of problem solving and the concern related to the data integrity.
To define the variation of the inconsistency (CI) and consistency (CC) coefficients these were determined by year and are shown in Table 3. It is confirmed what was determined for the entire period, that the maximum temperature variable measured simultaneously for EC and EA, their data are more similar, since their inconsistency coefficients are the closest to zero for different years, is followed by the minimum temperature. For maximum temperatura CI closer to zero (CI= 0.00767) was reported for 2010, and the minimum temperature in 2005 (CI= 0.01041), consequently with its best adjustments of the consistency coefficients (CC= 0.99233 y CC= 0.98959, respectively). Furthermore it is confirmed that the data measured in both stations (EC and EA) for the maximum relative humidity are the ones that differ most and in 2013 the value closest to zero of the coefficient of inconsistency was reported (CI= 0.08109, CC= 0.91891).
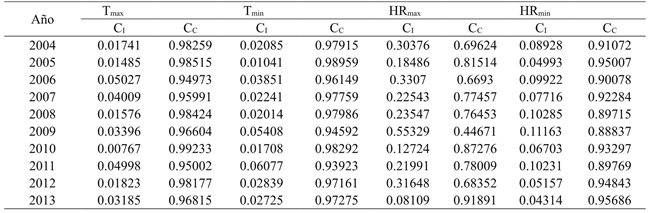
Table 3 Coefficients of inconsistency (CI) and consistency (CC) obtained annually from 2004 to 2013 for máximum and minimum temperature, minimum and maximum relative humidity.
For the minimum relative humidity variable its CI closest to zero was in 2013 (CI = 0.04314, CC= 0.95686). The farthest zero values indicate that data of the measured variable by both stations are different and correspond to CI obtained for different years for maximum relative humidity, when analyzing the daily data of high relative humidity (Figure 1c), it is logical since invariably the EA sensor of this variable was marking a data away from its simultaneous taken conventionally, the CI closest to the unit or where the data are very different, was reported for 2009 for HRmax (CI= 0.55329, CC= 0.44671).
With the information shown in Table 3, the general rule proposed by the WMO (2008) is confirmed, which is to measure in parallel at least two seasonal periods (24 months) the different variables measured by both stations but at the end of the two years of measurements it is important to perform an exercise like the one presented here, to define how similar the measurements of a variable measured by both stations are. As is the case of maximum and minimum temperatures, a decision can be made to suspend EC measurements, but not for maximum and minimum relative humidity.
As noted by Pereira et al. (2008), failures in the equipment that operate automatically causes losses in the data collection, with the consequent need to use the data from conventional stations, on the other hand the current trends are that new technologies are replacing the conventional processes, and is a consequence of the difficulties to maintain the personnel by the institutions that operate these stations networks. However, a replacement of conventional stations by automatic requires careful homogenisation especially in the data series (Sentelhas et al., 1997; Pereira et al., 2008).
Finally, a regression analysis with an ordinate was performed for the different variables (Figures 3a, 3b, 3c and 3d), it was observed that, for the maximum relative humidity and for the minimum relative humidity R2 of 0.4174 and 0.8069 were obtained respectively, which coincides with that found by Scarpare et al. (2010), who found a R2= 0.469 for the mean relative humidity (d= 0.789) and the best fit was found for the mean temperature (R2= 0.993 and d= 0.968), this for a data period of 9 years and 9 months in Piracicaba/SP in Brazil, they also comment that there are significant differences in the measurements of their stations (EC and AE), probably due to the sensitivity differences of the sensors and to the difference of the data sample used for the calculation of the means Of EC and AE, and also indicate that other factors are: a) the different types of sensors used for both EA and EC; b) adequate calibration of the sensor; c) location of the station; and d) the analysis period of the measured data.

Figure 3 Linear regression, with ordinate to the origin, between data from the EA vs EC for 3a) Tmax and 3b) Tmin, and for 3c)HRmax and 3d), HRmin.
However, Cunha and Martins (2004) found R2 = 0.9537 for the average relative humidity, unlike what was found in this paper, they also found an overestimation of EA related to the EC, which does not coincide with HRmax in this paper, but for the HRmin and found for the average temperature an underestimation of EA data regarding EC, which coincides in this work with Tmax, but not for Tmin.
The coefficients of determination (R2), for the maximum and minimum temperatura (R2= 0.9385 and R2= 0.9175, respectively), show a high precision and accuracy, this matches what was found by Strassburger et al. (2011), for the same variables for the period December 22nd, 2005 to December 21st, 2006, with R2 up to 0.99, and as indicated, given the high values of R2 of the measures between automatic and conventional instruments for these variables, data can be used both from the conventional weather station and the automatic, similarly this matches with Pereira et al. (2008), who found high R2 of the measures between automatic and conventional sensors with R2= 0.9925 for maximum temperature and R2= 0.995 for minimum temperature.
Conclusions
The maximum temperature measured was the variable where the data are most similar between the two stations, EC and EA, for the whole period 2004-2013, followed by the minimum temperature variable. Since the data of maximum relative humidity, followed by the minimum relative humidity taken in the conventional way, showed significant differences with their automatically taken counterparts, it is recommended not to leave aside the data collection neither conventional nor automatic until they are correctly homologated, either by calibration or by other means.
Literatura citada
Allen, G. R. 1996. Assessing integrity of weather data for reference evapotranspiration estimation. J. Irrig. Drainage Eng.122(2):97-106. [ Links ]
Allen, G. R.; Pereira, S.L.; Raes, D. and Smith, M. 1998. Crop evapotranspiration guidelines for computing crop wáter requirements. Irrigation and drainage paper 56. Roma. 298 p. [ Links ]
Almeida, H. A.; Souza, J. A. e Alcântara, H. M. 2008. Análise comparativa de dados meteorológicos obtidos por estaҫão convencional e automática no semiárido paraibano. [ Links ]
Almeida, H. A. e Hermenegidio, G. M. S. 2013. Comparaҫão de dados meteorológicos obtidos por estaҫões meteorológicas convencional e automática. Ver. Brasil. Climatol. 12(1):32-47. [ Links ]
Colotti, B. E.; Blanco, T. A. y Rodríguez, G. J. 2003. Aplicación del coeficiente de inconsistencia como criterio de comparación entre mediciones convencionales y automáticas de lluvia diaria.Terra Nueva Etapa. 19(28):85-101. [ Links ]
CONAGUA (Comisión Nacional del Agua). 2010. Manual teórico práctico del observador meteorológico de superficie. Secretaria de medio ambiente y recursos naturales. México. 278 p. [ Links ]
Cunha, A. R. e Martins, D. 2004. Estudo comparativo entre elementos meteorológicos obtidos em estações meteorológicas convencional e automática em Botucatu, SP, Brasil. Rev. Bras.Agrometeorol. 12(1):103-111. [ Links ]
Elías y.Castellví, 2001. Agrometereología. 2ª. Edición. Ediciones Mundi-Prensa. Madrid, Barcelona, España. 517 p. [ Links ]
Estévez,J.; Gavilán, P. and Giráldez, V. J. 2011. Guidelines on validation procedures for meteorological data from automatic weather stations. J. Hydrol. 402:144-154. [ Links ]
Funari, F. L. e Pereira, F. A. J. 2010. Análise comparativa de medições de variáveis meteorológicas realizadas por estações meteorológicas convencional e automática instaladas no parque estadual das fontes do Ipiranga-São Paulo-SP. Rev. Bras. Climatol. 7:159-168. [ Links ]
Gattinoni, N.; Boca, T.; Rebella, C. y Di Bella. 2011. Comparación entre observaciones meteorológicas obtenidas de estaciones convencionales y automáticas a partir de la estimación de parámetros estadísticos. Revista Investigaciones Agropecuarias. 37(1):75-85. [ Links ]
Oliveira, D. A.; Almeida, M. B.; Junior, G. C. E.; Sobrinho, E. J. e Vieira,Y. M. R. 2010. Comparaҫão de dados meteorológicos obtidos por estaҫão convencional e automática em Jaboticabal-SP. Ver.Caatinga, Mossoró. 23(4):108-114. [ Links ]
Pereira, L. M. P.; Caramori, P. H.; Ricce, W. S. e Caviglione, J. H. 2008.Análise comparativa de dados meteorológicos obtidos por estaҫão convencional e automática em Londrina. Semina:Ciências Agrárias. 29(2):299-306. [ Links ]
Romo, G. J. R. y Arteaga, R. R. 1989. Meteorologia agrícola. Universidad Autónoma Chapingo (UACH). Departamento de Irrigación.442 p. [ Links ]
Scarpare, F. V.; Oliveira, G. X. S.; Simon, J.; Piedade, S. M. S. e Angelocci, L. R. 2010. Comparaҫão da uniformidade de dados meteorológicos de estaҫão meteorológica convencional e automática-Piracicaba/SP. In: Congreso Brasileiro de Meteorologia, 16, 2010, Belém-PA Anais..., Belém-PA:Sociedade Brasileira Meteorologia. [ Links ]
Willmott, C. J.; Ackleson, S. G. and Davis, R. E. 1985. Statistics for the evaluation and comparison of models. J. Geophys. Res.90(C5):8995-9005. [ Links ]
SE (Secretaría de Economía). 2013. NMX-AA-166/1-SCFI-2013.Estaciones meteorológicas, climatológicas e hidrológicas. Parte1: especificaciones técnicas que deben cumplir los materiales e instrumentos de medición de las estaciones meteorológicas automáticas y convencionales, México. 43 p. [ Links ]
Sentelhas, P. C.; Moraes, S. O.; Piedade, S. M. S.; Pereira, A. R.;Angelocci, L. R. e Marin, F. R. 1997. Análise comparativa de dados meteorológicos obtidos por estações convencional e automática. Ver. Bras. Agrometeorol. 5(2):215-221. [ Links ]
Strassburger, A. S.; Menezes, A.; Perleberg, T. D.; Eicholz, E. D.; Mendez,M. E. G. e Schöffel, E. R. 2011. Comparação da temperatura do ar obtida por estação meteorológica convencional e automática.Ver. Bras. Meteorol. 26(2):273-278. [ Links ]
Teixeira, A. H. C.; Bassoi, L. H.; Reis, V. C. S.; Silva, T. G. F.; Ferreira, M.N. L. e Maia, J. L. T. 2003. Estimativa do consumo hídrico da goiabeira, utilizando estações agrometeorológicas automática e convencional. Rev. Bras. Frutic. Jaboticabal-SP. 25(3):457-460. [ Links ]
Ureña, E. F. 2011. Utilización de estaciones meteorológicas automáticas como nueva alternativa para el registro y transmisión de datos.Rev. Posgrado y Sociedad. 11(1):33-49. [ Links ]
WMO (World Meteorological Organization). 1993. Guide on the global data-processing system. Geneva, Switzerland. Núm. 305. 204 p. [ Links ]
WMO (World Meteorological Organization). 2008. Guide to meteorological instruments and methods of observation. Núm.8. Geneva, Switzerland. [ Links ]
Willmott, C. J.; Ackleson, S. G. and Davis, R. E. 1985. Statistics for the evaluation and comparison of models. J. Geog. Res.90(5):8995-9005. [ Links ]
Received: April 2017; Accepted: June 2017
 Este es un artículo publicado en acceso abierto bajo una licencia Creative Commons
