


Services on Demand
Journal
Article
 text in
  English (pdf)
 Article in xml format
 Article references
 Send this article by e-mail
Indicators
-
 Cited by SciELO
 -
 Access statistics
Related links
-
 Similars in
SciELO
Similars in
SciELO
Share

 Permalink
Revista mexicana de ciencias agrícolas
Print version ISSN 2007-0934
Rev. Mex. Cienc. Agríc vol.7 spe 13 Texcoco Jan./Feb. 2016
Articles
Climate change indices in the state of Chiapas, Mexico, for the period 1960-2009
1 Campo Experimental Centro-Altos de Jalisco- INIFAP. Carretera Tepatitlán-Lagos de Moreno, km 8. Col. Rancho Las Cruces. Tepatitlán de Morelos, C. P. 47600. Tel: 01 800 0882222. (ruiz.ariel@inifap.gob.mx; flores.hugo@inifap.gob.mx; ramírez.gabriela@inifap.gob.mx; chávez.alvaro@inifap.gob.mx).
2 Centro Universitario de Ciencias Biológicas y Agropecuarias- Universidad de Guadalajara, Camino Ing. Ramón Padilla Sánchez 2100, poblado La Venta del Astillero, Zapopan, Jalisco. Tel: (33) 37 77 11 50 Ext. 33016. (pzarazua@cucba.udg.mx).
3 Campo Experimental Zacatecas- INIFAP. Carretera Fresnillo-Zacatecas, km 24.5 Calera de Víctor Rosales. C. P. 98500. Tel: (478) 985 01 98. (medina.guillermo@inifap.gob.mx).
4 Campo Experimental Pabellón- INIFAP. Carretera Aguascalientes-Zacatecas, km 32.5. Pabellón de Arteaga, C. P. 20660. Tel: (465) 958 01 67. (rodriguez.victor@inifap.gob.mx).
In the last three decades warm periods have been higher than the average values. The trend of climate indices based on the minimum and maximum temperature and precipitation recorded at meteorological stations in the state of Chiapas, Mexico, in the period from 1960 to 2009 were determined. The time series data from 16 weather stations distributed through Chiapas were used. To obtain climatic indices, the RClimDex module was used. The results showed that the number of stations with significant positive trend is higher than the number of stations with significant negative trend, from the 16 weather stations analyzed and 8 indices, 42 combinations had significant positive trend, while 18 had significant negative trend. It was observed that 63% of the stations analyzed were significant positive for extreme maximum temperature (TXx), 50% for diurnal temperature range (DTR), 44% for lower maximum temperature (TXN), 38% for number of days with minimum temperature below 20 °C (TR20), 31% for higher minimum temperature (TNx), 25% for extreme minimum temperature (TNn) and only 6% for number of days with maximum temperature above 25 ° C (SU25) and number of consecutive days without rain (CDD) respectively. In mapping the results no trends were observed in any specific area of th estate. All indices based on temperature showed similar behavior patterns and consistent with overall warming trend: These findings are consistent with previous studies in the region and elsewhere.
Keywords: climate change; Chiapas; temperature; trend
En las últimas tres décadas los periodos cálidos han sido superiores a los valores promedio. Se determinó la tendencia de los índices climáticos basados en las temperaturas máximas mínimas y precipitación registradas en las estaciones meteorológicas en el estado de Chiapas, México, en el periodo de 1960 a 2009. Se utilizó la serie histórica de datos de 16 estaciones climatológicas distribuidas en el estado de Chiapas. Para la obtención de los índices climáticos, se utilizó el módulo RClimDex. Los resultados mostraron que el número de estaciones con tendencia positiva significativa es mayor que el número de estaciones con tendencia negativa significativa, de las 16 estaciones climáticas analizadas y 8 índices, 42 combinaciones presentaron tendencia positiva significativa, mientras que sólo 18 presentaron tendencia negativa significativa. Se observó que 63% de las estaciones analizadas resultaron positivas significativas para temperatura máxima extrema (TXx), el 50% para rango diurno de temperatura (DTR), el 44% para temperatura máxima más baja (TXn), el 38% para número de días con temperatura mínima menor que 20°C (TR20), 31% para temperatura mínima más alta (TNx), 25% para temperatura mínima extrema (TNn) y sólo el 6% para número de días con temperatura máxima mayor que 25 °C (SU25) y número de días consecutivos sin lluvia (CDD) respectivamente. En el mapeo de los resultados no se observaron tendencias en alguna zona específica del estado. Todos los índices basados en la temperatura mostraron patrones de comportamiento similar y consistente con tendencia general al calentamiento: Estos hallazgos son consistentes con estudios previos en la región y en otras partes del mundo.
Palabras clave: cambio climático; Chiapas; tendencia; temperatura
Introduction
Climate change is one of the most topical problems worldwide. According to the Intergovernmental Panel on Climate Change (IPCC, 2007), in the past 100 years the global temperature has increased by 0.74 °C. Yu et al. (2015) mention that in the last 30 years the warm periods were higher than the average, as a result it is expected that the frequency and intensity of extreme temperatures increase. The impact of extreme weather occurs largely in natural disasters such as flooding, heat waves and fire.
This impact happens regularly when extreme weather occurs with some regularity and intensity, causing ecological disasters and negatively affecting society (Degefie et al., 2014). One of the main causes of the increase in average temperature on the planet is the emission of greenhouse gases from human activities (IPCC, 2007). The ocean warming, increased continental temperatures, extreme temperature and behavior patterns of the winds are influenced by this phenomenon and can result in unprecedented extreme climate (IPCC, 2012).
Furthermore, the biogeochemical processes as the case of carbon and nitrogen cycle can be controlled by heat waves, which can change the function of these processes affecting the ecosystem (Degefie et al., 2014). Arnone et al. (2008) observed that the increase in the frequency of warm years decreased CO2 uptake from terrestrial ecosystem. Studies in different parts of the world using simulation models related to weather events, confirm the trend of more frequent and severe extreme events in the future (Schar et al., 2004; Meehl et al., 2005; Tebaldi et al., 2006; Koutroulis et al., 2013). Other recent studies report a decrease in the frequency of extreme cold and increase of temperature both day and night (Acquaotta et al., 2010; Wang et al., 2013).
It is also reported that in the last 50 years has decreased the number of cold nights and the number of warm nights is increasing in 70% of the planet (Alexander et al., 2006).
In the United States, Griffiths and Bradley (2007) studied the indicators of changes in extreme weather conditions in the Northeast region, noticing an increasing trend of heat waves. Furthermore, the IPCC (2007) mentioned Mexico's vulnerability to climate change, noting that in northwest Mexico and southwest United States, the problem of water scarcity may be exacerbated due to increased temperature and reduced precipitation (Cavazos and Arriaga-Ramirez, 2012). According to Magaña et al. (2012) regions with greatest risk of increased average annual temperature are expected to occur in northeastern and northwestern Mexico (Magaña et al., 2012).
However, several studies on extreme temperatures in Mexico, mentioned that after 1970, there was a significant increase in the maximum temperature compared to minimum temperatures, especially in Northwest and Central regions of Mexico, which showed contrasting trends regarding the rest of the country (Englehart and Douglas, 2005; Pavia et al., 2008; Gutierrez-Ruacho et al., 2010).
Studies made by Peralta-Hernández et al. (2009) in southeastern Mexico, showed significant trend in the increase of the maximum temperatures in the region, as well as in the frequency of warm days. Despite the importance of this issue, there is no information on trends from climate change in indices in the state of Chiapas. Therefore, the objective of this study was to determine the trends of climate indices, based on maximum temperature, minimum temperature and precipitation recorded in the meteorological stations in the state of Chiapas, for the period 1960-2009.
Materials and methods
Description of the study area
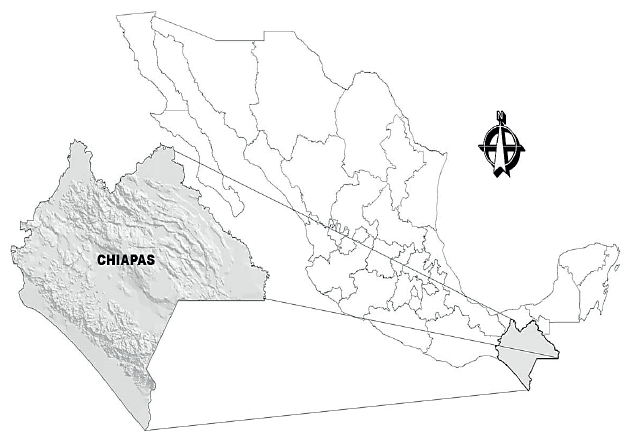
The state of Chiapas is located south of Mexico, bordered to the north by Tabasco, to the south by the Pacific Ocean, on the east by the Republic of Guatemala and to the west by the states of Oaxaca and Veracruz (Figure 1). It is located between 14° 39' and 17° 57' north latitude and 90° 22' and 94° 08' west longitude, its geography is variable, has high mountains, plateaus, mountains, hills, valleys and coasts. The altitude in the state of Chiapas ranges from 0 m on the border with the sea, to a little more than 4 000 m in the Tacana Volcano. The climatic types of largest land area are warm tropical and warm humid tropical, but are also represented other climatic variations such as humid subtropical temperate and semi-warm humid subtropical, among others (Medina et al., 1998).
For this study the information from 16 weather stations spread across the state of Chiapas, with records for the years 1960 to 2009 were used. For data analysis considered the following criteria: 30 years or more of information; 95% or more data; removal of years with 3 months or more without data; removal of weather stations with several consecutive years without data. Figure 2 shows the location of weather stations from which information was analyzed.

Quality and homogeneity of series
Data was subjected to quality control, using the RClimDex v. 1.0 module, implemented in R v. 3.0.1. Using this module, correction and deletion of data was made after comparing them with the values of neighboring stations on the same dates (Klein-Tank et al., 2009; Zhang and Feng, 2004). Homogeneity analysis and ruptures detection in the series of analyzed indices was made according to Wang (2008); F test maximum penalty using the RHTest v. 3.0 module for changes in undocumented data averages (Feng and Wang, 2010). In RHTest the homogenization process of the data series was also conducted with settings per quantile (QM), in cases where the data were not homogeneous (Wang et al., 2010). Once applied the quality analysis to data series, an analysis of descriptive statistics was performed to determine abnormalities in thermal and precipitation variables using the normal climatic values according to the criteria established by WMO in a 50 years period.
Determination of climatic indices. For this document 8 out of 27 climate indices established by the “expert team on climate change detection and indices" (ETCCDI) were selected (Vazquez, 2010; Zhang et al., 2011). The selected climate indices were those related to temperature and precipitation (Table 1). The indices were obtained from the RClimDex module developed by the Climate Research Department from the Meteorological Service of Canada and implemented in R version 3.0.1 (Zhang and Feng, 2004). The RClimDex provides data on monthly or yearly basis, temperature thresholds were as follows; 25 °C for maximum daily temperature and 20 °C as higher daily minimum temperature threshold. After obtaining the indices, it proceeded to perform a correlation analysis with the slope values of the trends of each index for the 16 weather stations analyzed, since it was considered that these are values of the same type for all variables, therefore were not standardized. To evaluate the tendency of these climate indices in the state of Chiapas, the values of each index for all weather stations were averaged, obtaining annual values. With these values were developed trend charts for the 8 indices using a four years moving average.

Results and discussion
The results from the number of stations showing positive and negative trends with significance level are shown in Table 2. As can be seen, from 16 stations analyzed 63% resulted positive significant to extreme maximum temperature, 50% for diurnal temperature range, 44% for lower maximum temperature, 38% for tropical nights, 31% for higher temperature minimum, 25% for extreme minimum temperature and only 6% for summer days and consecutive days without rain respectively. Finally the consecutive days without rain or CDD index, presented one weather station with significant positive trend, which represents 6% of all analyzed stations. However, the days without rain or with rain <1 mm in the state of Chiapas are on average 63 days, meaning that most of the year (302 days) there were rains above > 1 mm in the period under study.
Table 2 Number of weather stations showing positive trend, negative trend, significant positive trend and significant negative trend.

Also in Table 2, it is observed that the number of stations with significant positive trend is higher than the significant negative trend, of the 16 weather stations analyzed and 8 indices, 42 combinations showed significant positive trend, while 18 had significant negative trend. Climate indices that showed the highest number of weather stations with a significant trend correspond to the maximum extreme temperature or TXx with 10 stations, diurnal temperature range or DTR with 8 stations and the lowest maximum temperature TXn with 7 stations.
These results are similar to those reported by Peralta- Hernández et al. (2009) in southeastern Mexico, showing significant trends in increasing the maximum temperature and frequency of hot days. On the other hand, the results also agree with those found by Zarazúa et al. (2014), who mention a significant increase in the frequency of warmer night index in the last decades for the coastal plains of the Gulf of Mexico which includes the states of Veracruz, Tabasco and Campeche. Regarding climate tropical nights and summer days indices, in the period under study was observed that in the state of Chiapas there are summer days almost all year (98% of the year), while tropical nights occur less (77% of year).
Furthermore, the results found in this research are consistent with those reported by Yu and Li (2015), as these authors demonstrated significant positive trends in most of the stations analyzed taking into account the summer days and tropical night indices, thus TNn and TNx during the period 1960-2011 in northeast China. However, it is noteworthy that the number of stations and the scale they used were higher than the ones studied in this work, which can represent significant differences by including information from a greater number of weather stations.
The mean and standard deviation obtained from the different climate indices are presented in Table 4.
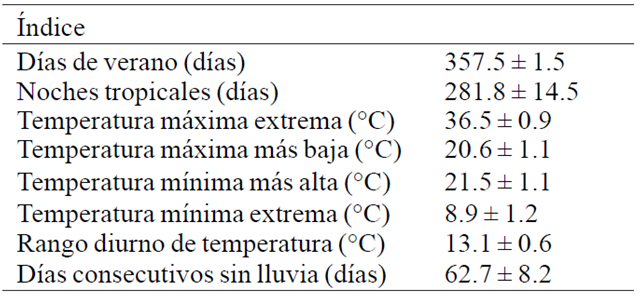
Figure 3 shows the trend of each climate index analyzed, using the four year moving average. It can be seen that the indexes showed different behaviors, for example for summer days index presented in Figure 7a showing an increasing trend with marked oscillations, presenting more pronounced peak values both increase and decrease, generally observing annual variations with a tendency to increase from 2008. However, the difference between 1960 and 2009 was 3 days, being 1976 the year with the lowest average with 354 days and 2009 the highest with 363 days. Figure 3b presents the frequency trend of summer days, it can be observed a slight trend towards increase, the results showed that the highest average was recorded in 1994 with 310 days, while the lowest was in 1968 with 250 days. The results found in this study agree with those reported by Wang et al. (2013), these authors found significant positive trend for summer days and tropical nights on 53 and 46% of the stations analyzed in the period 1960-2010, in the arid region of China, reporting that the magnitude of the regional trend was 1.96 and 1.59 days/decade.

Figure 3 Trend of climate indices, a) summer days; b) tropical nights; c) maximum extreme temperature; d) higher minimum temperature; e) lower maximum temperature; f) minimum temperature extreme; g) diurnal temperature range; and h) consecutive days without rain
The tendency of extreme high temperature or TXx is shown in Figure 3c, the highest value was present in 3 different years, 1986, 2003 and 2009 with values of 38 °C and the lowest in 1999 with 34 °C, a difference of 4 °C. Figure 3c shows the oscillations in average temperature but with a clear trend towards increase. The trend of the highest minimum temperature (TNx) shown in Figure 3d, where it can be seen low variability in time series averages analyzed, however, there is a slight tendency to decrease. The highest temperature was recorded in 1968 with 23 °C and the lowest in 2009 with 17 °C, with a difference of 6 °C between the lowest and highest average. These results agree with those reported by Qiong et al. (2014) when analyzing the stations located in the region of the Yangtze River in China during 1962 to 2011, where it was reported that most of the stations showed significant positive trend (66%) and a lower percentage with significant negative trend (15%) for maximum extreme temperature.
Regarding the tendency of the lowest maximum temperature (TXn) shown in Figure 3e. It can be seen that in the period 1960-1980, this parameter did not present a defined trend; however, from 1980 to 2000, there was a slight increase. In the decade from 2000 to 2009 the trend was explained similarly to 1960-1980, decreasing. The highest temperature was recorded in 1987 and 1988 with 23 °C, while the lowest was in 1997 with 18 °C. These results do not agree with those reported by Qiong et al. (2014), as these authors found significant tendencies towards increase for TXn in 94% of the stations analyzed in the region of the Yangtze River in China during 1962-2011. The trend of extreme minimum temperature or TNn is shown in Figure 3f; variability in the data with marked oscillations along the time series analyzed was observed, peaks can be seen both temperature increase and decrease thereof.
The highest temperature occurred in the years 1969, 1990 and 1994 with a value of 11 °C, the lowest temperature was observed in 2008 with 5 °C. Overall there is a trend towards decline from 1960 to 2009.
The diurnal temperature range (DTR) trend along the time series analyzed is shown in Figure 3f. Over the years little variability was observed, but with a clear tendency to increase, the highest temperature was recorded in 2007 and 2009 with a temperature of 15 °C, while the lowest was in 1961, 1963 and 1999 with temperature of 12 °C. These results do not agree with those reported by Wang et al. (2013), since this author mentions that about 75% of the stations analyzed showed significant trend to decrease the diurnal temperature range in the arid zone from China. However, mentions the importance of examining the data series seasonally instead of annually.
Finally, Figure 3h shows the precipitation trend (CDD), the records showed that the lowest average for CDD was in 2000 with 44 days, while the highest was in 2003 with 80 days. There were oscillations both to increase and decrease of CDD, no marked trends were observed, only slight decrease, however this result agrees with that reported by Gimesi (2009), reporting that precipitation showed a slight downward trend globally in Eastern Europe; however, did not observed a clear trend when analyzing the data series on annual or seasonal basis. Also, mentions that is worth noting how precipitation decreased in June, but at the same time increased in July in the period of study.
Figure 4 presents the 4 climate indices that obtained the highest number of stations with significant positive trend in the state of Chiapas. Unfortunately in the Eastern region of the state of Chiapas there was not enough information from the weather stations, so that the calculation of the indices was not performed. However, considering the stations taken into account in this study, it was observed that a large number of stations showed a tendency to increase in temperature, as in the case of the maximum temperature extreme and tropical nights (Figure 4a and 4b). Although on a smaller scale, the lower maximum temperature and diurnal temperature range indices had about 40% of the stations with significant positive trend. In general, there were no marked trends by region, since the stations with significant positive trend were present across the state.

Conclusions
Most of the indices analyzed showed tendency to increase, being the most important extreme maximum temperature, diurnal temperature range, lower maximum temperature and tropical nights. In mapping the results showed no regional trends. All indices based on temperature showed similar and consistent behavior patterns with overall tendency towards warming and these findings are consistent with previous studies in the region and elsewhere.
Literatura citada
Acquaotta, F.; Fratianni, S. and Garzena, D. 2015. Temperature changes in the North Western Italian Alps from 1961 to 2010. Theor Appl Climatol. 122:619-634. [ Links ]
Alexander, L. V.; Zhang, X. and Peterson, T. C. 2006. Global observed changes in daily climate extremes of temperature and precipitation. Journal of Geophysical Research. 111:1-22. [ Links ]
Arnone, J. A.; Verburg, P. S. J.; Johnson, D. W.; Larsen, J. D.; Jasoni, R. L.; Lucchesi, A. J.; Batts, C. M.; Von- Nagy, C.; Coulombe, W. G., Schorran, D. E.; Buck, P. E.; Braswell, B. H.; Coleman, J. S.; Sherry, R. A.; Wallace, L. L.; Luo, Y. and Schimel, D. S. 2008 Prolonged suppression of ecosystem carbon dioxide uptake after an anomalously warm year. Nature 455(7211):383-386. [ Links ]
Cavazos, T. and Arriaga-Ramírez, S. 2012. Downscaled Climate Change Scenarios for Baja California and the North American Monsoon during the Twenty-First Century. J. Climate. 25(17):5904-5915. [ Links ]
Degefie, T.; Fleischer, E.; Klemm, O.; Soromotin, A. V.; Soromotina, O. V.; Tolstikov, A. V. and Abramov, N. V. 2014. Climate extremes in South Western Siberia: past and future. Stoch Environ Res Risk Assess. 28:2161-2173. [ Links ]
Englehart, P. J. and Douglas, A. 2005. Changing behavior in the diurnal range of surface air temperatures over Mexico. Geophys Res Lett. 32:1-4. [ Links ]
García-Cueto, O. R. and Santillán-Soto, N. 2012. Modeling extreme climate events: two case studies in Mexico. In: Druyan, M. L. (Ed.). Climate models. Intech Publishing, Croatia. 137-160 pp. [ Links ]
García-Cueto, O. R.; Tejeda-Martínez, A. and Bojórquez-Morales, G. 2009. Urbanization effects upon in the air temperature in Mexicali, Baja California, México. Atmosfera 22:349-365. [ Links ]
Gimesi, L. 2009. Development of a visualization method suitable to present tendencies of changes in precipitation. J. Hydrol. 377:185-190. [ Links ]
Griffiths, M. L. and Bradley, R. S. 2007. Variations of twentieth-century temperature and precipitation extreme indicators in the northeast United States. J. Clim. 20(21):5401-5417. [ Links ]
Gutiérrez-Ruacho, O. G.; Brito-Castillo, L.; Díaz-Castro, S. and Watts, C. 2010. Trends in rainfall and extreme temperatures in northwestern Mexico. Clim Res. 42:133-142. [ Links ]
Herrera, S. S. 2011. Cambio climático y comportamiento de elementos climáticos en Nuevo León, México. Dissertation, University of Nuevo León. 155 p. [ Links ]
Field, C. B.; Barros, V.; Stocker, T. F.; Qin, D.; Dokken, D. J.; Ebi, K. L.; Mastrandrea, M. D.; Mach, K. J.; Plattner, G-K, Allen, S. K.; Tignor, M. and Midgley, P. M. 2012. Managing the risks of extreme events and disasters to advance climate change adaptation. A special report of working groups I and II of the intergovernmental panel on climate change. Cambridge University Press, Cambridge. 582 p. [ Links ]
IPCC (Panel Intergobernamental sobre Cambio Climático). Summary for policymakers of Climate Change, 2007. The physical science basis. In: contribution of working group I to the fourth assessment report of the intergovernmental panel on climate change. Cambridge University Press, Cambridge, UK. 102 p. [ Links ]
Koutroulis, A. G.; Tsanis, I. K.; Daliakopoulos, I. N. and Jacob, D. 2013. Impact of climate change on water resources status: a case study for Crete Island, Greece. J. Hydrol. 479: 146-158. [ Links ]
Lata-Beharry, S.; Marcus-Clarke, R. and Kumarsingh, K. 2015. Variations in extreme temperature and precipitation for a Caribbean island: Trinidad. Theor Appl Climatol. 122:783-797. [ Links ]
Magaña, V.; Zermeño, D. and Carolina, Neri, C. 2012. Climate change scenarios and potential impacts on water availability in northern Mexico climate research Clim. Res. 51:171-184. [ Links ]
Medina, G. G.; Ruiz, C. J. A. y Martínez, P. R. A. 1998. Los climas de México: Una estratificación ambiental basada en el componente climático. Libro técnico Núm. 1. INIFAP- CIRPAC. Guadalajara, Jalisco, México. 103 p. [ Links ]
Meehl, G. A.; Arblaster, J. M. and Tebaldi, C. 2005. Understanding future patterns of increased precipitation intensity in a climate model simulations. Geophysical Research Letters 32, L18719. http:// dx.doi.org/10.1029/2005GL023680. [ Links ]
Pavía, E. G.; Graef, F. and Reyes, J. 2008. Annual and seasonal surface air temperature trends in México. Int. J. Climatol. 29:1324-1329. [ Links ]
Peralta-Hernández, A. R.; Balling, R. C. and Barba-Martínez, L. R. 2009. Analysis of near-surface diurnal temperature variations and trends in southern Mexico. Int. J. Climatol. 29:205-209. [ Links ]
Qiong, W.; Mingjun, Z.; Shengjie, W.; Qian, M. and Meiping, S. 2014. Changes in temperature extremes in the Yangtze River Basin, 1962-2011. J. Geogr. Sci. 24(1):59-75. [ Links ]
Ríos-Alejandro, J. 2011. Temperaturas extremas en la ciudad de Monterrey N. L. México. Rev. Chapingo. 17:225-230. [ Links ]
Schar, C.; Vidale, P. L.; Luthi, D.; Frei, C.; Haberli, C.; Liniger, M.A. and Appenzeller, C. 2004. The role of increasing temperature variability in European summer heatwaves. Nature 427:332-336. [ Links ]
Tebaldi, C.; Hayhoe, K.; Arblaster, J. M. and Meehl, G. A. 2006. Going to the extremes: an intercomparison model-simulated historical and future changes in extreme events. Climatic Change. 79(3- 4):185-211. [ Links ]
Vázquez, A. J. L. 2010. Guía para el cálculo y uso de índices de cambio climático en México. Instituto Nacional de Ecología. México. 376 p. [ Links ]
Vázquez-Aguirre, J. L.; Brunet, M. y Jones, P.D. 2008. Cambios observados en los extremos climáticos de temperatura y precipitación en el estado de Veracruz, México, a partir de datos diarios. In: Sigró, R. J.; Brunet, I. M. y Aguilar, E. (Eds.). Cambio climático regional y sus impactos. Publicaciones de la Asociación Española de Climatología, Serie A. Núm. 6. Artyplan, Tarragona, España, 823 p. [ Links ]
Wang, H.; Chen, Y.; Chen, Z. and Li, W. 2013. Changes in annual and seasonal temperature extremes in the arid region of China, 1960-2010. Nat Hazards 65:1913-1930. [ Links ]
Wang, X. L. 2008. Penalized maximal F test for detecting undocumented mean shift without trend change. J. Atmospheric Oceanic Technol. 25:368-384. [ Links ]
Wang, X. L. and Feng, Y. 2010. Rhtests V3. User manual. Climate research division. Atmospheric science and technology directorate. Science and technology branch. Environment Canada. 27 p. [ Links ]
Wang, X. L.; Chen, H.; Wu, Y.; Feng, Y. and Pu, Q. 2010. New techniques for the detection and adjustment of shifts in daily precipitation data series. 2010. J. Appl. Meteorol. Climatol. 49:2416-2436. [ Links ]
Weiss, J. L. and Overpeck, J. T. M. 2005. Is the Sonoran desert losing its cool? Glob Chang Biol 11:2065-2077. [ Links ]
Yu, Z. and Li, X. 2015. Recent trends in daily temperature extremes over northeastern China (1960-2011). Quaternary International 380-381:35-48. [ Links ]
Zarazúa-Villaseñor, P.; Ruiz-Corral, J. A.; Ramírez-Ojeda, G.; Medina- García, G.; Rodríguez-Moreno, V. M.; De la Mora-Orozco, C.; Flores-López, H. E. y Noé Durán-Puga, N. 2014. Índices de extremos térmicos en las Llanuras Costeras del Golfo Sur en México. Rev. Mex. Cienc. Agríc. Pub. Esp. (10):1843-1857. [ Links ]
Zhang, X. and Feng, F. 2004. RClimDex (1.0). Manual del usuario. Climate Research Branch Environment Canada. Versión en español: Santos, J. L. CIIFEN. 22 p. [ Links ]
Zhang, X.; Alexander, L.; Hegerl, G. C.; Jones, P.; Klein-Tank, A.; Peterson, T. C.; Trewin, B. and Zwiers, F. W. 2011. WIREs Clim Change. Doi: 10.1002/wcc.147. [ Links ]
Received: November 2015; Accepted: February 2016
 Este es un artículo publicado en acceso abierto bajo una licencia Creative Commons
