nova página do texto(beta)
 Espanhol (pdf)
 Artigo em XML
 Referências do artigo
 Enviar este artigo por email
 Citado por SciELO
  Similares em
SciELO
Similares em
SciELO 
 Permalink
Introduction
Service is a key element for the economic growth of modern nations (Giannakis, 2011). For the supply chain, increasing service capabilities in a dynamic, globally competitive environment has become more vital. Continuous upgrades in client's requests create a challenging service improvement process, because companies in emerging markets: 1) need to propose the right level of satisfaction to their clients, and 2) are financially constrained to maintain their operations in spite of the infrastructure faults and other external components reducing their logistics performance (Liu and Wang, 2015). However, because of the important opportunities in these markets, companies need to improve their processes and capabilities (De la Torre-Romero et al., 2014). In emerging countries, there is an important gap in measuring and continuously improving service performance compared to manufacturing (Cho et al., 2012).
Due to sometimes conflicting qualitative and quantitative criteria, measurement and service improvement processes in the supply chain are highly complex (Rezaei et al., 2014). Since there are numerous points of contact in a service supply chain, it becomes critical to establish reasonable ways to measure performance and monitor the improvement from the perspective of an individual entity and a global system point of view (Franceschini and Cignetti, 1998; Khurrum and Faizul, 2002; Feng et al., 2011; Boonitt and Pongpanarat, 2011). However, because of intangibility, heterogeneity, and simultaneity of production and consumption of service, measuring the service performance processes while establishing an improvement program for service suppliers is not trivial (Férnandez, 1996; Zeithaml et al., 2004; Banomyong and Supatn, 2011).
All supply chain members compete to reach the value-added attributes perceived by customers as qualifiers and mainly improve the ones perceived as winners. Even though the relative importance of these attributes varies for a given product or service, the quality of service perceived by the client is crucial for success.
Service supply chains are a special case of supply chains where performance measurement needs to be multidimensional (Seth et al., 2005; Yasin and Gomes, 2010; Cho et al., 2012). Service is becoming a dominant factor in an organizations' competitive advantage. With the increased integration of service suppliers into operations, supply networks are forced to establish better control in performance and improvement processes, especially in specialized services with high impacts on time and costs. This is particularly true in the Latin-American metallurgical sector. Since regionalization of the global economy is becoming a trend, industries as automotive one are increasing their service and quality requirements to the metallurgical sector located in Latin America (Cedillo-Campos et al., 2014; SCD, 2012). In this context, several metallurgical companies located in Mexico and Brazil are looking to improve their supply chain approach (Thomson, 2012).
To maintain efficient operations, metallurgical companies demand services such as: a) equipment maintenance for machinery and facilities; b) development projects such as the expansion of working areas, machinery installation, and others; and c) major repairs of machinery and facilities. These services count as a significant component in physical supply chains (Martínez et al., 2006).
Based on an abductive reasoning, this paper highlights the importance of service supply chains in the metallurgical sector and proposes a method for continuously improving performance of service supply chains, mainly focusing on performance of service suppliers running operations in the emerging market context. In fact, this solution (method and informatics tool) was conceived as a standardized instrument for suppliers of the metallurgical sector. Whereas some researches analyze the service supplier selection, the originality of this work is its continuous improvement approach, based on a standard instrument to measure and improve quality of service in a metallurgical supply chain.
The proposed model is based on a relational paradigm developed by Gereffi et al. (2005), which argues that "the value chains are not static and they depend on the details of how interactions between value chain actors are managed." In this case, these interactions are managed throughout an informatics tool running on a well-known platform (Microsoft ACCESS(r)) where every supplier has to achieve its own improvement goals in order to support its systemic relationships (Cedillo-Campos et al., 2006). It links individual service supplier performance to the whole supply chain's performance. It was conceived as support for improvement performance more than a supplier selection too, and it is based on reliable and practical approaches such as SWOT (Strengths, Weaknesses, Opportunities, and Threats), Moments of Truth, SERVQUAL, and Analytic Hierarchy Process (AHP).
AHP is proposed in this paper as a suitable technique for analyzing the service supplier's performance because it can be used to rank service performance using several criteria. It converts subjective assessments of relative importance into a linear set of weights that can be used in ranking the alternatives. With this technique, several options are considered in the decision analysis that makes it possible for a company to adequately evaluate and improve the service supplier system. From an applied logistics standpoint, this approach was helpful to practitioners who were faced with evaluating supplier tasks. Compared to other approaches, the main advantage of the proposed solution is its hybrid method founded on a strong systemic point of view, continuous improvement purpose, and ease of use by service suppliers themselves.
Section 2 shows the background of the study and highlights the characteristics of service suppliers and context of operation where the implementation was carried out. Section 3 presents the proposed method. Finally, in Section 4, conclusions about the process and future work are presented.
Background
The metallurgical sector is a significant industrial part of manufacturing supply chains. With the unique nature of its processes, metallurgical supply chains have specific requirements to be competitive. The metallurgical supply chain is more highly material and energy demanding than assembly chains because of the physical and chemical processes involved. However, operational services for all production systems are currently recognized as a critical part of the metallurgical value chain, so service suppliers are now central elements of metallurgical supply chains and are no longer viewed as isolated entities. In fact, the current process in that industry is to create customer-supplier alliances in order to generate mutual benefits in terms of time and cost.
In the metallurgical industry, there are two types of suppliers: internal and external. Internal suppliers are the organization's staff that provide either tangible property (which leads to offer a service) or an intangible asset (service). External suppliers are individuals or corporations that do not belong to the central business group, but take part in the physical or service flows. To be part of the supply chain, suppliers should have at least two steps: 1) an admission process and 2) an improvement process. At the admission stage, a supplier is selected from a group proposing the service required by the company. Once the supplier has been selected, the organization continuously assesses its performance in order to determine its permanence within the supply chain.
The supplier of tangible assets is evaluated by the: 1) quality of the product and 2), tangible asset to be delivered. For service suppliers, in many metallurgical businesses, the evaluation is performed based only on perceived quality of the service. Assessing the quality of a product is relatively simple, because it is tangible to measure weight, height, thickness, etc. Evaluating services is more complex because customer's perception is the measurement.
Any service is intangible, heterogeneous, and temporary. First, it is intangible because the service cannot be, from a traditional or physical way, easily measured, weighed, and so on. Second, it is heterogeneous since when providing a service, different components evaluated by the customer are involved. Third, it is temporary because the customer-supplier interaction in the process is in a short time period (Fernández, 1996).
Researchers visited four important metallurgical plants located in Mexico. In all those sites, three types of outsourcing services were detected: 1) equipment maintenance of machinery and facilities; 2) development projects such as the expansion of working areas, machinery installation, and others; and 3) major repairs of machinery and facilities. To encourage supplier capabilities, those companies have supporting plans for developing and maintaining service suppliers, which is organized as follows:
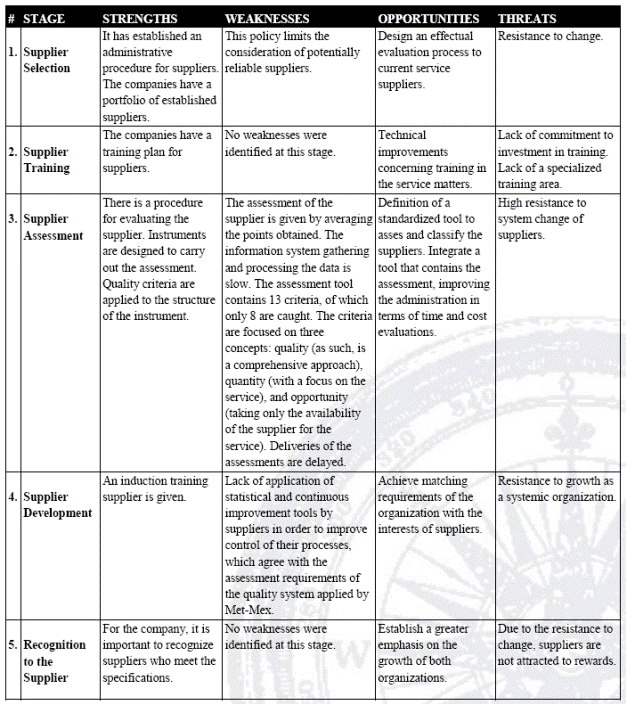
Supplier selection: A recruitment process of suppliers is carried out in this phase. At this point, suppliers are selected based on the following requirements:
knowledge of the operational processes involved in the metallurgical site.
knowledge and maturity of their security measures as personal protective equipment, and processes for an eco-friendly operation.
innovative degree in their equipment and procedures.
maturity of their communication systems.
use of technological platforms to manage their supply chain.
level of capabilities of their human resources.
evaluation of supplier's turnover.
maturity of their quality systems.
financial solvency.
Training program: Training delivered by the companies to their suppliers is focused on two aspects: quality systems and security systems. This process is designed based on the accident prevention concern.
Supplier evaluation: Companies have a portfolio of suppliers that is divided into two groups: Supplier Development Group that is formed by suppliers performing 80 percent of the outsourced activities and Temporary Suppliers that is the group of suppliers performing minor and occasional activities representing 20 percent of the outsourced activities. The supplier evaluation is conducted in two phases:
Assessment of service quality: an evaluation is performed each time a supplier delivers a service. However, this processes is only achieved for services with a cost over US$3,000.00;
Evaluation of supplier quality system: the evaluation process starts organizing a team of three people: 1) a client (the person who requested the service); 2) an engineering supervisor (who contracted the service), and 3) an engineer from the service area (health and safety, quality or engineering). The team visits the plant of the supplier. A final report is developed and delivered to the supplier. In most of the cases, the supplier outlines a strategic plan to deliver improvements in a month, after receiving the report; the supplier has six months to improve weaknesses.
Supplier development: This process is focused on improving their capabilities in issues of quality, health, hygiene, and safety. Other technical training is the responsibility of the supplier itself.
Rewards program: Based on the company's current policies, if the service supplier achieves a score higher than 90 in its evaluation, it is recognized as reliable. Similarly, it is rewarded with an important annual contract.
To identify opportunity areas in the supplier evaluation system currently operating in the analyzed companies, a SWOT analysis was conducted. A systems approach was introduced because in emerging markets there are substantially more operational risks due to factors such as market and financial volatility, quality fade, supply disruptions, infrastructural challenges, lack of transparency, and performance measurement problems (Cedillo-Campos and Sánchez, 2008). The objective was to develop an ad hoc solution taking into account, from a Latin American approach, the different standards of infrastructure and service perception from regulatory, cultural, and practical perspectives (Cedillo-Campos and Perez, 2010). The impact of external environment factors on service quality was taken into account when developing this method to make it easy to implement by all supply chain members (see Table 1).
Proposed Method
A method for improving service supply chains becomes pertinent not only because it is a topic with opportunity areas for applications and research, but as Seth et al. (2006a) argue "the buyer-supplier relationship and management is a well-explored area but fewer studies are seen on the applicability of service quality concepts on the supplier side". Furthermore, even if there is information about dimensions of service quality, as Seth et al. (2006b) mention "there is no universal set of dimensions for measurement of service quality".
According to Jankowicz (1991) and Brady and Cronin (2001), the appropriate methods and techniques depend on the problem and goals. In fact, in a research context where there is complexity and lack of well-supported definitions and metrics, a case study approach is favored. This research was developed and based on the particular case of the service supply chains in the metallurgical sector, focused on the best way to measure aspects where people's perception is involved, and based on the principle to keep it simple The database was designed in a friendly-user platform. After analyzing various approaches related to quality of service, the need for an ad hoc method measuring and supporting continuous improvement of service suppliers was identified.
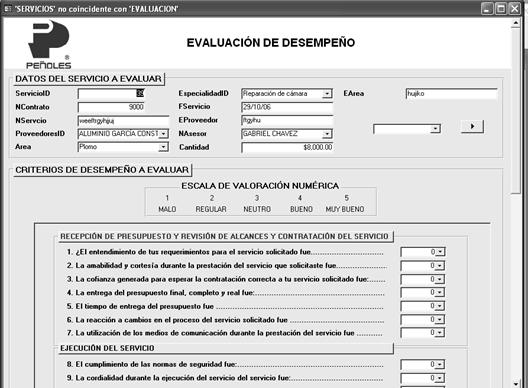
The proposed method involves three stages: 1) a definition of a set of indicators, concepts, and dimensions to provide quality service through the Moments of Truth tool, in combination with the SERVQUAL approach; 2) the use of multi-criteria decision support tools for a multidimensional measurement of service matters; and 3) the development of an informatics tool as support for continuously improving service suppliers' process (see Table 2).
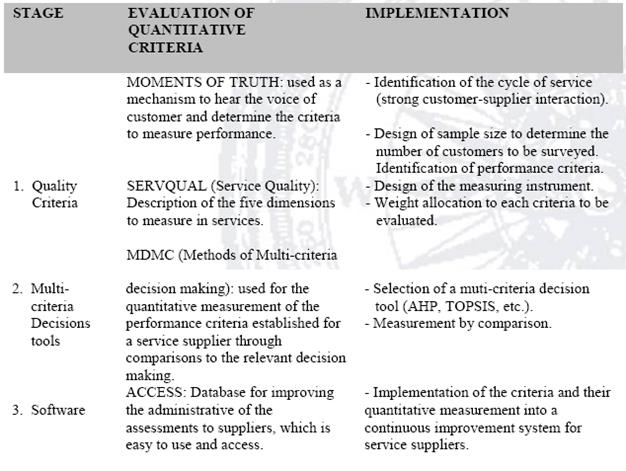
Moments of Truth
The moments of truth allows to obtain information about the criteria that impact customers who maintain a strong interaction with suppliers (Albrecht and Zemke, 1985). Thus, the application of the moment of truth was divided into two stages.
In Stage 1, defining the service cycle in which the client-supplier interaction takes place. At the moment when our research took place, the companies had set diagrams of processes, which reflected the service cycles for identifying activities in which customers are strongly linked with suppliers and staff to accomplish this task. The review of the process diagrams identified two processes in which customers interact with service suppliers: work orders and service requests. Note that each process had its own internal policies established by the companies. In our case study, the supervisors (plant staff) interacted with both types of suppliers: advisers (engineering department, internal suppliers) and contractors (external suppliers). The actors involved in the process are:
Client: it delivers work order for recruiting an outside service supplier. The client maintains feedback during the execution of the work with both the external and the internal supplier.
Internal supplier: it receives the work order and the advisers select and hire external suppliers according to organization's database. The adviser supervises all the processes.
External supplier: any contract that belongs to the database of suppliers was available to compete for the work that the organization needs to have performed, and the selection is made according to the established criteria.
In Stage 2, the collecting and analyzing data is done in seven steps:
The format design for data collection is performed. The format for the data collection plan was established, which took into account only the phases of strong interaction between customer-supplier. In the format, there were no response options provided to respondents, in order not to bias their responses. What was sought was that both the stellar and bitter moments were expressed. The significance of responses later helped identify the strengths and weaknesses in the interface set, and thus take preventive and corrective actions for continuous improvement of the service.
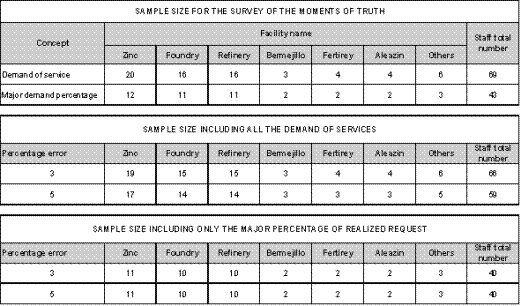
The sample size design for survey implementation is achieved. The sample size design of the staff survey was done through a stratified sampling, which was relevant considering that the population of the different plants that use internal and external suppliers in the study is divided into various strata. Table 3 shows, by columns, plants that make up the organization in the region. A comparative sample size was made with respect to all applicants against the highest percentage of requests made to service suppliers, and because the population size was very small, there was a difference between it and the sample size. The survey was conducted with an estimated error of 3 percent to 5 percent.
The combination of information criteria. Once the data format was filled out by supervisors, each of the criteria defined by plant and per cycle was collected. Similarly, both the stellar moments of truth, and the bitter ones were captured.
The determination of the frequencies on the basis of experience embodied by the supervisors. The frequencies were determined with the criteria that were common to supervisors for every step of the service cycle rated.
Obtention of the diagram of frequency. Global concepts were established, which in turn contain all the criteria provided by the supervisors. The weighing was determined by the individual criteria.
Obtention of the results. The results are provided by the supervisors, which reflect the need to evaluate both the expectations (i.e., what they expect the service will provide) and perceptions (what has finally been obtained from all their experiences with the suppliers) of the customers.
SERVQUAL
Concerning the service quality measurement, SERVQUAL, one of the models representing the real level of quality achieved in an organization from the client's perspective was proposed. According to Parasuraman et al. (1991), SERVQUAL is a simple, inexpensive, and easy model to implement that considers expectation and perception. First, a customer creates an expectation concerning a wanted service. Second, perception is the gap between the client's expectation and the service eventually obtained. From a mathematical point of view, the concept could be expressed as follows:

Where:
 Perceptions
 Expectations
From a SERVQUAL approach, based on surveys it is possible to calculate perceptions (Pi) and expectations (Ei) for each pair of statements. The conceptual model of quality of SERVQUAL is divided into two related dimensions: 1) the client's dimension that refers to the manner in which clients form an opinion of the service quality received; and 2) the enterprise's dimension that identifies the deficiencies that may occur in the organization leading a decline in service quality. Although there are a number of critiques on a range of issues about SERVQUAL, it is one of the most accepted tools in the field of service quality (Parasuraman et al., 1985). Most of the studies in the service quality area are based on the work of Parasuraman et al. (1988) and Simon (1960).
SERVQUAL provides the five dimensions to evaluate any service involving the need to evaluate both perception and expectation. Thus, global benchmarks belonging to each defined service level were intertwined with the dimensionality of SERVQUAL, obtaining a final assessment with the following characteristics:
Measurement and Evaluation of Classification Criteria
According to Nelly et al. (1995), since the service is measured mostly by qualitative attributes, in order to measure these attributes as a sequential series of services, it was necessary to find the preferences of those who were involved during the service process. The standard way of classification is by numerical averages. In this sense, they are averaged for each criterion along successive assessments, i.e., whether  represents the vector of average values of the criteria of the attributes for the supplier,
  and being
  where is a vector of weights. Then the overall average, for the i'th supplier is given by the following expression:

However, the classification using this approach can become complex because the averages tend to be very close since the media has a minimal variance. Another reasonable approach is to use a linear combination, , of the average values of the criteria that has maximal variance. Principal component analysis provides the vector
  . In fact, the vector that maximizes the variance of linear combinations is the eigenvector associated with the largest eigenvalue of the covariance matrix whose components are the global averages of the ratings of the performance criteria of suppliers (for further details in how to calculate an eigenvector, see Saaty [1980] and Podgórski [2015]).
Another possibility is to use multi-criteria optimization tools, such as AHP. AHP incorporates, by weight, customer preferences for performance criteria, thus taking into account customer opinion in the decision making. The weights can be obtained from information contained in the survey.
In multi-criteria decision methods, the decision-making process evaluation takes into account three aspects: 1) the problem, for which one should obtain a solution, 2) the decision maker, who is the person(s) that must make the decision, and 3) the alternatives, representing the different options to choose from for the solution of the problem, taken by the decision maker. The way in which a decision is made begins at the time a problem appears, with different alternatives for its solution. Then, one of the alternatives is chosen and fixed.
Cedillo-Campos et al. (2014) mentions that decision making can take two forms, qualitative and quantitative. The qualitative form is involved when the reasoning, experience, and even the perception of the decision maker is taken into account in the analysis, while the quantitative form involves hard-data associated with the problem that can be expressed in a mathematical way, reflecting the situation, restrictions, and existing relationships. There are simplistic problems that have a single decision criterion, while those with more than one criterion are called multi-criteria decision problems.
Martínez and Escudey (1998) establish that the evaluation methods and multi-criteria decision making include the choice between a set of feasible alternatives, optimization with multiple objective functions simultaneously, a decision maker, and agent evaluation procedures. These methods help the decision-making process, including decision-maker preferences, in order to obtain ranking of the alternatives selected. The weighted sum model (WSM) is the earliest and probably the most widely used method. The weighted product model can be considered as a modification of the WSM, and it was proposed in order to overcome some of the WSM weaknesses. There are some other widely used methods such as the ELECTRE and the TOPSIS (Triantaphyllou, 2000). In particular in the 1980s, Saaty proposed AHP, which became even more popular, among others (Brady and Cronin, 2001). AHP is a method of selection of alternatives, depending on a number of criteria or variables, which are often in conflict, such as the criteria to be evaluated in a supplier. AHP ponders the criteria and the various alternatives using the paired comparison matrices and the fundamental scale for peer comparisons.
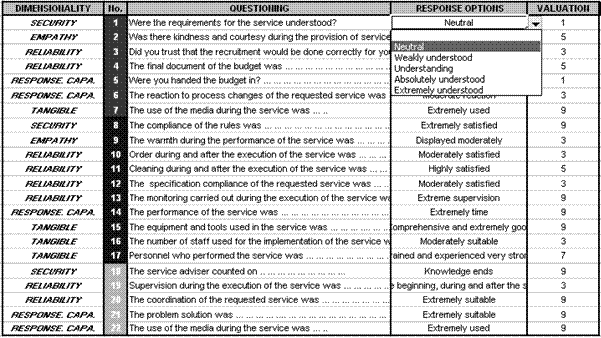
In this case, as shown in Table 4, the survey counted 22 items where each question was related to one of the five dimensions proposed by the SERVQUAL method: 1) tangibility; 2) reliability; 3) response capacity; 4) safety; and 5) empathy. For each response a valuation based on AHP was performed.
Consequently, an eigenvector associated with the highest value was obtained:  a column vector
  ; being:

A common formula is to evaluate it until the value of n is found.  , with an arbitrary but fixed number, where
  represents the vector of the absolute values of vector
  and
and  . That means that each element of vector y is minor or equal to its corresponding element of vector z. Accordingly,
  will be the required eigenvector,
  is the approximation, and
  the number of iterations.
This process was implemented in Microsoft Access, and the procedure was developed in S-Plus v. 8.0; where  , resulting
  and
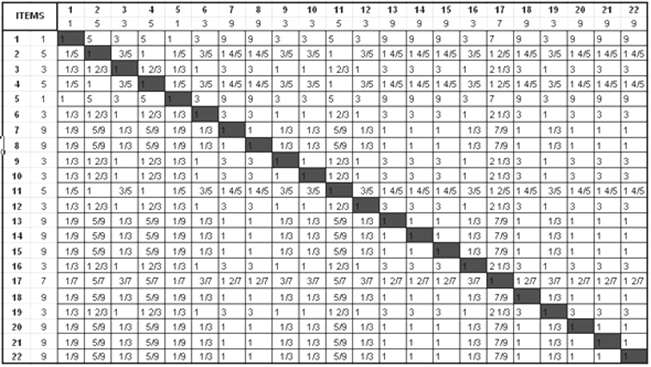
and  , the eigenvectors are shown in Table 5 The normalized principal eigenvector is also called priority vector. Table 6 shows the first matrix developed from the survey, fed by the preferences in each question, and evaluated by the scale of Satty.
To calculate  , the maximum eigenvalue, the Consistence Index (CI) was computed as follows:

In order to calculate  , the matrix A
  =λmax, so 24 values of were obtained by dividing each component of matrix A by the corresponding eigenvector element. The average of these values is taken as . In this case study, = 24, resulting in CI= 0. The final step was to calculate the Consistency Ratio (CR) for the set of judgments defined as:

Where CIs is the corresponding CI value for large samples of matrices of purely random judgments. This number was derived from Saaty (1980), who argued that a CR < 0.1 indicates that the judgments are consistent. Since CI= 0 was obtained, our case study showed a perfect consistency.
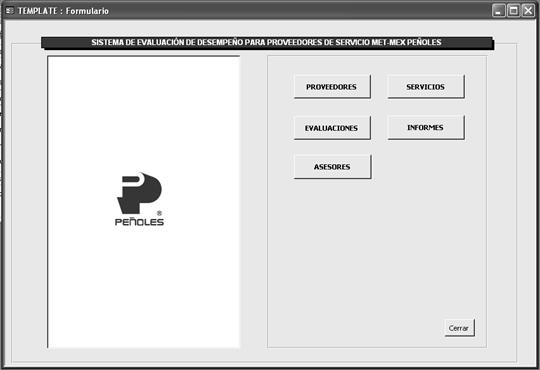
Informatics Tool for Evaluating Performance
In Stage 3, to facilitate the use of the proposed method, the research team programmed the method in a user-friendly and well-known informatics tool. The platform selected for the method development was Microsoft Access, because it is part of MS-OFFICE and the cost of accessibility became low. The following modules were included:
Suppliers: This module counts all relevant information related to every supplier. it displays detailed evaluations from the company's quality committee.
Evaluations: This is the most important module. It is the essence of the system. It includes the evaluation set.
Services: This module contains the characteristics of every service to be provided by suppliers.
Consultants: The module includes general data related to consultants supervising external suppliers during the service execution.
Reports: This module allows reporting of all the information contained in the system.
Compared with other software available on the market, this system:
Improves the administration of assessments.
Allows monitoring performance of suppliers in a daily frequency.
Is user-friendly due to MS Office environment.
Is compatible with company's continuous improvement plan.
Includes the specific company's evaluation criteria related to service execution.
Improves decision making through statistical analytics when selecting suppliers.
Conclusions
Service quality is a complex topic that many companies find difficult to address (Heung et al., 2000). The main reason is a service is intangible, perishable, and heterogeneous. This work has shown that through a user-friendly tool, important service quality results in the short term may result.
In this study, it was important to define and detect the stages of services in which the organization has a close interaction with their suppliers. In these stages, time was critical to assess services quality provided by suppliers. Listening to the customer's voice has always been of great importance in measuring the quality of service. The proposed method considered this when focusing on the critical stages of client-supplier interaction.
With the input provided by customers, researchers made an assessment tool that included customer and company preferences, defined by prominent authors using SERVQUAL. Furthermore, another important contribution of the work is the measurement criteria aligned to a continuous improvement approach.
The proposed method provides visibility and transparency related to service suppliers performance to all members of the supply chain. The method delivers preventive information about supplier performance, which helps reduce costs of replacement of the suppliers with poor performance.
Likewise, technology use facilitated the implementation processes of the proposed method along the company's supply chain. The combination of a methodological development and a user-friendly informatics platform showed significant potential in an emerging market context. The use of this approach is highly advised to any entity that provides services and/or wants to start a project to improve the quality of services rendered to them.
As a result of this research, future work will involve specific analysis for standardizing this tool in order to guarantee its successful application to other industrial sectors. At the same time, it will involve the creation of a warning system linked to cell phones that will enable supervisors to have real time information about the performance of the service suppliers identified as strategic for the supply chain.