


 text new page (beta)
 English (pdf)
 Article in xml format
 Article references
 Send this article by e-mail
 Cited by SciELO
  Similars in
SciELO
Similars in
SciELO 
 Permalink
Introduction
The Basin of Mexico has the potential to supply water to its nearly 22 million inhabitants through the many rivers that form in the mountainous systems surrounding it (Legorreta, 2009). However, continuous land use change and an increasing population have caused freshwater bodies to deteriorate in quantity and quality (Carmona-Jiménez & Caro-Borrero, 2017). This situation is partly due to a lack of regional environmental public policies that would improve the quality of the ecosystems through conservation practices involving local communities and other citizens under a governance approach. Despite their daily use of water, the inhabitants show little interest in the hydrological processes that relate to its supply. Unregulated practices of land use change, such as agriculture, tourism, urban pollution sources, and some anthropogenic activities related to structural modifications of the channels (dams, deviations, extractions, and confinements), promote the invasion and degradation of Protected Areas within Mexico City (Carmona-Jiménez & Caro-Borrero, 2017; Santos-Cerquera & Aguilar, 2016). To identify how these changes (natural and/or induced) derived from anthropogenic activity and affect biological communities, as well as how these communities respond to such changes, it is necessary to establish reference sites. According to Wallin et al. (2003), reference sites should have a set of conditions that most closely resemble the natural state, represented by a minimum extent of human intervention or no human intervention. In terms of biological quality, these conditions refer to the naturalness of the biotic structures and functions in the absence of significant human disturbances (Stoddard et al., 2006). In the montane rivers of the Basin of Mexico, these conditions are usually related to headwaters originating inside Protected Areas with the following characteristics: permanent water run-off with well oxygenated waters, low ionic content, and oligotrophic conditions (Carmona-Jiménez & Caro-Borrero, 2017). Moreover, eutrophication and a decrease in biological diversity and ecological quality are some of the main effects of pollution. Studies of water quality in rivers are increasingly necessary. For example, Directive 2000/60 EC (European Commission, 2000) emphasized the need for water quality studies focused not only on physicochemical quality, but also the inclusion and monitoring of bioindicators as proxies for ecosystem quality (Poikane et al., 2016). In particular, conspicuous macroscopic algae growth (macroalgae, sensu Sheath & Cole, 1992) plays a preponderant ecological role in montane rivers, specifically in the cycling of nutrients and provision of food and refuge for freshwater fauna. Macroalgal communities have developed resilience strategies such as ecophysiological responses to environmental change, diverse asexual reproduction options, efficient dispersal and colonization mechanisms, and a wide variety of growth forms in fast current velocities (Bojorge-García et al., 2010; Borges & Necchi, 2006; Flor-Arnau et al., 2015). These communities have been proposed for quality assessments of aquatic ecosystems given that they respond morphologically and physiologically to physical environmental stressors (current velocity, changes in the flow regime, substratum diversity, water turbidity), and chemical changes in water (hardness, ionic content, pH, nutrient concentrations) (Poikane et al., 2016; Stancheva & Sheath, 2016). Likewise, soft-bodied algae are indicators of structural components associated with the ecological and functional integrity of ecosystems, among other things, due to their position at the base of the trophic chain and their physiological functions that contribute to the stability of the ecosystem -nitrogen-fixing heterocystous cyanobacteria (Rocha et al., 2017; Stancheva & Sheath, 2016).
The Basin of Mexico is home to a strongly adaptative community of macroalgae, most of which have temperate or boreal affinities (Rodríguez-Flores & Carmona-Jiménez, 2018). However, this resilient macroalgal community is threatened by a lack of efficient environmental policies and tools needed to evaluate and conserve the ecological quality of Mexican aquatic systems, and their validation through bioindicator systems. Ecological quality is measured by the sum of its elements, between biological diversity and the ecological processes through which the ecosystem passes to reach its current state (Kaar, 1993). The evaluation of ecological quality and its relationship with conservation status and/or ecological deterioration requires the correct identification of possible biological indicators and their subsequent inclusion in indices that are easily applied and interpreted. To reduce the gap between academia and environmental policy, this study aims to analyze the macroalgal community within the Basin of Mexico and its relationship to water and hydromorphological quality in order to develop the Macroalgae Ecological Quality Index (MEQI) as a potential management tool for water and ecological quality monitoring.
Materials and methods
The Basin of Mexico (Fig. 1) lies in the morphotectonic region of the Trans-Mexican Volcanic Belt (19º00’-19º40’ N, 98º30’-99º30’ W) and expands across 9,600 km2, of which 5,518 km2 are montane ranges that rise above 2,400 m asl. It was originally an endorheic basin, but was artificially opened to drain out excess water from storm peaks that caused flooding in Mexico City during the rainy season (Legorreta, 2009). The region’s climate is sub-humid and temperate (annual median temperature 13.4 ºC, annual median precipitation between 1,200-1,500 mm), with abundant rain from June to October and a dry season from November to May (García, 2004). Its geological traits consist of andesitic to basaltic lavas (Ferrusquía-Villafranca, 1998). Forests of Abies religiosa (Kunth) Schltdl. et Cham., Pinus hartwegii Lindl., and Quercus spp. grow in the upper areas of the watershed, with mixed forests in the middle and lower areas (Ávila-Akerberg, 2010).
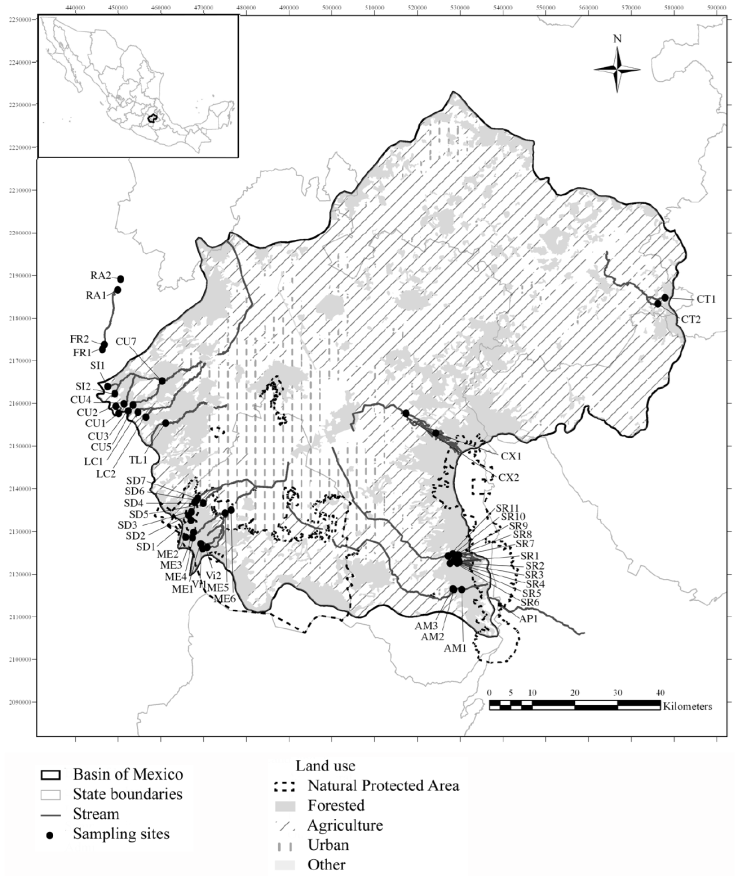
Figure 1 Map of the Basin of Mexico showing the 49 sampled points belonging to 13 rivers (sub-basins) and their land use. For sub-basin and site codes, see Table 1.
Table 1 Physicochemical, hydromorphological characteristics, and macroalgal diversity of sampling sites in the Basin of Mexico (OS, oxygen saturation; T, water temperature; K25, specific conductivity; CV, current velocity; SRP, soluble reactive phosphorus; DIN, dissolved inorganic nitrogen; HQ, hydromorphological quality).
| River | Site and code n = number of collections | OS (%) | T (ºC) | pH | K25(µS cm-1) | CV (m s-1) | SRP (mg L-1) | DIN (mg L-1) | HQ (pts.) | Taxa a |
|---|---|---|---|---|---|---|---|---|---|---|
| Coatlaco | Rancho nuevo I CTI n = 1 | 86 | 11.2 | 7.4 | 61 | 0.23 | 0.38 | 0.16 | 100 | 3,9,11,12,15, 20 |
| Rancho nuevo II CT2 n = 1 | 53 | 13.5 | 6.8 | 68 | 0.26 | 1.20 | 0.10 | 82 | 10 | |
| Coaxcacoaco | Santa Catarina CX1 n = 2 | 94 | 13.1 | 7.1 | 134 | 0.29 | 0.40 | 0.31 | 98 | 3,9,20 |
| San Rafael | La Cabañita RA1 n = 2 | 100 | 13.9 | 6.8 | 80 | 0.52 | 0.21 | 0.57 | 114 | 10,20 |
| La Planta RA2 n = 2 | 95 | 15.0 | 7.2 | 81 | 0.53 | 0.20 | 0.80 | 100 | 10 | |
| San Rafael- Tlalmanalco | San Rafael SR1 n = 2 | 93 | 12.0 | 5.5 | 72 | 0.51 | 0.61 | 0.13 | 85 | 5,11 |
| San Rafael canal 1 SR2 n = 2 | 100 | 9.9 | 7.5 | 138 | 0.51 | 0.48 | 0.14 | 118 | 3,5,9,10,11,13,20 | |
| San Rafael canal 2 SR3 n = 2 | 89 | 11.3 | 6.8 | 136 | 0.90 | 0.51 | 0.96 | 94 | 3,5,9,10,11,13,20 | |
| Agua dulce SR4 n = 2 | 90 | 9.0 | 6.6 | 138 | 0.57 | 0.80 | 0.48 | 100 | 3,20 | |
| San Rafael canal 3 SR5 n = 2 | 97 | 11.6 | 7.0 | 137 | 2.05 | 0.33 | 0.86 | 96 | 5,11 | |
| San Rafael bajo SR6 n = 2 | 97 | 11.6 | 7.0 | 137 | 0.46 | 0.33 | 0.86 | 96 | 3 | |
| La Compañía SR7 n= 2 | 100 | 10.7 | 7.2 | 154 | 0.27 | 0.34 | 0.19 | 112 | 2,3,4,5,8,10,11 | |
| Cosamala 1 SR8 n = 2 | 90 | 8.8 | 7.0 | 50 | 0.11 | 0.66 | 0.57 | 92 | 3,5,9,10 | |
| La Compañia 2 SR9 n = 2 | 58 | 14.9 | 7.0 | 137 | 0.63 | 0.40 | 1.04 | 66 | 5,8,10 | |
| Cosamala 3 SR10 n = 2 | 68 | 14.6 | 7.0 | 99 | 0.51 | 0.51 | 0.60 | 104 | 5,8,11 | |
| Confluencia C-SR SR11 n = 2 | 58 | 14.9 | 7.0 | 137 | 0.63 | 0.40 | 1.04 | 66 | 10 | |
| Ameca- Canal Nacional | La Castañeda alto AM1 n = 2 | 90 | 8.3 | 7.3 | 255 | 0.54 | 0.27 | 0.76 | 120 | 5,10,14,15, 20 |
| La Castañeda AM2 n = 3 | 100 | 6.9 | 6.9 | 144 | 0.39 | 0.53 | 0.10 | 104 | 5,10,14, | |
| La Castañeda bajo AM3 n = 2 | 60 | 11.0 | 7.2 | 201 | 0.63 | 0.62 | 1.27 | 96 | 5,8,10,14,20 | |
| Frío | El Llano alto FR1 n = 1 | 100 | 15.6 | 7.2 | 35 | 0.85 | 0.48 | 0.49 | 102 | 4,10 |
| El Llano bajo FR2 n = 1 | 100 | 13.1 | 6.7 | 62 | 0.63 | 0.40 | 0.70 | 104 | 3,4,5,10 | |
| Viborillas | Monte Alegre I VI1 n = 2 | 129 | 11.6 | 7.4 | 50 | 0.16 | 0.21 | 0.47 | 82 | 3,9,11 |
| Monte Alegre II VI2 n = 2 | 89 | 17.7 | 7.2 | 63 | 0.04 | 0.23 | 1.23 | 77 | 11,16 | |
| Magdalena- Eslava | Manantial Eslava ME1 n = 2 | 43 | 8.8 | 5.7 | 112 | 0.20 | 0.19 | 0.54 | 110 | 3,13,15 |
| Chautitle alto ME2 n = 1 | 98 | 5.0 | 6.7 | 64 | 0.15 | 0.49 | 0.12 | 116 | 3,5,9,10,20 | |
| Chautitle cañada ME3 n = 1 | 96 | 6.0 | 7.0 | 64 | 0.21 | 0.33 | 0.10 | 120 | 5,9,10,20 | |
| Truchero alto ME4 n = 2 | 82 | 7.6 | 7.2 | 63 | 0.20 | 0.28 | 0.24 | 88 | 5,10,11,20 | |
| Confluencia E-M ME5 n = 2 | 50 | 12.0 | 7.1 | 86 | 0.98 | 0.39 | 2.78 | 54 | 4,9,10,19 | |
| Santa Teresa ME6 n = 2 | 42 | 12.8 | 7.6 | 0 | 0.56 | 0.54 | 4.85 | 52 | 4 | |
| Santo Desierto- Mixcoac | Santa Rosa Alto SD1 n = 2 | 91 | 11.8 | 7.5 | 77 | 0.35 | 0.30 | 0.06 | 110 | 2,5,8,10,15 |
| Arroyo Desierto SD2 n = 2 | 90 | 9.6 | 7.0 | 89 | 0.17 | 0.50 | 0.14 | 120 | 11,20 | |
| Santa Rosa Medio SD3 n = 1 | 80 | 10.0 | 6.5 | 79 | 0.86 | 0.50 | 0.10 | 114 | 4,9,10 | |
| Convento SD4 n = 2 | 99 | 9.4 | 6.6 | 77 | 0.40 | 0.29 | 0.67 | 65 | 4,9,10 | |
| La Capilla SD5 n = 1 | 80 | 13.0 | 7.3 | 150 | 0.60 | 0.26 | 0.11 | 104 | 4,14 | |
| Escuela V-M SD6 n = 2 | 87 | 5.5 | 7.3 | 83 | 0.25 | 0.27 | 0.74 | 80 | 3,5,7,8,15, 20 | |
| Truchero V-M SD7 n = 1 | 69 | 7.4 | 6.6 | 100 | 0.28 | 0.34 | 0.63 | 79 | 10 | |
| Tlalnepantla | San Luis Ayucan TL1 n = 2 | 55 | 10.8 | 6.6 | 60 | 0.90 | 0.97 | 1.71 | 68 | 10,18 |
| La Colmena | La Caldera LC1 n = 1 | 100 | 8.1 | 6.7 | 35 | 0.05 | 0.53 | 0.04 | 116 | 10,13,15 |
| Xopachi LC2 n = 1 | 98 | 8.6 | 7.1 | 35 | 0.13 | 0.37 | 0.93 | 114 | 1,2,3,10,11,13 | |
| Cuautitlán | Los Organillos CU1 n = 3 | 88 | 10.6 | 6.5 | 101 | 0.20 | 0.50 | 0.68 | 104 | 3,11,13,16, 17,19 |
| Presa Iturbide CU2 n = 2 | 99 | 11.4 | 6.7 | 52 | 0.35 | 0.48 | 0.56 | 108 | 2,3,5,9,10, 11,14 | |
| Manantial S-P CU3 n = 2 | 97 | 9.7 | 6.6 | 53 | 0.12 | 0.28 | 0.04 | 118 | 3,5,6 | |
| Cortina P-I CU4 n = 1 | 80 | 13.2 | 6.5 | 53 | 0.64 | 0.96 | 1.55 | 88 | 11,13,15,18,19,20 | |
| Capoxi CU5 n = 1 | 100 | 11.4 | 6.8 | 46 | 0.72 | 0.60 | 0.07 | 114 | 9,11, | |
| Manantial Capoxi CU6 n = 2 | 86 | 13.0 | 6.6 | 45 | 0.76 | 0.43 | 0.06 | 114 | 2,6,10 | |
| Transfiguración CU7 n = 2 | 100 | 12.7 | 7.5 | 63 | 0.74 | 1.67 | 3.96 | 88 | 10,13,20 | |
| San Ildefonso | Las Palomas SI1 n = 2 | 100 | 11.8 | 7.0 | 49 | 0.16 | 0.23 | 0.43 | 120 | 5,11,14,19,20 |
| Truchero D.A. SI2 n = 2 | 100 | 10.3 | 7.2 | 54 | 0.67 | 0.37 | 0.26 | 107 | 5,10,13,15 | |
| Apatlaco | Apatlaco AP1 n = 1 | 94 | 10.7 | 6.9 | 58 | 0.98 | 0.25 | 0.16 | 111 | 9,20 |
a Number of taxa according to Table 3.
We selected 13 sub-basins each with a corresponding perennial river into the Basin of Mexico. Forty-nine locations were sampled within these rivers to represent the different conditions of conservation within forested areas. The criteria for site selection included the following: 1) streams that were reported as perennial in official documentation (cartographic information with hydrological network, GDF, 2012; INEGI, 2013); 2) location of headwaters within natural areas with minimal or no presence of urbanization and anthropogenic activities, with the objective of finding reference sites and conditions, and 3) the feasibility of collecting in middle and downstream sections to determine a gradient of change depending on level of anthropogenic intervention. In many cases, the river mouths were not sampled because they are piped and are part of the city’s drainage system. Sampling was carried out between March 2012 and April 2016, with sites being visited several times (at least 2 and 3 times; Table 1) in contrasting seasons: rainy season (June to November) and dry season (December to May) (García, 2004). Water temperature, specific conductivity, and pH (Hanna Multiparameter probe 991300, Dallas, USA), oxygen saturation (YSI-85 meter, YSI, Ohio, USA), and current velocity (Global Water FP111, Texas, USA) were recorded in situ. For each site, samples of 500 mL of water were filtered in situ and analyzed in the laboratory for selected nutrients according to official Mexican guidelines and international standards (DOF, 2003; Rice et al., 2017). Nitrite nitrogen (NO2-N), nitrate nitrogen (NO3-N), ammonium nitrogen (NH4-N), dissolved inorganic nitrogen (DIN), and soluble reactive phosphorus (SRP, in theory mostly in the form of orthophosphate, PO4-P) were analyzed with a DR 3900 laboratory spectrophotometer (Hach, Loveland, CO, USA; Hach, 2003). Trophic status was recognized as either oligo-mesotrophic (DIN, 0.7mg L-1; SRP, 0.25 mg L-1) or mesotrophic-eutrophic (DIN, 1.5mg L-1; SRP, 0.75mg L-1) according to Dodds et al. (1998) and Dodds (2003).
Hydromorphological quality (HQ), referring to any modification of the flow regime, sediment transport, river morphology, or lateral channel mobility (Nardini et al., 2008), and anthropogenic effects were evaluated with reference to the Ecological Quality of Andean Rivers Index (Acosta et al., 2009). The HQ scale to classify the naturalness of the system -i.e., the conditions that present minimal alterations in riparian ecosystems of high montane streams- ranged from 24-120 points (> 96 high, 76-95 good, 51-75 moderate, 26-50 poor, < 25 bad) and considered the following aspects: 1) basin, including vegetation cover, bank stability, substrate diversity, and development of human activities surrounding the stream; 2) hydrology, evaluating the presence of dams, regimes of channel speed and depth, and alterations and state of the channel; and 3) anthropogenic disturbances, assessing the presence and impacts of human activity with direct effluents to the stream, urban development, human development, and presence of contamination.
Each sampling site consisted of a randomly chosen 10 m long stream segment, which was divided into 5 equal quadrants where algae growths were collected and stream microhabitats were characterized (Necchi et al., 1995). We estimated a semi-quantitative abundance of macroscopic algae by measuring the percent coverage of each alga in each substrate through a visual estimation (Poikane et al., 2016; Rocha et al., 2017). The coverage was evaluated within a circular sampling unit 10 cm in radius (314 cm2), and each macroalgae growth was sampled in 5 units at different sampling points in the stream segment (Bojorge-García et al., 2010). The 5 samples of freshly collected material were reviewed under an optical microscope to identify characteristic reproductive or vegetative structures useful for species identification. Algae were identified to species level following taxonomic keys and specialized bibliographic resources (Anagnostidis & Komárek, 2005; Carmona-Jiménez & Necchi, 2002; Carmona-Jiménez & Vilaclara, 2007; Ettl & Gartner, 1988; Komárek, 2013; Rieth, 1980; Wher & Sheath, 2003; Zuccarello & Lokhorst, 2005). For taxonomic analyses, an Olympus BX51 microscope with a DP12 digital camera (Olympus, Tokyo, Japan) was used. Species with no reproductive structures or those that did not coincide with morphological characters described in the literature were not identified.
The MEQI was developed and validated in 3 steps. Step 1 “Establish the environmental differences between sampling sites”: first, we analyzed the environmental parameters (physicochemical variables and hydromorphological quality) separate from biological data as follows. Environmental factors were tested for collinearity to avoid correlation among variables. The mean values of variables selected for further analyses at each site were transformed through log (x+1). Principal Component Analyses (PCA) were performed to recognize the main environmental parameters that influence the ecological quality conditions of each site. Step 2 “The Macroalgae Ecological Quality Index (MEQI) proposal: calculate the indicator value”: Canonical Correspondence Analyses (CCA) followed by Montecarlo tests (999 permutation, α = 0.05) were applied to determine the environmental preferences of macroalgal species by relating their distribution with physical, chemical, and hydromorphological parameters. The distribution of species scores along axis 1 and 2 of the CCA were used to separate species into 3 groups. The maximum and minimum values were used as a reference for tolerant and intolerant species, while intermediate values were used as a reference for detector species. Detector species are those that respond better to environmental changes and provide information for more than habitat (Tornés et al., 2007). An indicator value was assigned to each group and used to calculate the MEQI using the formula adapted from Pantle and Buck (1955): MEQI= ∑(v*h)/ ∑ h where v is the species indicator value and h is the relative abundance (percent coverage) of the sample. All statistical analyses were performed in RStudio (R Studio Team, 2019) with the vegan (Oksanen et al., 2019) and ggplot2 (Wickham, 2016) packages. Step 3 “The MEQI validation”: we used a new test set to validate the MEQI proposed in the previous step. This test set consisted of 26 sites collected in the cool, dry season (February 13-21, 2019) spanning 3 of the largest sub-basins within the Basin of Mexico: Cuautitlán (8 sites), Santo Desierto (9 sites), and San Rafael-Tlalmanalco (9 sites). The HQ, physicochemical parameters, and macroscopic algae samples were obtained as previously described, and the MEQI was calculated for each site. To validate index performance in summarizing ecological quality, we calculated Pearson’s rank correlation coefficients of the MEQI with nutrient concentrations (DIN and SRP), oxygen saturation, and HQ. In this sense, an increase in MEQI scores reflected an increase in nutrient concentrations, organic pollution (OS as a proxy), and hydromorphological alterations.
Results
Streams within the Basin of Mexico showed relatively similar physicochemical characteristics (Table 1). The water temperature was temperate (5-17.7 ºC), with variable oxygen saturation (42.5-100%), low to medium electrical conductivity (34.5-546 µS cm-1), and slightly acidic to neutral pH (5.5-7.7). Current velocity ranged from slow to fast (0.05-2.05 m s-1). Nutrient concentrations (SRP and DIN) were low in headwaters and increased towards mid and lower river reaches. The same pattern was observed in the hydromorphological quality assessment, where 29 sites were recognized as high quality, 14 sites as good quality, and 7 sites as moderate quality.
PCA results, considering nutrient concentrations (SRP and DIN), HQ, and physical parameters, showed that 61% of the variance in data among sampling sites was explained by the first principal component (Table 2). Groups I and II were both composed of sites with high or good HQ and OS, differing in nutrient loads as sites in group I had the lowest concentrations of SRP and sites in group II had the lowest concentrations of DIN. These 2 groups included headwaters (100%) and some sites from the streams’ middle courses (30%). Group III contained sites from middle (70%) and lower (100%) courses with the highest nutrient concentrations, lowest OS, and moderate HQ.
Table 2 PCA test considering inter-site variance in nutrient concentrations hydromorphological quality and physical parameters in rivers of the Basin of Mexico (for abbreviation codes of the environmental variables and sites see Table 1)
| PC 1 | PC 2 | PC 3 | |
|---|---|---|---|
| Eigenvalue | 2.5 | 1.3 | 1.2 |
| % variance | 30 | 15 | 15 |
| Cumulative | 30 | 46 | 61 |
| Parameters | 30 | 46 | 61 |
| OS | 0.49 | ||
| K25 | 0.79 | ||
| SRP | 0.30 | ||
| DIN | 0.54 | ||
| HQ | -0.53 | ||
| CV | 0.27 | ||
| Sites/group | III | II | I |
| CT1 | 0.64 | ||
| CT2 | 1.67 | ||
| CX1 | 0.62 | 0.69 | |
| RA1 | 0.77 | ||
| RA2 | 1.39 | ||
| SR1 | -2.52 | ||
| SR2 | 1.38 | ||
| SR3 | 0.68 | 0.96 | |
| SR4 | 0.46 | ||
| SR5 | 1.21 | 1.99 | 1.64 |
| SR6 | 0.76 | ||
| SR7 | 0.96 | 0.84 | |
| SR8 | -0.32 | -1.20 | -0.58 |
| SR9 | 2.27 | ||
| SR10 | 0.68 | 0.42 | |
| SR11 | 2.27 | ||
| AM1 | 3.32 | ||
| AM2 | 0.66 | ||
| AM3 | 2.44 | ||
| FR1 | 2.20 | ||
| FR2 | 0.20 | ||
| VI1 | 1.76 | ||
| VI2 | 1.09 | 1.00 | |
| ME1 | 1.37 | ||
| ME2 | -2.11 | ||
| ME3 | -2.13 | ||
| ME4 | -0.67 | -0.12 | -0.31 |
| ME5 | 3.67 | ||
| ME6 | 5.12 | ||
| SD1 | 1.23 | ||
| SD2 | -1.37 | ||
| SD3 | 0.31 | ||
| SD4 | 0.15 | ||
| SD5 | 1.65 | 1.04 | |
| SD6 | 0.13 | ||
| SD7 | 0.62 | ||
| TL1 | 2.84 | ||
| LC1 | -1.88 | ||
| LC2 | 0.13 | ||
| CU1 | -0.54 | -0.10 | -1.01 |
| CU2 | -0.74 | -0.99 | -0.18 |
| CU3 | -1.92 | ||
| CU4 | 1.71 | ||
| CU5 | 0.17 | ||
| CU6 | -0.50 | -0.40 | -0.20 |
| CU7 | 3.60 | ||
| SI1 | 0.61 | ||
| SI2 | 0.84 | ||
| AP1 | 0.56 |
The MEQI proposal: the indicator value
Twenty macroalgal species were collected and identified (Table 3). Species with wide distribution across the basin (> 40% of the sites) and the greatest cover (> 23%) were Nostoc aff. parmelioides, Placoma regularis, Prasiola mexicana, Spirogyra sp., and Vaucheria bursata. Other species high in percent coverage but restricted to certain sites included Microcoleous aff. autumnale, Draparnaldia mutabilis, Tetraspora gelatinosa, Stigeoclonium tenue, and Batrachospermum gelatinosum.
Table 3 Macroalgal diversity in rivers of the Basin of Mexico.
| Taxa | Frequency (number of sites collected) | Cover percentage (min-max%) |
|---|---|---|
| Cyanobacteria | ||
| 1. Calothrix sp. | 1 | 1 |
| 2. Coleodesmium wrangelii Borzí ex Geitler | 5 | 1-11 |
| 3. Nostoc aff. parmelioides Kützing ex Bornet & Flahault * | 24 | 1-16 |
| 4. Microcoleous aff. Autumnale (Gomont) Strunecky, Komárek & Johansen in Strunecky et al. * | 9 | 1-26 |
| 5. Placoma regulare Brody & Ingerfeld * | 27 | 1-26 |
| Rhodophyta | ||
| 6. Batrachospermum gelatinosum (Linnaeus) De Candolle * | 4 | 2-15 |
| 7. Paralemanea mexicana(Kützing) Vis & Sheath * | 1 | 3 |
| 8.´Chantransia´ stage of undefined Rhodophyta * | 6 | 1-5 |
| Chlorophyta | ||
| 9. Ulothrix sp. | 15 | 0.1-8 |
| 10. Prasiola mexicana Agardh* | 41 | 0.5-76 |
| 11. Spirogyra sp.* | 20 | 1-23 |
| 12. Mougeotia sp. | 1 | 1 |
| 13. Cladophora sp.* | 8 | 1-5 |
| 14. Rhizoclonium sp. | 7 | 1-6 |
| 15. Oedogonium sp.* | 10 | 1-45 |
| 16. Tetraspora gelatinosa (Vaucher) Desvaux | 5 | 2-5 |
| 17. Draparnaldia mutabilis (Roth) Bory | 1 | 2 |
| 18. Stigeoclonium tenue (Agardh) Kützing * | 3 | 1-15 |
| Xanthophyta | ||
| 19.Tribonema vulgare Pascher. | 4 | 1-4 |
| 20.Vaucheria bursata (Müller) Agardh * | 26 | 1-23 |
* Species registered in the collection to validate the MEQI index.
CCA revealed that most sampled streams had low to moderate nutrients, as eutrophic conditions were less frequent (Table 4, Fig. 2). The main ordination of the sampling sites related to environmental parameters was verified along axis one of the CCA, with 42.7% of the variance explained. The canonical coefficients revealed DIN (r = 0.65) to be the most important environmental variable to the ordination correlated with the positive quadrant, while HQ (r = -0.50) and OS (r = -0.37) were the most important environmental variables to the ordination strongly correlated with the negative quadrant. Axis 2 (24.9% of explained variance) was negatively correlated with current velocity (r = -0.39) and SRP (r = -0.20). Indicator values were assigned following Signini (2002), who recommends normalizing the values with other aquatic bioindicators. Species below the 25th percentile (≤ -0.31) were considered indicators of good ecological status (v = 1), while species above the 75th percentile (≥ 0.54) were considered indicators of poor ecological status (v = 5). Species with scores between the 25th and 75th percentile regions (> -0.31 and < 0.54), or in the transition zone, were considered tolerant species (v = 3).
Table 4 The CCA analysis and inter-set coefficients of the canonical correlation of the environmental variables and the macroalgal indicator value (v) in rivers of the Basin of Mexico (for abbreviation codes of the environmental variables see Table 1).
| CCA1 | CCA2 | ||
|---|---|---|---|
| Eigenvalue | 0.61 | 0.35 | |
| p | 0.002 | 0.007 | |
| % variance | 42.7 | 24.9 | |
| Cumulative | 42.7 | 67.6 | |
| Parameters | |||
| OS | -0.37 | ||
| SRP | -0.20 | ||
| DIN | 0.65 | ||
| HQ | -0.50 | ||
| CV | -0.39 | ||
| Species | v | ||
| Coleodesmium wrangelii | -1.11 | -0.69 | 1 |
| Ulothrix sp. | -0.40 | -0.85 | 1 |
| Nostoc aff. parmelioides | -0.34 | 0.50 | 1 |
| Vaucheria bursata | -0.32 | -0.25 | 1 |
| Prasiola mexicana | -0.31 | 0.16 | 1 |
| Batrachospermum gelatinosum | -0.31 | 0.76 | 1 |
| Placoma regulare | -0.15 | -1.10 | 3 |
| Cladophora sp. | -0.13 | -0.31 | 3 |
| Spirogyra sp. | -0.12 | 1.26 | 3 |
| Rhizoclonium sp. | -0.07 | -0.23 | 3 |
| Oedogonium sp. | 0.35 | -0.38 | 3 |
| Tetraspora sp. | 0.38 | 4.57 | 3 |
| `Chantransia´ stage | 0.60 | -0.95 | 5 |
| Stigeoclonium tenue | 0.95 | -2.53 | 5 |
| Tribonema vulgare | 2.88 | -0.91 | 5 |
| Microcoleous aff. autumnale | 4.27 | -0.19 | 5 |
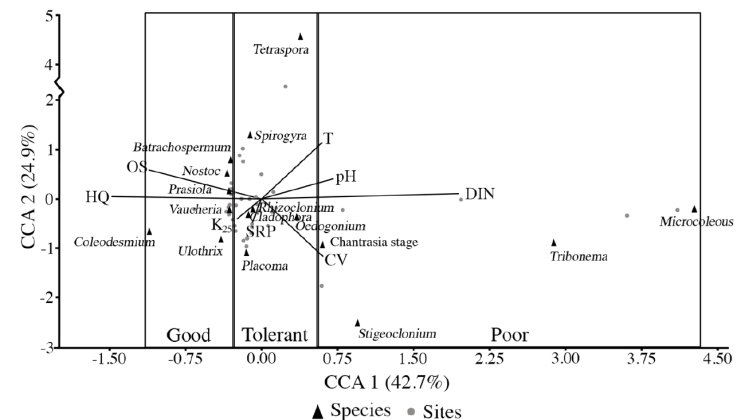
Figure 2 Scatterplots based on the CCA of the macroalgae samples (percentage cover) from 49 sites in the Basin of Mexico, correlated with the environmental variables to the ordination of axes 1 and 2. Ordination of the macroalgae taxa according to their ecological optima, recognizing indicators of good and poor ecological status and tolerant species (for codes of the environmental variables, see Table 1).
Species’ percent coverage and indicator values were used to calculate the MEQI applying the formula adapted from Pantle and Buck (1955). The index values ranged from 1 to 5, representing 5 different ecological qualities determined by macroalgal representatives (Table 5) and those established by the Water Framework Directive (2000) (European Commission, 2000): high (1.0-1.5), good (1.51-2.5), moderate (2.51-3.5), poor (3.51-4.5), or bad (4.51-5.0) ecological quality. Values lower than 1.5 can be considered as reference sites with high ecological quality, and values higher than 3.51 indicate disturbed sites. Intermediate classes indicate species that can tolerate high concentrations of DIN and/or SRP, low OS, or disturbances in the HQ. A recurrent association of N. aff. parmelioides, C. wrangelii, P. regulare, and V. bursata was recognized in sites scored as having high and good ecological quality. Associations with P. mexicana, Cladophora, and Spirogyra were found in good and moderate scored sites. It should be noted that Prasiola was found in sites ranging from high to poor ecological quality, always in association with high water flow. M. aff. autumnale and S. tenue were found in association with sites of poor and bad ecological quality.
Table 5 The MEQI value and representative of the ecological quality of the assemblages (EQ) from 50 sites in the Basin of Mexico (for abbreviation codes of the sites see Table 1).
MEQI validation
A total of 12 macroalgae species were recorded in the validation collection (Table 3). In general, the MEQI was consistent with the value of hydromorphological quality and trophic status. Headwaters presented good and high scores, while an evident decrease in hydromorphological quality was related to poor and bad MEQI classes (Fig. 3, Table 6). We found a strong positive correlation between the MEQI scores and both DIN and SRP, and a moderately positive correlation with HQ (p < 0.05 for all correlations) (Table 7). Modifications in canal structure and the extraction and retention of water in the rivers confirmed the moderate HQ value in the middle and lower portions of the 3 sub-basins.
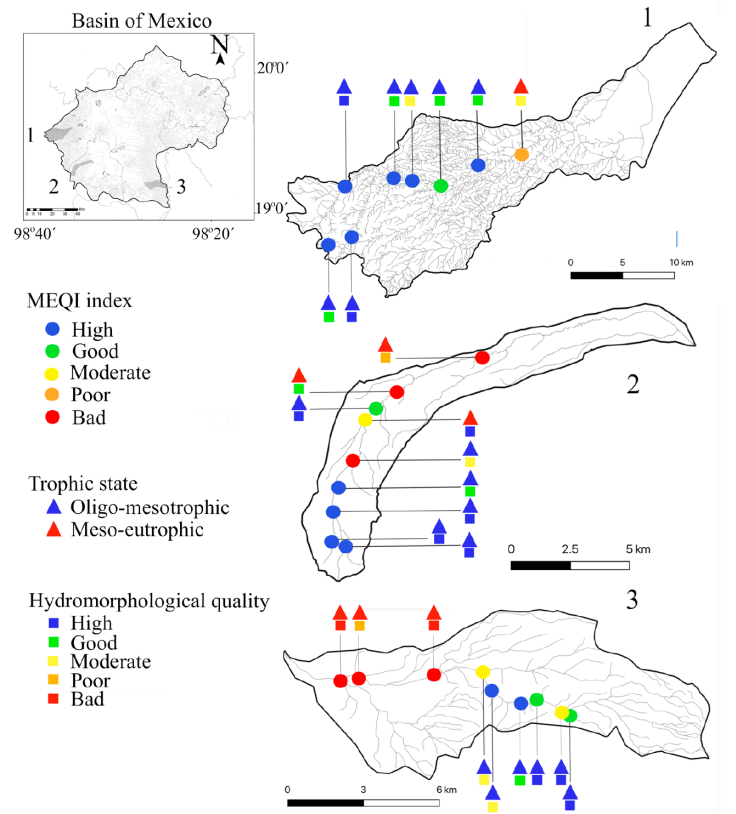
Figure 3 The MEQI score, ecological quality, and physicochemical quality in 1, Cuautitlán; 2, Santo Desierto-Mixcoac, and 3, San Rafael-Tlalmanalco sub-basins of the Basin of Mexico.
Table 6 Physicochemical, hydromorphological characteristics and MEQI value of validation sampling sites in the Basin of Mexico (for abbreviation codes of the environmental variables see Table 1).
| Sub-basin, sites and altitud e (m asl) | K25(µS cm-1) | OS(%) | SRP (mg L-1) | DIN (mg L-1) | HQ (pts) | Macroalgae (Cover percentage) | MEQI |
|---|---|---|---|---|---|---|---|
| San Rafael-Tlalmanalco | |||||||
| Waterfall Diamantes 3266 | 174 | 8.1 | 0.45 | 0.05 | 120 | Vaucheria bursata (20) Cladophora sp. (15) | 1.8 |
| Waterfall Negro 3094 | 161 | 8.4 | 0.31 | 0.04 | 120 | Placoma regulare (10) | 3 |
| Vereda 2956 | 151 | 8.1 | 0.31 | 0.04 | 102 | P. regulare (10) | 1.6 |
| P. mexicana (30) | |||||||
| V. bursata (30) Cladophora sp. (20) | |||||||
| Canal 2915 | 142 | 7.9 | 0.38 | 0.04 | 95 | Nostoc aff. parmelioides (30) | 1.16 |
| P. regulare (5) | |||||||
| P. mexicana (10) | |||||||
| V. bursata (15) | |||||||
| Agua dulce 2788 | 151 | 8.2 | 0.33 | 0.09 | 63 | P. regulare (1) | 1.12 |
| P. mexicana (15) | |||||||
| Dos aguas 2676 | 123 | 7.7 | 0.34 | 0.12 | 55 | P. mexicana (5) | 1 |
| San Rafael 2525 | 261 | 5.8 | 2.58 | 21.52 | 18 | Stigeoclonium tenue (20) | 5 |
| UAM 2429 | 415 | 3.0 | 3.24 | 15.4 | 37 | S. tenue (80) | 5 |
| Tlalmanalco 2400 | 677 | 2.7 | 2.52 | 52.06 | 24 | S. tenue (15) | 5 |
| Cuautitlán | |||||||
| Spring 3379 | 39 | 7.6 | 0.15 | 0.13 | 111 | N. aff. parmelioides (5) | 1 |
| Spring Iturbide 3317 | 60 | 7.7 | 0.14 | 0.23 | 72 | N. aff. parmelioides (27) | 1.27 |
| P. regulare (10) | |||||||
| P. mexicana (20) | |||||||
| V. bursata (15) | |||||||
| Iturbide 3205 | 59 | 8.4 | 0.13 | 0.16 | 104 | N. aff. parmelioides (10) | 1 |
| El paraíso 2703 | 51 | 8.0 | 0.36 | 0.21 | 120 | P. regulare (25) | 1.34 |
| P. mexicana (100) | |||||||
| V. bursata (30) | |||||||
| El polvorín 2612 | 70 | 7.2 | 0.21 | 0.21 | 76 | P. mexicana (90) | 1 |
| V. bursata (50) | |||||||
| Cantera 2578 | 72 | 7.5 | 0.15 | 0.38 | 65 | P. regulare (55) | 2.07 |
| P. mexicana (20) | |||||||
| V. bursata (27.5) | |||||||
| Transfiguración 2515 | 70 | 7.6 | 0.29 | 0.23 | 92 | P. regulare (15) | 1.26 |
| P. mexicana (100) | |||||||
| Yondese 2396 | 113 | 7.6 | 0.42 | 0.32 | 85 | P. regulare (10) | 2.07 |
| V. bursata (30) Cladophora sp. (25) | |||||||
| Nicolás Romero 2333 | 175 | 6.8 | 1.75 | 1.94 | 53 | S. tenue (40) | 5 |
| Santo desierto | |||||||
| San Miguel | 57 | 7.7 | 0.26 | 0.06 | 117 | N. aff. parmelioides (20) | 1.09 |
| 3310 | P. regulare (1) | ||||||
| Conejos | 72 | 7.4 | 0.13 | 0.11 | 111 | N. aff. parmelioides (20) | 1 |
| 3314 | P. regulare (1) | ||||||
| Confluencia alta 3123 | 75 | 7.5 | 0.17 | 0.15 | 108 | V. bursata (10) | 1 |
| Camino 2840 | 82 | 8.2 | 0.14 | 0.42 | 93 | V. bursata (7.5) | 1 |
| Convento 2907 | 115 | 5.7 | 0.36 | 0.29 | 66 | `Chantransia´stage (20) | 3 |
| Escuela | 110 | 7.79 | 0.14 | 0.24 | 102 | N. aff. parmelioides (30) | 1.61 |
| 2702 | P. regulare (20) | ||||||
| P. mexicana (15) | |||||||
| Truchero 2734 | 130 | 7.8 | 0.08 | 0.24 | 91 | P. mexicana (15) | 1 |
| Cancha 2719 | 369 | 5.7 | 2.48 | 2.12 | 46 | without algae | 5 |
| Guadalupe Victoria 2491 | 347 | 1.6 | 2.49 | 30.04 | 37 | S. tenue 10 | 5 |
Table 7 Spearman’s rank correlations between the MEQI and physicochemical and hydromorphological characteristics of validation sampling sites in the Basin of Mexico (for abbreviation codes of the environmental variables see Table 1).
| Coeficient | K25 | OS | HQ | DIN | SRP |
|---|---|---|---|---|---|
| r Pearson | 0.79 | -0.80 | -0.77 | 0.75 | 0.94 |
| R2 | 0.62 | 0.64 | 0.59 | 0.56 | 0.87 |
| p-value | 1.37 | 8.15 | 3.12 | 6.56E | 1.84 |
| E-5 | E-6 | E-5 | -5 | E-10 |
Discussion
The most important causes of environmental degradation in these montane rivers have been the alteration of the riverbed structure and the presence of hydraulic infrastructure such as dams, diversion channels, and pipelining of springs, leading to the loss of habitat heterogeneity and/or physical fragmentation. These alterations have been historically overlooked in the region, with intensive extraction of surface run-off and groundwater without prior ecological knowledge or any governmental regulation to maintain an ecological equilibrium (Caro-Borrero et al., 2017; Sánchez, 2007). In general, the highest nutrient concentrations (evaluated as SRP and DIN) and the lowest OS were observed mainly in the lower reaches of the rivers. This condition highlights the increase in degradation of ecological quality, which leads to the loss of habitat and ecosystem services, and in some cases may even represent a risk to human health (Bonilla-Lemus et al., 2014; Mazari-Hiriart et al., 2014).
The greater macroalgal richness and diversity found in most headwaters of sampled rivers, including for example C. wrangelii, N. aff. parmelioides, P. regularis, B. gelatinosum, Paralemanea mexicana, V. bursata, and P. mexicana, were related to potential reference conditions described in the region by other studies (Carmona-Jiménez & Caro-Borrero, 2017; Rodríguez-Flores & Carmona-Jiménez, 2018).
The macroalgal diversity was represented by a resilient community typically associated with montane rivers of central Mexico (above 2,300 m). Affinities of macroalgal communities between the Basin of Mexico and temperate eastern regions of North America indicate a possible biogeographic connection with the Nearctic region under similar environmental requirements (Sheath & Cole, 1992).
Our results suggest that the specimens studied tend to exhibit dispersal patterns similar to those described previously (Branco et al., 2014). Species of Cyanobacteria, Chlorophyta, and Xanthophyceae (Heterokontophyta) have a broad range of different ecological requirements that determine their dominance in many aquatic ecosystems. This ability results in a wider ecological and geographic distribution (Bojorge-García et al., 2010; Sheath & Cole, 1992). Thus, we observed that Cyanobacteria and Chlorophyta species with higher dispersal abilities -i.e., spores and resistant vegetative fragments, which facilitate dispersion and desiccation tolerance- are affected by local environmental variables -e.g., canopy cover-, whereas Rhodophyta (B. gelatinosum and Paralemanea mexicana), which have low dispersal abilities and long life cycles, are apparently influenced by local variables -e.g., temperature and current velocity- and reflect the conditions of long-term water chemistry (Stacheva & Sheath, 2016).
Although some macroalgae species such as P. regulare and P. mexicana were observed in the middle and lower river reaches, the deleterious effects of anthropogenic pressures were apparent in terms of percent coverage, richness, and species diversity. The HQ was of special relevance since it was found to be significantly correlated with nutrient enrichment and the changes associated with the riparian zone, substratum diversity, channel fragmentation, and water retention, all properties related to processes that favor nutrient enrichment and accumulation. Additionally, morphological and functional features of algal populations and their relationship to the aquatic environment were recognized.
Cyanobacteria species such as N. aff. parmelioides and C. wrangelii can fix atmospheric nitrogen under limiting conditions and form important percent coverage in long segments of Central Mexican rivers (Bojorge-García et al., 2010; Rodríguez-Flores & Carmona-Jiménez, 2018). Stancheva and Sheath (2016) point out that the abundance of heterocystous cyanobacteria such as Nostoc and Coleodesmium are a promising metric for bioevaluations, since they are consistently reported as being negatively correlated with the amount of dissolved nitrogen in the water. Some species previously reported as highly tolerant to ecological degradation (Loza et al., 2013; Pawlik-Skowrońska, 2003), such as M. aff. autumnalis and Stigeoclonium tenue, were associated with low HQ, decreased water flow, and increased nutrients. Algae possess high nutrient-binding capacities due to the presence of polysaccharides, proteins, or lipids on the surface of their cell walls, which contain functional groups like aminos, hydroxyls, carboxyls and sulfates, and can act as binding sites for nutrients and even metals (Mehta & Gaur, 2005). Representative species of the good HQ species group, as well as an increase in nutrients, are generally observed in protected natural areas with considerable recreational activity. In particular, P. regulare, V. bursata, Ulothrix sp., Spirogyra sp., Cladophora sp., and P. mexicana are common inhabitants of oligotrophic to mesotrophic peri-urban rivers in the Trans-Mexican Volcanic Belt (Bojorge-García et al., 2010).
Macroalgae are seldom used on their own in stream bioassessments, but are grouped with phytobenthos or macrophyte systems (Stancheva & Sheath, 2016), with only a few exceptions (Schneider & Lindstrøm, 2009, 2011). In the montane rivers of the Basin of Mexico, benthic macroalgae far outnumber aquatic macrophytes, and ecomorphological responses to spatial and temporal changes are short term. Since biological indices aim to assess specific situations based on local conditions and local biodiversity, we propose the use of the MEQI to assess the ecological quality in this particular region on the basis of its own macroalgal flora. Numerous species of algae were present in all surveyed rivers, and many of them may be regarded as reference species for the ecological quality of high montane rivers in the Trans-Mexican Volcanic Belt. The set of species presented here should be considered in future biomonitoring protocols, with the aim of reaching regional agreements and public policy implementations that avoid further degradation of the peri-urban rivers in the Basin of Mexico. The great morphological variation within Microcoleous, Nostoc, and Spirogyra populations suggests the existence of undescribed species whose taxonomic identity may be confirmed with molecular tools and the assessment of habitat preferences. Ecological quality is a holistic concept, not confined to a single taxonomic group, but rather requiring the understanding of different biological groups and their interactions within a particular catchment area (Kelly, 2013); different groups respond to different pressures, allowing us to evaluate ecological quality in an integrative way. These bioassessment methods are intended to detect impairment rather than to diagnose cause, since many pressures act in a combined, not isolated way. Oftentimes it is not easy to establish a correlation between a particular pressure and its causal relationship (Poikane et al., 2016), and future work to establish potential mechanisms that more precisely link river conditions will facilitate appropriate restorative actions.

