


 text new page (beta)
 English (pdf)
 Article in xml format
 Article references
 Send this article by e-mail
 Cited by SciELO
  Similars in
SciELO
Similars in
SciELO 
 Permalink
Introduction
The genus Lecane is a widespread and abundant group of small to medium-sized rotifers, which inhabit fresh and saline waters (Segers, 1995). All species are substratum dwellers living mainly in littoral habitats, but also occur in floating and submerged vegetation (Koste & Shiel, 1990; Kuczynska-Kippen, 2007). Many species are considered cosmopolitan, but a considerable number have restricted distributions (Segers, 1996). Lecane is probably one of the most diverse rotifer genera in the tropics (Sanoamuang, 1996; Segers & Savatenalinton 2010), including around 200 valid species worldwide (Segers, 2007; Segers & Savatenalinton, 2010). This great diversity, the high intraspecific variation in many species, and the confusion caused by the distortion of the lecanid specimens when they are inadequately fixed (Segers, 1993, 1995), has made the taxonomy of Lecane difficult to resolve. Additionally, a poor taxonomic knowledge due to incomplete or superficial descriptions in several species further confounds the taxonomy of Lecane (Segers, 1995).
One notably cosmopolitan species of Lecane is L. bulla, which can be found in a variety of water bodies around the world (Segers, 1995). Lecane bulla is characterized by the presence of an egg-shaped lorica variable in the degree of stiffness, a ventral head aperture margin with a very deep sinus, and a relatively long toe which can present either a terminal fissure and long pseudoclaws or present fused pseudoclaws (Segers, 1995). The male of L. bulla is smaller than the female and has an elongate vermiform body and a terminal foot with 2 toes (Segers & Rico-Martínez, 2000). Lecana bulla exhibits morphological plasticity, but further study is required to resolve the taxonomic status of morphological variants (Sharma & Sharma, 2014; Walsh et al., 2009). In his taxonomic revision, Segers (1995) listed 11 L. bulla synonyms and recognize 3 variants (L. bulla diabolica, L. bulla f. goniata, and L. bulla f. styrax), and more recently synonymized L. bulla f. goniata with L. bulla (Segers, 2007). Because of the small body size, morphological variation, and morphological austerity (with the scarcity of taxonomically relevant morphological features) of L. bulla, it is difficult to identify specimens to the species level (Mills et al., 2017; Segers, 2007).
The recent development of DNA-based taxonomy allows a new approach to the study of diversity in rotifers. DNA-based taxonomy techniques provide an objective means to assess biodiversity through the analysis of variation in molecular markers to delimit species (Fontaneto et al., 2015). Markers such as the nuclear Internal Transcribed Spacer (ITS), the mitochondrial 16S rRNA and cytochrome c oxidase subunit 1 (COI) genes have proven to be useful in the investigation of cryptic speciation, population differentiation, and species delineation in some rotifer species (Fontaneto et al., 2015; Mills et al., 2017; Papakostas et al., 2005). In L. bulla few molecular studies have been carried out. Using COI and ITS as molecular markers, Walsh et al. (2009) reported 3 cryptic species in 22 populations of L. bulla from the Big Bend National Park and Cuatro Ciénegas territory in the Chihuahuan desert. Similarly, in their DNA barcoding study, García-Morales and Elías-Gutiérrez (2013) reported 8 genetically divergent clusters of L. bulla collected in 18 populations from southeast Mexico.
In this study, we analyzed variation in COI gene sequences of several populations of Lecane bulla along water bodies in Central Mexico in order to elucidate if L. bulla population across this region of Central Mexico present cryptic species, and identify the phylogenetic relationships between Central Mexican populations of L. bulla and those from previous published data from South and North Mexico.
Materials and methods
We collected samples in 5 water bodies along the Trans-Mexican Volcanic Belt (TMVB) in Central Mexico (Fig. 1; Table 1) using a 50 µm mesh size plankton net. We preserved all samples in 96% ethanol. We sorted L. bulla specimens from the samples under a compound microscope, rinsed with distilled water to remove debris, and transferred into PCR tubes for DNA extraction. We identified specimens morphologically using the features of the lorica and foot, following the taxonomic key of Segers (1995). In our analyses, we also include COI sequences that were obtained in 20 sampling sites in previous studies (García-Morales & Elías-Gutiérrez, 2013; Walsh et al., 2009). The total of 25 localities are located in the Chihuahuan Desert (CHD) (part of USA and Mexico), TMVB, Gulf of Mexico (GM) and the Yucatán Peninsula (YP) physiographic regions (sensuFerrusquía-Villafranca, 1993) (Fig. 1; Table 1).
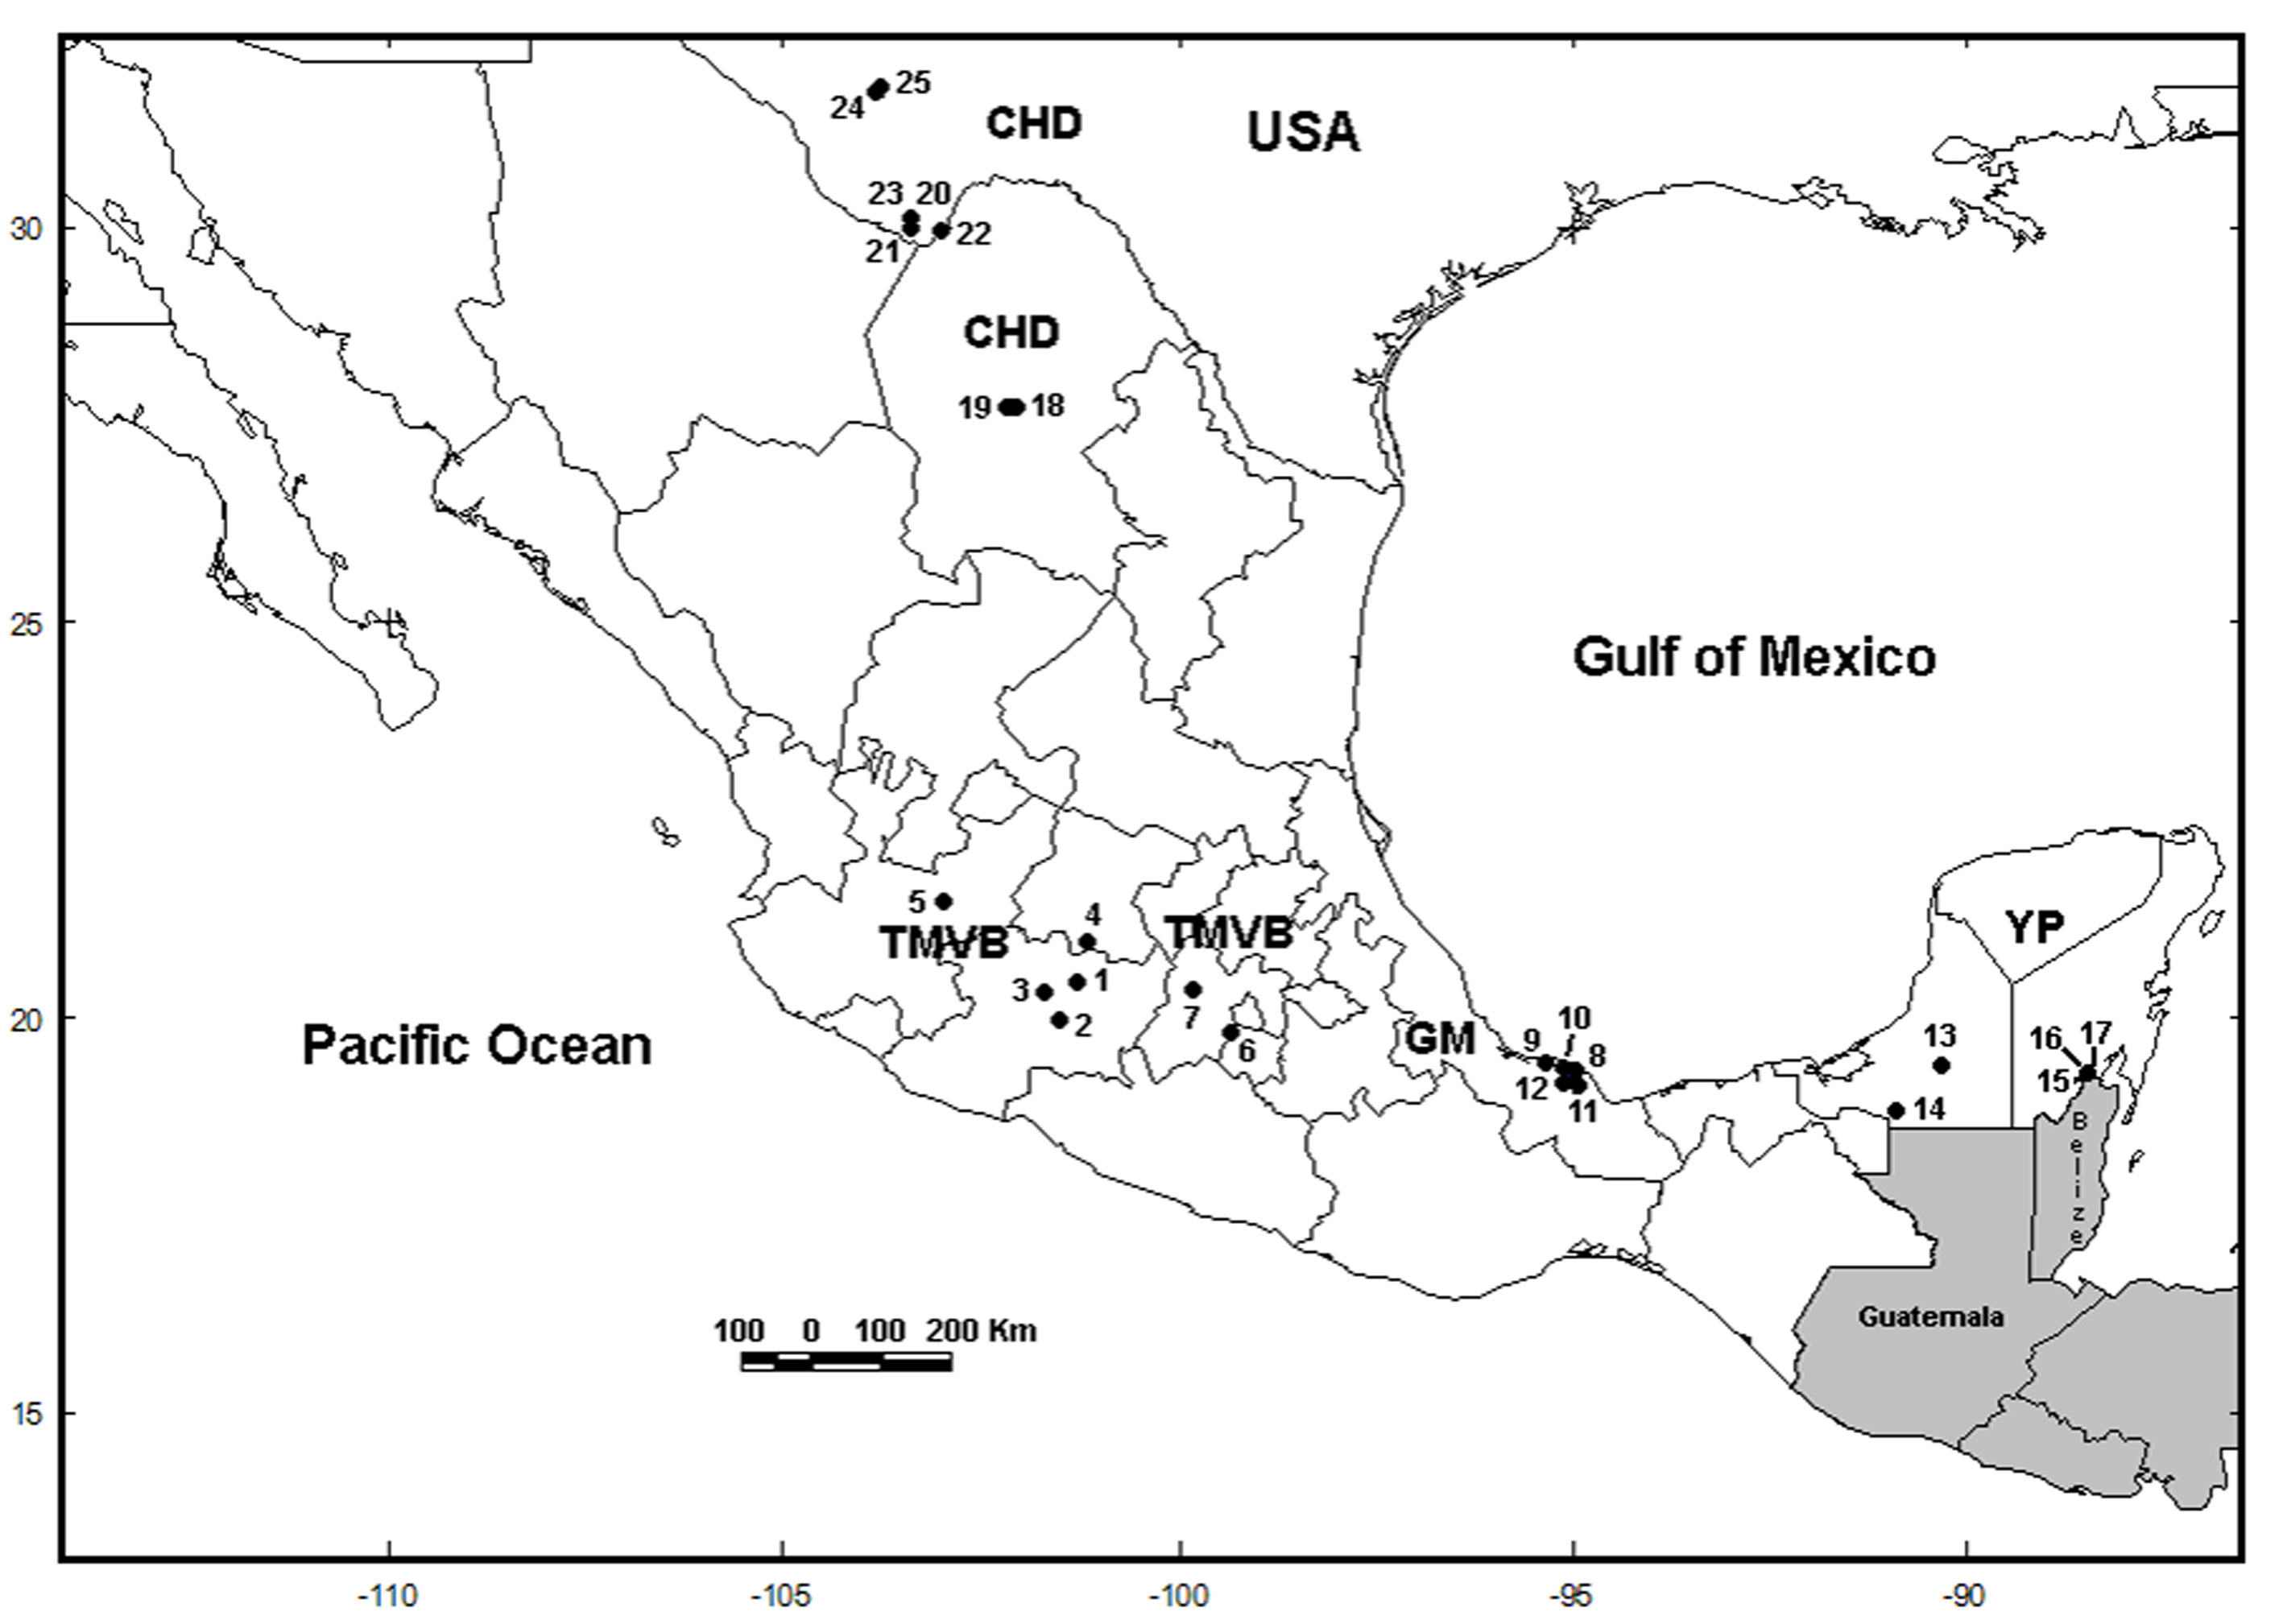
Figure 1 Sample locations of Lecane bulla populations. The numbers on map correspond to the numbers in Table 1. Locations 1 to 5 were collected in this study. USA = United States of America; CHD = Chihuahuan Desert; TMVB = Trans-Mexican Volcanic Belt; GM = Gulf of Mexico; YP = Yucatán Peninsula.
Table 1 Name, acronym and coordinates of the sampling sites, as well as number of individuals sequenced (N) and number of haplotypes (H) for each location. Locations from 1 to 19 belong to Mexico, and locations from 20 to 25 belong to the USA. Samples collected in this study †.
| Location | Locality code |
Collection date |
Geographic coordinates |
State | N | H | Biogeographic province |
| 1. Manantial Huamio † | MH | 21/06/14 | 19.678 N -101.280 W | Michoacán | 6 | 1 | Trans-Mexican Volcanic Belt |
| 2. La Magdalena lagoon † | MAG | 12/07/14 | 19.208 N -101.474 W | Michoacán | 1 | 1 | Trans-Mexican Volcanic Belt |
| 3. Uranden † | URA | 04/09/14 | 19.541 N -101.640 W | Michoacán | 3 | 1 | Trans-Mexican Volcanic Belt |
| 4. La Joya mar lake † | JOY | 27/09/14 | 20.207 N -101.132 W | Guanajuato | 5 | 2 | Trans-Mexican Volcanic Belt |
| 5. Calderón dam † | CAL | 21/08/15 | 20.695 N -102.941 W | Jalisco | 4 | 1 | Trans-Mexican Volcanic Belt |
| 6. Zempoala lagoon | ZEM | 23/06/11 | 19.051 N -99.316 W | State of México | 1 | 1 | Trans-Mexican Volcanic Belt |
| 7. Emiliano Zapata lagoon | EZ | 22/06/11 | 19.584 N -99.797 W | State of México | 1 | 1 | Trans-Mexican Volcanic Belt |
| 8. Capulteol lagoon | CAP | 28/08/10 | 18.549 N -94.968 W | Veracruz | 5 | 2 | Gulf of Mexico |
| 9. Majahual lagoon | MAJ | 29/08/10 | 18.659 N -95.306 W | Veracruz | 2 | 1 | Gulf of Mexico |
| 10. Escondida lagoon | ESC | 27/08/10 | 18.592 N -95.088 W | Veracruz | 4 | 2 | Gulf of Mexico |
| 11. Apompal lagoon | APO | 27/08/10 | 18.376 N -94.963 W | Veracruz | 3 | 1 | Gulf of Mexico |
| 12. Catemaco lake | CAT | 27/08/10 | 18.417 N -95.092 W | Veracruz | 1 | 1 | Gulf of Mexico |
| 13. Silvituc lagoon | SIL | 26/06/11 | 18.64 N -90.289 W | Campeche | 3 | 1 | Yucatán Peninsula |
| 14. Rumbo al Tigre II | TIG | 06/02/11 | 18.04 N -90.871 W | Campeche | 1 | 1 | Yucatán Peninsula |
| 15. Puente Milagros 1 lagoon | PM1 | 14/09/11 | 18.509 N -88.447 W | Quintana Roo | 1 | 1 | Yucatán Peninsula |
| 16. Humedal Puente Milagros | HPM | 14/09/11 | 18.518 N -88.434 W | Quintana Roo | 2 | 1 | Yucatán Peninsula |
| 17. Encantada lagoon | ENC | 07/09/11 | 18.498 N -88.39 W | Quintana Roo | 1 | 1 | Yucatán Peninsula |
| 18. Tío Julio, Cuatro Ciénegas | TJ | - | 26.946 N -102.059 W | Coahuila | 1 | 1 | Chihuahuan Desert |
| 19. Poza Tortugas, Cuatro Ciénegas | PT | - | 26.931 N -102.124 W | Coahuila | 1 | 1 | Chihuahuan Desert |
| 20. Cattail Spring Pool D, Big Bend National Park. | CSD | - | 29.273 N -103.335 W | Texas | 1 | 1 | Chihuahuan Desert |
| 21. Cattail Spring Pool H, Big Bend National Park. | CSH | - | 29.273 N -103.336 W | Texas | 1 | 1 | Chihuahuan Desert |
| 22. Río Grande Village Pond, Big Bend National Park. | RGV | - | 29.178 N -102.953 W | Texas | 1 | 1 | Chihuahuan Desert |
| 23. Croton Springs, Big Bend National Park. | CRS | - | 29.344 N -103.347 W | Texas | 1 | 1 | Chihuahuan Desert |
| 24. San Solomon Spring wetland, Reeves Co. | SSS | - | 30.944 N -103.784 W | Texas | 1 | 1 | Chihuahuan Desert |
| 25. East Sandia Preserve, Reeves Co. | ES | - | 30.990 N -103.728 W | Texas | 1 | 1 | Chihuahuan Desert |
| 26. DQ089731 | DQ | - | - | State of México | 1 | 1 | Trans-Mexican Volcanic Belt |
We conducted the DNA extraction (using single specimens) and PCR amplification of the COI gene according to García-Morales and Elías-Gutiérrez (2013). We used primers LCO1490: 5´-GGTCAACAAATCATAAAGATATTG G-3´ and HCO2198: 5´-TAAACTTCAGGG TGACCAAAAAATCA-3´ (Folmer et al., 1994). We sent PCR products in the High Throughput Genomics Center in Seattle, USA for sequencing. Newly generated sequences were deposited in GenBank database under accession numbers MN983079-MN983097. Additionally, 34 sequences were obtained from GenBank including L. bulla from the GM, YP and the CHD (Fig. 1), reported by García-Morales and Elías-Gutiérrez (2013), García-Varela and Nadler (2006) and Walsh et al. (2009) (accession numbers JX216642-JX216644, JX216646-JX216657, JX216659-JX216666, JX216668-JX216669, EU188927EU188933, EU188935, DQ089731). Sequences were aligned in MEGA 6.0 (Tamura et al., 2013) using ClustalW with default settings and subsequently checked by eye.
We used Bayesian inference (BI) and maximumlikelihood (ML) analyses to infer the phylogenetic relationships of the L. bulla populations. We conducted the BI and ML analyses using MrBayes 3.1.2 (Ronquist & Huelsenbeck, 2003) and RaxML 1.5 (Stamatakis et al., 2008) respectively. For the BI analysis, we used the jModelTest 2.1.1 (Darriba et al., 2012) to select the model of molecular evolution that best fit the dataset (TVM+G) under the Akaike information criterion (AIC). The settings for the BI analysis were 4 simultaneous Markov Chain Monte Carlo (MCMC) runs for 4 million generations, with trees sampled every 100 generations. We assessed convergence between runs by monitoring the standard deviation of split frequencies and by using the effective sampling size (ESS) criterion (> 200) in Tracer v.1.7 (Rambaut et al., 2018), discarding 25% of generations as burn-in to construct the majority-rule consensus tree. For ML analysis we used a GTR+G model as implemented in RaxML 1.5. We ran ML analysis with 10,000 bootstrap replications. We used Brachionus ibericus (accession number GQ894740) as outgroup in both analyses.
To have a graphic representation of the relationship among haplotypes, we constructed a haplotype network using the TCS method (Clement et al., 2002) implemented in the PopART software (http://popart.otago.ac.nz).
We applied 3 methods of molecular species delimitation: 1) generalized mixed yule-coalescent model (GMYC) (Pons et al., 2006). We used this model to search for evidence of independently evolving entities considered to be species. For the GMYC model we generated an ultrametric tree using BEAST 2.1.3 (Bouckaert et al., 2014). The parameters comprised a GTR+G substitution model, a relaxed lognormal clock, and a birth-death prior (Tang et al., 2014). We ran the analysis with 70 million MCMC sampling every 1000 generations. Because of the absence of a molecular clock specific to Rotifera, we used a calibration clock for COI gene of 1.76% sequence divergence per Myr used in aquatic invertebrates (Wilke et al., 2009). We checked the MCMC run for convergence in Tracer 1.6 (Rambaut et al., 2013). We combined trees in Tree-Annotator 2.1.2 using a maximum credibility tree, with the first 10% discarded as burn-in. We ran the GMYC model through the GMYC webserver, using the single threshold option (http://species.h-its.org/gmyc/). 2) Poisson tree processes model (PTP) (Zhang et al., 2013). We also applied this model (using PTP and bPTP versions) to search for evidence of independently evolving entities considered to be species. This method uses a phylogenetic tree as input, optimizing differences in branching events in terms of number of substitutions, and adding support values to those branching events. We used the ML tree generated in the phylogenetic analysis and we ran the analysis with 500,000 MCMC generations on the PTP webserver (http://species.h-its.org/). 3) Automatic barcode gap discovery (ABGD). This model clusters sequences based on the genetic distances by intending to detect differences between intra and interspecific distances (barcode gap). Genetic distances among individuals belonging to the same species are assumed to be smaller than distance among individuals from different species (Puillandre et al., 2012). We carried out ABGD analysis through its online webserver (http://wwwabi.snv.jussieu.fr/public/abgd/abgdweb.html) using default settings.
We calculated the number of haplotypes for each collecting locality (Fig. 1). In addition, we also calculated the number of haplotypes, haplotype diversity (Hd), and nucleotide diversity (π) for each cryptic species discriminated by the species delimitation analyses. We calculated genetic distances (uncorrected p-values) within and among the putative species discriminated by the species delimitation analyses in MEGA 6.0 (Tamura et al., 2013).
Results
The final alignment of COI gene was 599 bp, with 192 polymorphic sites and 178 parsimony informative sites, defining 23 unique haplotypes from 53 sequences (19 de novo and 34 from GenBank). Most of the haplotypes were found in a single population, but 4 haplotypes were shared between some populations (H2, H10, H13 and H17) (Fig. 2; Table 2). La Joya, Capulteol, and Escondida had the highest number of haplotypes (2) (Table 1).
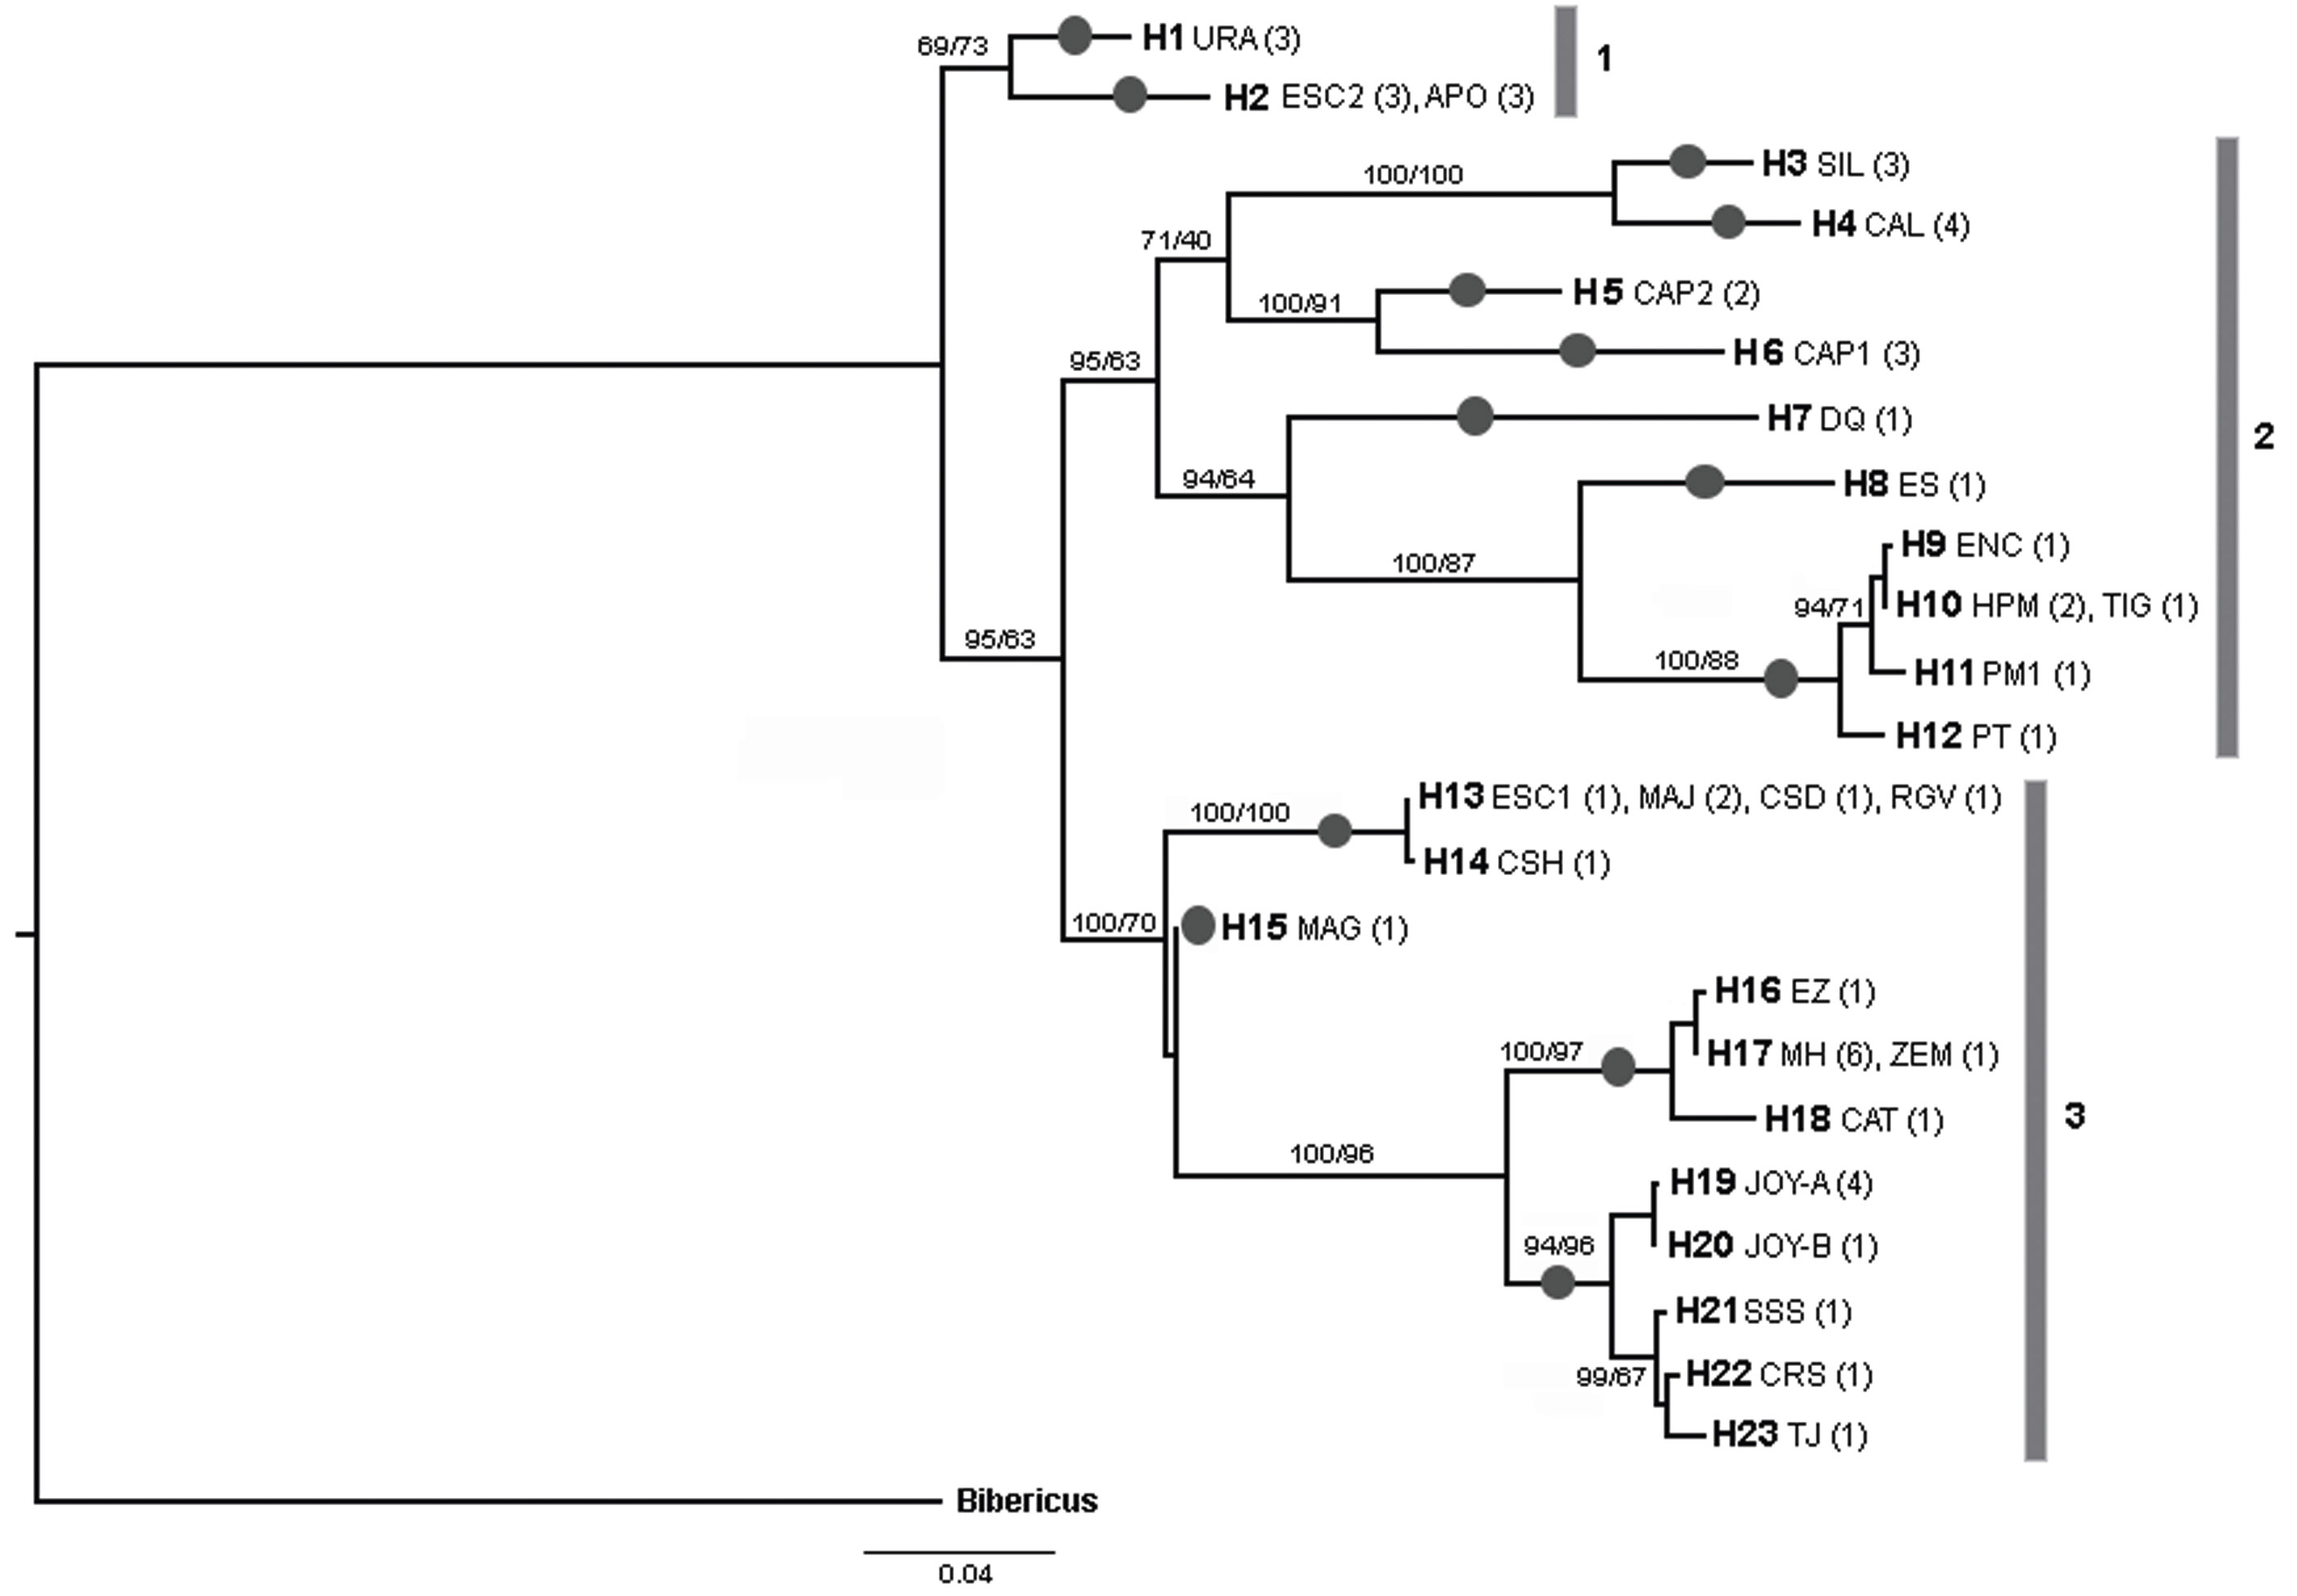
Figure 2 Bayesian COI phylogram showing the relationship of the 23 Lecane bulla haplotypes. Haplotype numbers are accompanied by the water body in which they were isolated. Acronyms of the locations are those presented in Table 1; values within parentheses indicate the number of individuals displaying that particular haplotype in certain area. Numbers on major branches are the percentages of branch support in the Bayesian (posterior probability) and maximun-likelihood (bootstrap) analyses respectively. Number bars (1-3) delineate the 3 major clades. Dark circles over branches indicate a putative species delimited by all the species delimitation methods.
Table 2 Shared haplotypes and their locations.
| Shared haplotypes | Sequences | Locations |
| H2 | JX216652 JX216653 JX216654 JX216655 JX216656 JX216657 | 10. Escondida (ESC) Apompal (APO) |
| H10 | JX216660 JX216661 JX216663 | 16. Humedal Puente Milagros (HPM) 14. El Tigre II (TIG) |
| H13 | JX216649 JX216650 JX216651 EU188928 EU188935 | 10. Escondida (ESC) 9. Majahual (MAJ) 20. Cattail Spring D (CSD) 22. Rio Grande Village (RGV) |
| H17 | MN983079 MN983080 MN983081 MN983082 MN983083 MN983084 JX216666 | 1. Manantial Huamio (MH) 6. Zempoala (ZEM) |
The trees obtained by the BI and ML methods were identical and retrieved 3 highly divergent monophyletic groups (12% minimum divergence between groups) (clades 1-3) (Fig. 2). Monophyletic group 1 was formed by samples from 3 locations (Uranden, Escondida and Apompal) distributed in the TMVB and GM (Fig. 1; Table 1). Monophyletic group 2 was formed by samples from 9 locations (Silvituc, Calderon, Capulteol, East Sandia, Encantada, Humedal Puente Milagros, Puente Milagros 1, El Tigre II and Poza Tortugas), which are located in the TMVB, GM, YP and CHD physiographic regions (Fig. 1; Table 1). Finally, monophyletic group 3 was represented in 14 locations (Escondida, Majahual, Cattail Spring Pool D, Cattail Spring Pool H, Rio Grande Village, La Magdalena, Emiliano Zapata, Manantial Huamio, Zempoala, Catemaco, La Joya, San Salomon Spring, Croton Springs and Tio Julio), located in the TMVB, GM and CHD regions (Figs. 1, 2; Table 1).
In the haplotype network we recognized 13 haplogroups separated by >10 mutational steps (Fig. 3). These groups are concordant with the 13 lineages discriminated by the species delimitation methods (see below).
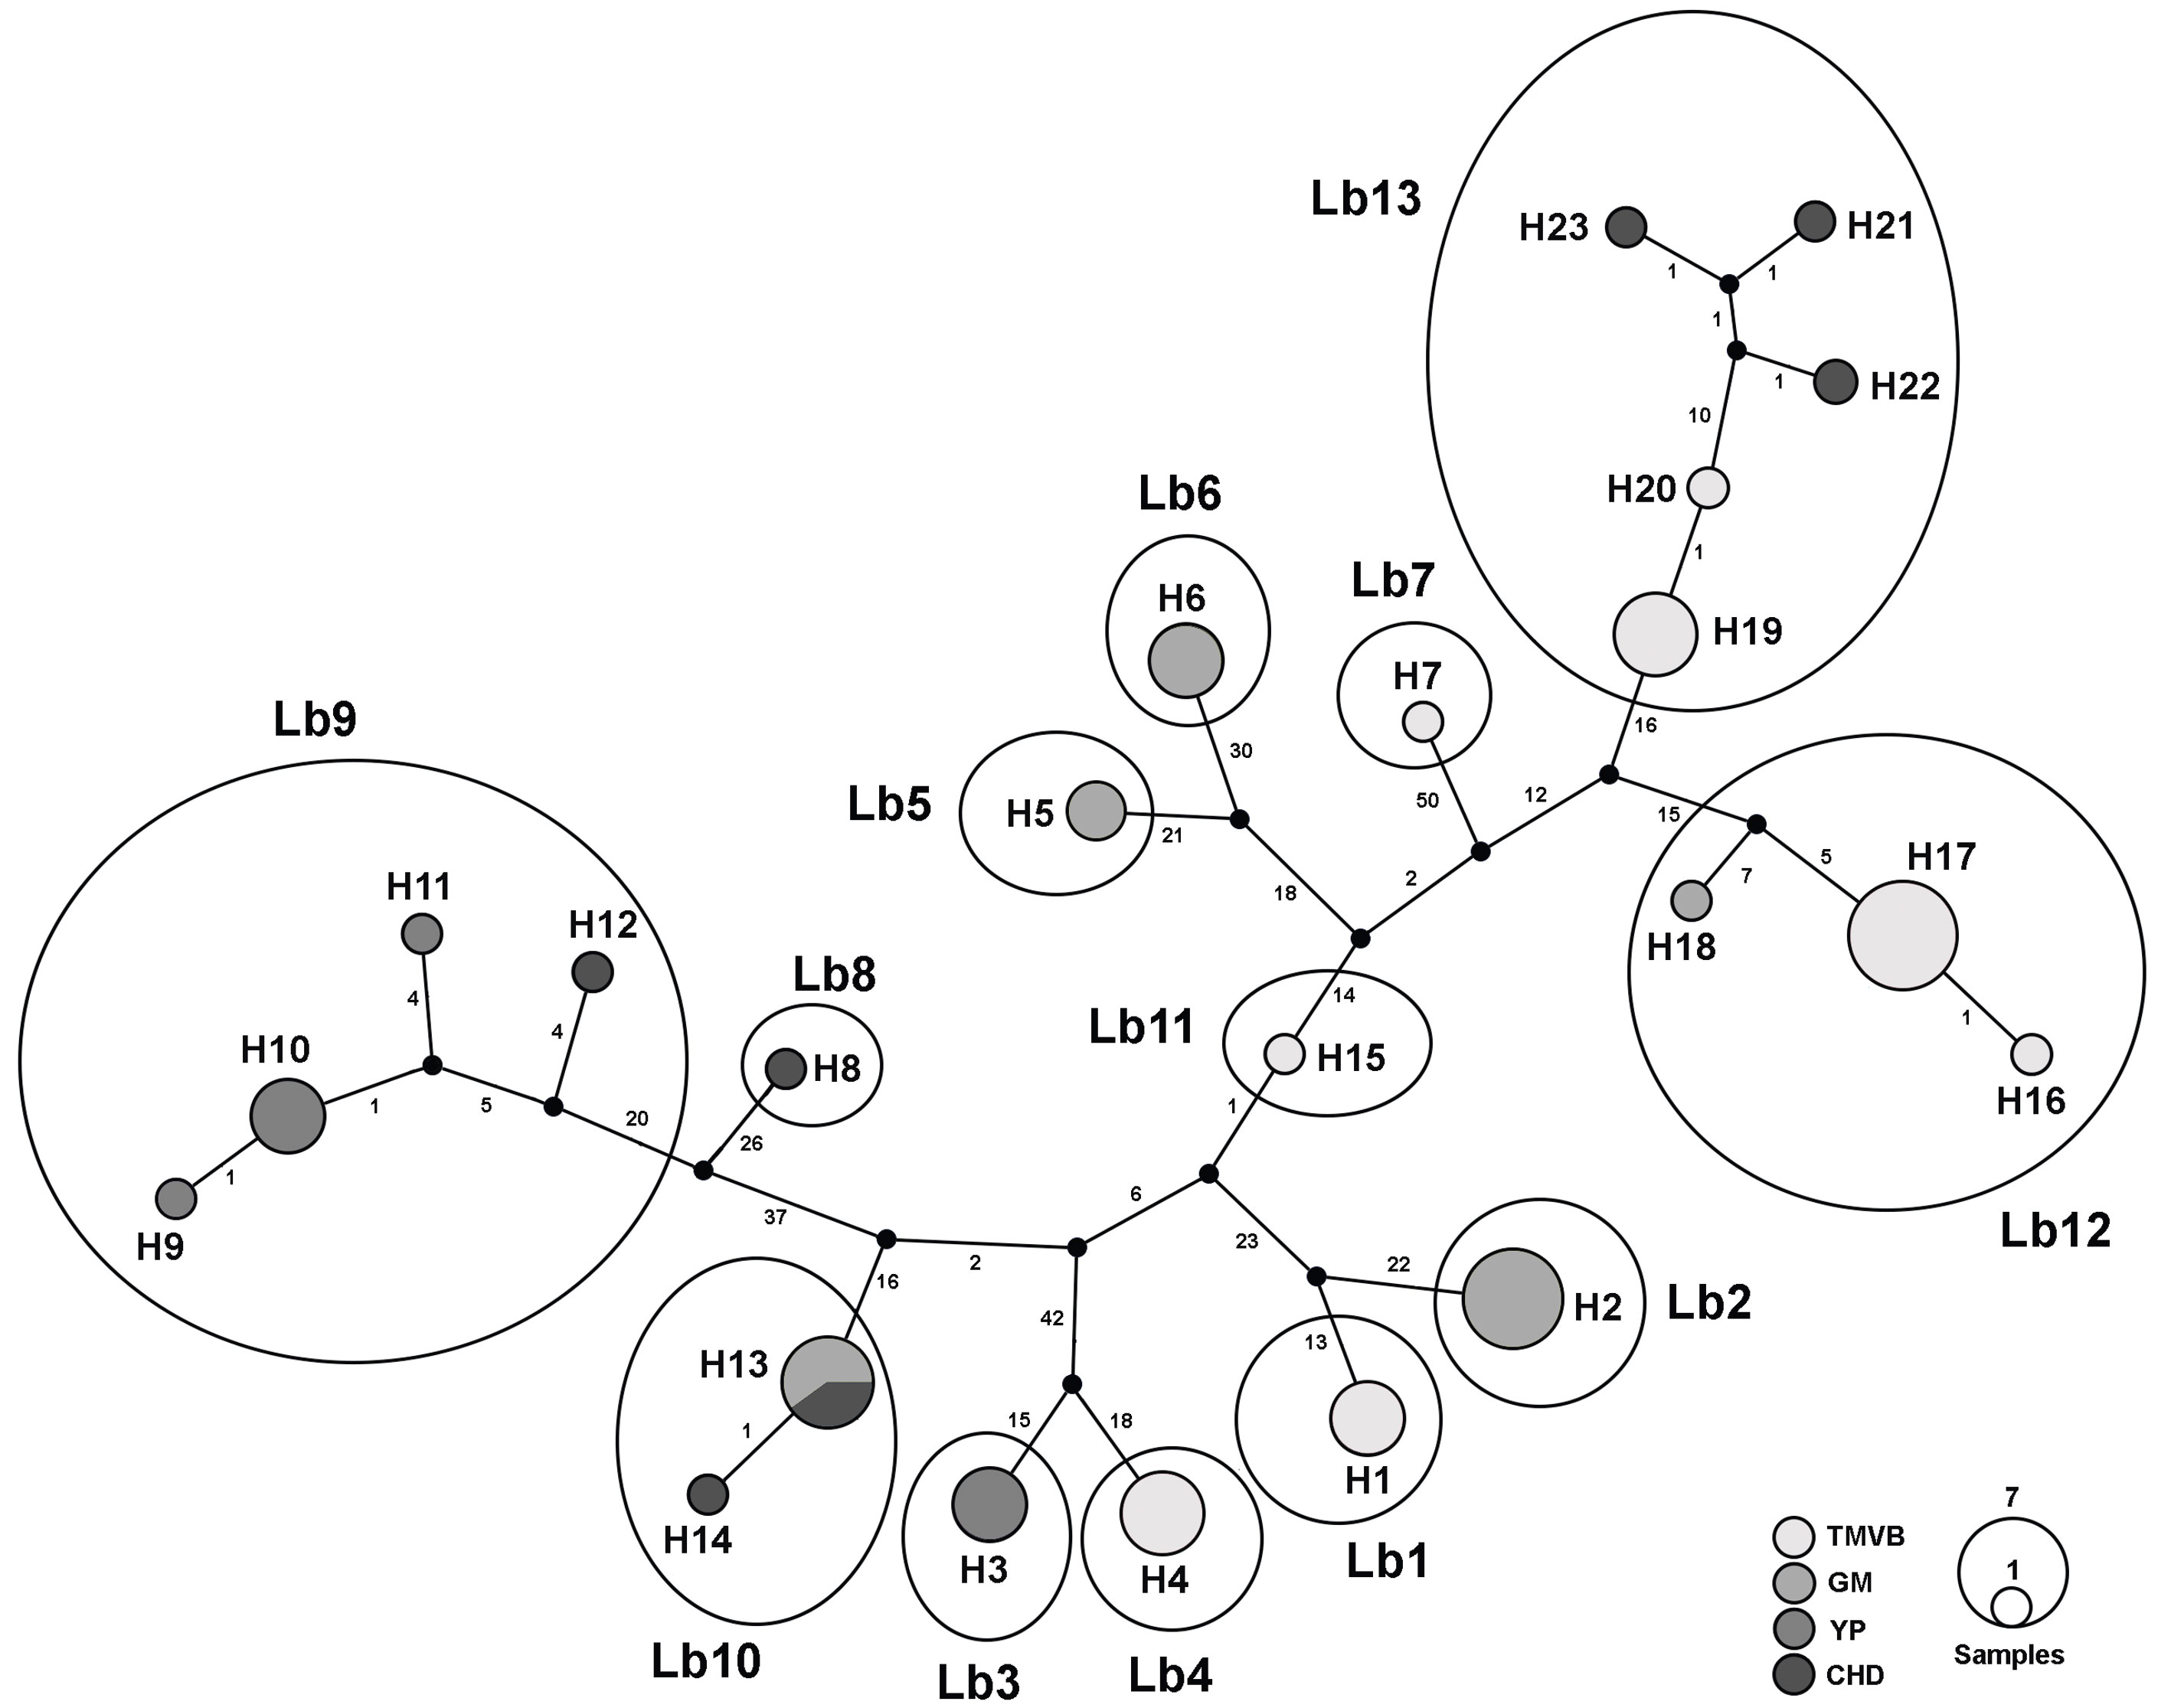
Figure 3 Haplotype network of the 23 L. bulla haplotypes for COI gene. Haplotypes are represented as circles, the size of which is proportional to the number of individuals possessing the haplotype. Median vectors, which represent either extant unsampled sequences or extinct ancestral sequences, are indicated by small black circles. Numbers on the main long lines represent the number of mutational steps. Grayscale circles represent biogeographic provinces where sampling sites are located (Fig. 1; Table 1). Circles followed by H and a number represent the different haplotypes. Haplotypes enclosed by large ellipses and followed by Lb plus a number represent the putative species.
ABGD, PTP and GMYC methods consistently discriminated the same 13 lineages (Fig. 2). Maximum uncorrected p distances within the 13 lineages ranged from 0 to 2%, whereas, minimum distances among the 13 lineages ranged from 4.6 to 16.8% (Table 3). Monophyletic group 1 was divided in 2 lineages by the species delineation methods (Fig. 2). Similarly, due to its high internal divergence, the monophyletic groups 2 and 3 (11.7% and 7.4% respectively) were divided in 7 and 4 lineages respectively by the species delimitation approaches (Fig. 2).
Table 3 Percentage of uncorrected genetic distances of COI gene. On diagonal maximum genetic distances within the 13 Lecane bulla putative species and under the diagonal minimum genetic distances among the 13 putative species discriminated by the species delineation methods.
| Lineage | Lb1 | Lb2 | Lb3 | Lb4 | Lb5 | Lb6 | Lb7 | Lb8 | Lb9 | Lb10 | Lb11 | Lb12 | Lb13 |
| Lb1 | 0 | ||||||||||||
| Lb2 | 6.4 | 0 | |||||||||||
| Lb3 | 13.5 | 14.4 | 0 | ||||||||||
| Lb4 | 13.7 | 13.9 | 6.0 | 0 | |||||||||
| Lb5 | 11.7 | 12.1 | 13.2 | 13.0 | 0 | ||||||||
| Lb6 | 12.8 | 13.3 | 13.3 | 14.3 | 9.3 | 0 | |||||||
| Lb7 | 14.6 | 14.8 | 13.5 | 15.2 | 13.9 | 15.2 | - | ||||||
| Lb8 | 14.4 | 14.3 | 15.9 | 15.2 | 14.8 | 15.4 | 14.1 | - | |||||
| Lb9 | 13.3 | 13.5 | 15.4 | 14.6 | 15.0 | 15.0 | 15.0 | 9.1 | 1.9 | ||||
| Lb10 | 11.0 | 10.8 | 13.7 | 13.3 | 11.3 | 12.8 | 13.0 | 14.4 | 14.3 | 0.2 | |||
| Lb11 | 6.8 | 8.2 | 11.7 | 12.2 | 9.7 | 11.3 | 12.1 | 13.2 | 12.8 | 4.6 | - | ||
| Lb12 | 14.3 | 14.1 | 14.8 | 15.4 | 13.7 | 15.0 | 14.1 | 16.5 | 14.6 | 13.2 | 9.1 | 2.0 | |
| Lb13 | 13.3 | 13.5 | 13.9 | 14.1 | 13.9 | 15.4 | 14.1 | 16.8 | 16.3 | 12.6 | 8.0 | 6.6 | 2.0 |
The number of haplotypes by location was low ranging from 1 to 2 (Table 1). From the 13 lineages delimited, 9 are formed by 1 haplotype whereas the other 4 are formed by 2 or more haplotypes (Table 4). In general, haplotype diversity (Hd), and nucleotide diversity (π) for the 13 putative species were low. However, the haplotype diversity in the putative species Lb9 and Lb13 was high. The nucleotide diversity was high only for the putative species Lb13 (Table 4).
Table 4 Cryptic species and the number of individuals sequenced (N) and number of haplotypes (H) for the COI gene for Lecane bulla. Hd and π are the haplotype and nucleotide diversity respectively with the standard deviation in parentheses.
| Cryptic species | N | H | Hd | π |
| Lb1 | 3 | 1 | 0.000 | 0.000 |
| Lb2 | 6 | 1 | 0.000 | 0.000 |
| Lb3 | 3 | 1 | 0.000 | 0.000 |
| Lb4 | 4 | 1 | 0.000 | 0.000 |
| Lb5 | 2 | 1 | 0.000 | 0.000 |
| Lb6 | 3 | 1 | 0.000 | 0.000 |
| Lb7 | 1 | 1 | 0.000 | 0.000 |
| Lb8 | 1 | 1 | 0.000 | 0.000 |
| Lb9 | 6 | 4 | 0.800 (0.172) | 0.00972 (0.00403) |
| Lb10 | 6 | 2 | 0.333 (0.215) | 0.00056 (0.00036) |
| Lb11 | 1 | 1 | 0.000 | 0.000 |
| Lb12 | 9 | 3 | 0.417 (0.191) | 0.00556 (0.00386) |
| Lb13 | 8 | 5 | 0.786 (0.151) | 0.01514 (0.00377) |
Discussion
We based our phylogenetic analyses and species delimitation methods on a single mitochondrial gene (COI), which has a higher evolutionary rate with respect to nuclear markers as ITS, and this could bias estimates on genetic diversity (Cieplinski et al., 2017). Despite this, our work offers important results about genetic diversity and cryptic species, similar to the results obtained in other studies based only in the COI gene (e.g., Cieplinski et al., 2017; Moreno et al., 2017; Obertegger et al., 2014; Xiang et al., 2011). However, we must also say that our results must be taken with caution, since putative species delimited here must be corroborated with more molecular markers and other evidences as morphology, ecology and mating experiments.
Genetic differentiation and cryptic species have previously been identified in rotifers using mitochondrial COI and 16S rRNA genes (Derry et al., 2003; Gómez et al., 2002; Mills et al., 2017; Papakostas et al., 2005; Schröder & Walsh, 2007; Xiang et al., 2017), and nuDNA ITS (Gilbert & Walsh, 2005; Gómez et al., 2002; Mills et al., 2017; Xiang et al., 2017) as molecular markers. These previous studies with COI, ITS and 16S have reported sequence divergences between lineages of more than 4% indicative of cryptic species. In some cases, cryptic species found in these genetic analyses were supported with the results of mating experiments (Gilbert & Walsh, 2005; Schröder & Walsh, 2007; Suatoni et al., 2006).
In the present study, the 3 species delimitation tests (ABGD, PTP and GMYC) provided the same estimation of diversity, revealing the existence of 13 cryptic species within the L. bulla populations studied. Three of these cryptic species were firstly reported by Walsh et al. (2009) from different locations in the CHD. García-Morales and Elías-Gutiérrez (2013) also reported 8 cryptic species from different locations from GM and YP. COI sequences from García-Morales and Elías-Gutiérrez (2013), García-Varela and Nadler (2006) and Walsh et al. (2009) together formed 10 cryptic species. With the new sampling undertaken in this study in TMVB, 3 new cryptic species were added to the complex (Lb1, Lb4 and Lb11), each of them found in distinct water bodies (Uranden in Patzcuaro Lake, Calderon Dam and La Magdalena Lake, respectively).
Uncorrected genetic distances between the 13 cryptic species were high exceeding the 2% value proposed by Hebert et al. (2003) to delineate species. These genetic distances were similar to those found among species within other rotifer species complexes (4-17%, Derry et al., 2003; Kimpel et al., 2015; Mills et al., 2017; Xiang et al., 2011). Also, we were able to identify a clear barcoding gap with maximum genetic distances within species of 2% and minimum between species of 4.6%. Such genetic distances are non-overlapping, as the divergence among organisms belonging to the same species is smaller than divergence among organisms from different species (Puillandre et al., 2012). The high divergences reported here exceed the values usually found between congeneric species (Gómez et al., 2002), supporting the 13 cryptic species as independent evolutionary entities within the L. bulla complex.
Morphological characters traditionally used for species delineation in Lecane (lorica and foot), divided the studied populations here in only 1 morphospecies: L. bulla with low morphological variation (Segers, 1995), indicating a level of morphological stasis as has been observed in the B. plicatilis complex (Campillo et al., 2005). In addition, the significant genetic divergences found in this study are evidence for cryptic speciation in L. bulla as was also inferred for the B. plicatilis complex (Gómez et al., 2002; Mills et al., 2017). This demonstrates that taxonomy based on morphological features alone is not efficient for uncovering the true diversity in this littoral lecanid. Several faunistic studies have highlighted the lack of taxonomic resolution in L. bulla, as well as in other Lecane taxa: e.g. L. lunaris, L. leontina, and L. quadridentata (Segers & Savatenalinton, 2010; Walsh et al., 2009). These studies have suggested the need to conduct more comprehensive analyses of L. bulla, considering also the discrete morphological variants (e.g., L. bulla diabolica and L. bulla styrax) (Segers & Savatenalinton, 2010; Sharma & Sharma, 2014; Walsh et al., 2009). To resolve the relationships and taxonomic status among the cryptic species reported here, and those found in future works, additional morphological, physiological and ecological evidence, as well as mating experiments and the analyses of additional molecular markers are necessary.
Most of the cryptic species were found inhabiting only 1 water body or at least a single physiographic region, with the exception of Lb9 (found in YP and CHD), Lb10 (found in GM and CHD), Lb12 (found in GM and TMVB) and Lb13 (found in CHD and TMVB) (Fig. 1 and 2). Cryptic species Lb2 and Lb10, as well as Lb5 and Lb6 were found in sympatry, inhabiting the same water bodies (La Escondida and Capulteol, respectively; Fig. 2), both of which located in the GM region. The 4 physiographic regions from which samples were collected have very distinct environments and geological history. In general, TMVB is formed mainly by mountains with elevations over 2,000 m asl and a temperate climate with average annual temperature of 16 °C (Ferrusquía-Villafranca, 1993). GM and YP are flat plains with heights mainly between 1 and 170 m asl with some parts at 700 m asl (Morán-Zenteno, 1994). These regions have a tropical climate with average annual temperature of 28 °C (Arriaga et al., 2000). CHD region presents elevations of 600-1, 600 m asl and arid climate with temperatures between 35-40 °C during the day. Finally, despite being a desert, CHD harbors an extensive system of thermal springs, as well as streams and pools (Souza et al., 2006).
The 13 cryptic species found in this study displayed a significant genetic divergence. This suggests a long history of isolation between species. In addition, these highly divergent cryptic species also display a high dispersal and colonization capacity for long distances, as well as a high capacity to adapt to different environmental conditions.
For example, cryptic species Lb9, Lb10, Lb12 and Lb13 are distributed in 2 different physiographic regions respectively and are > 700 km apart and separated by biogeographic barriers, such as mountains and deserts. Cryptic species Lb9 is the most widespread, with a range encompassing locations in CHD and YP separated by 1,700 km. Rotifers are dispersed passively by wind and waterfowl through vast regions, even transcontinental (Gómez et al., 2000; Xiang et al., 2011). However, rotifers can also be dispersed through human activities, and a few cases have been reported (Segers, 2001; Segers & De Smet, 2008). Thus, the high divergence observed in cryptic species is unlikely to be due to dispersal limitations. Other factors like local adaptation to the environmental conditions and founder effects (monopolization hypothesis by De Meester et al. [2002]) may be influencing the genetic differentiation of the cryptic species of L. bulla, as is the case of the Brachionus plicatilis and Synchaeta pectinata species complexes (Kimpel et al., 2015; Mills et al., 2017).
The habitats where the 13 cryptic species were found show differences in their water chemistry (Alcocer & Bernal-Brooks, 2010; Souza et al., 2006; Suárez-Morales & Rivera-Arriaga, 1998; Torres-Orozco et al., 1996; Wallace et al., 2005). This could indicate some level of ecological specialization (Alcántara-Rodríguez et al., 2012; Fontaneto et al., 2007; Xiang et al., 2017). It has been shown that certain environmental parameters (e.g., salinity, temperature and nutrient levels of the water bodies) have important influences over species diversity and genetic differentiation in zooplankton (Campillo et al., 2011; Lowe et al., 2007; Xiang et al., 2017). Salinity has been shown to increase rates of molecular evolution, promoting local adaptation, genetic divergence and cryptic speciation in some zooplankton species (Alcántara-Rodríguez et al., 2012; Derry et al., 2003). For example, some sibling species within the Brachionus plicatilis species complex possess different salinity and temperature preferences (Ciros-Pérez et al., 2001; Derry et al., 2003). Brachionus plicatilis s.s is found at low to high salinities (3 to 45 g L-1) and low temperatures (< 25 °C). Brachionus ibericus is found at medium to high salinities (8 to 50 g L-1) and high temperatures (> 15 °C). Brachionus rotundiformis occurs in waters with medium to high salinities (10 to 57 g L-1) and high temperatures (10 to 30 °C). Whereas an undescribed Brachionus species from Mexico was reported as the first member of the B. plicatilis complex adapted to live in freshwater conditions (1.1 g L-1) (Alcántara-Rodríguez et al., 2012). In the case of L. bulla, this species has been reported living at salinities of 2,000 and 3,000 µS cm-1 in Tío Julio and Poza Tortugas (Cuatro Ciénegas, CHD) respectively (Walsh et al., 2008) (Table 1). The presence of L. bulla has also been reported in coastal brackish lagoons such as Mecoacan (5-35‰) and La Tobara located in Tabasco and Nayarit, respectively (Sarma & Elías-Gutiérrez, 1997; Sarma et al., 2000). These water chemistry differences could explain the pattern of genetic differentiation in L. bulla. However, more environmental and adaptive studies must be conducted in order to understand the process of genetic differentiation in this species, since mechanisms responsible for genetic differentiation in zooplankton are highly complex. Persistent founder effects since colonization events (sometimes from long distances), in combination with stochastic events and local environmental adaptations providing competitive superiority of resident genotypes over immigrant genotypes (impeding gene flow), also promote the genetic divergence observed in rotifer populations and other zooplankters, all this is known as the monopolization hypothesis (De Meester et al., 2002; Xiang et al., 2011). Nevertheless, secondary contact, even introduction of lineages by human activities are also factors that may explain the genetic differentiation observed in the L. bulla populations examined in this study (Campillo et al., 2011).
As L. bulla is distributed worldwide, it is likely that more cryptic species will be found as more sequences of L. bulla from other parts of the world are studied, as has been the case of the Brachionus plicatilis complex (Gómez et al., 2002; Malekzadeh et al., 2014; Mills et al., 2017). Interestingly, in the present study we found 13 putative species, however these species were found in just some parts of Mexico and the Southern USA, which is a small region, compared to B. plicatilis complex where all the sequenced individuals were collected worldwide (Mills et al., 2017). Also, as suggested by Walsh et al. (2009) as more populations are sequenced, the extent of genetic differentiation of L. bulla will be better elucidated. At this time our results represent only a fragment of the hidden diversity in L. bulla.

