


 text new page (beta)
 English (pdf)
 Article in xml format
 Article references
 Send this article by e-mail
 Cited by SciELO
  Similars in
SciELO
Similars in
SciELO 
 Permalink
Introduction
Nowadays, one of the greatest problems facing humanity is the pollution by hydrocarbons, which cause damage to living beings by disrupting the balance of ecosystems [1]. There is need not only of continuous monitoring but also technological alternatives to remove it from the environment. The molecules benzene and naphthalene are two of the aromatic hydrocarbons that can be found in gasoline, when spills or leaks occur they strongly adhere to soil and sediment particles or plants affecting humans when exposed in large quantities or long periods of time. Remediation of hydrocarbon-contaminated ecosystems in the southeast of Mexico is a priority for the Mexican oil industry. Some methods use biopilage, which is a controlled biological process, where organic pollutants are biodegraded and mineralized, this consists of forming piles with contaminated soil and stimulating microbial activity, aerating or adding nutrients and moisture [2,3], the problem with this method is the high cost of implementation and maintenance. Other common method for the degradation of hydrocarbons is the use of UV light and combination of UV/H2O2 as oxidants, the results show moderate efficacy in the treatment of oxidative degradation [4,5]; in the same way using advanced oxidation process the ozone assisted catalytic oxidation has been investigated, this process has removed the hydrocarbon over 420 minutes [6]. Nowadays, the photocatalysis is forming part of the new clean technologies which can be used in the photodegradation of existing pollutants in wastewater, soils and gas, avoiding the harmful effects of pollution on ecosystems [5-6]. Several carbon derivate structures as activated carbon, carbon nanotube, graphene and graphene oxide has been investigated for the removal of pollutants [7], it has demonstrated its capability as adsorbent of different compounds as metallic ions, dyes drugs and herbicides showing a good performance. Other combinations as graphene oxide (GO) ZnO/(FeO-SiO )/rGO called hybrid photocatalyst has demonstrated good photocatalytic reaction in the oxidative degradation of methylene blue [8,9], with this GO make it an ideal candidate for environmental applications. Previously, we have demonstrated the use of bismuth and its derivatives in photocatalytic applications using visible light, this makes it desirable for the photocatalytic process [10]. The aim of this research, it was to investigate the use of graphene oxide and the graphene oxide modified by bismuth oxide for the removal of benzene and naphthalene hydrocarbons, exploring the synergy between the adsorption process on graphene oxide and the photodegradation effect with bismuth oxide using visible irradiation in aqueous media.
Experimental
Materials
The precursor for the synthesis of GO were graphite powder (Sigma Aldrich <20μm synthetic), potassium permanganate (Sigma Aldrich), hydrogen peroxide (Meyer ACS 29-32 %), sulfuric acid (Meyer 96 %). To obtain bismuth oxide were used bismuth nitrate pentahydrate (Sigma Aldrich 98 %) and ethylene glycol (99 %). The standard solutions of hydrocarbons were benzene (Sigma Aldrich >99.9 %, water solubility 1.88 g/L at 23.5 °C) and naphthalene (Sigma Aldrich 99 %, water solubility 0.0308 g/L at 25 °C).
The graphene oxide was obtained by the modified Hummers method [11,12], in a round flask 3 g of graphite powder was dissolved in 34.5 mL of 10% sulfuric acid. Later it was added 4.5 g of potassium permanganate adjusting the temperature to 35 °C under constant stirring at 1000 rpm for 2 hours. In the next step it was added 69 mL of distilled water drop by drop, increasing the temperature to 84 °C. The synthesis route continues adding 10 mL of H2O2 (30 %) the solution was kept in reaction for 30 more minutes, finally the resulting material was rinsed with water and centrifuged at 1500 rpm for 3 min.
Bismuth oxide synthesis
For the first step, it was dissolved 7.3 g of bismuth nitrate pentahydrate in 80 mL of ethylene glycol, the solution was stirred at 700 rpm for 80 minutes. In the second step the solution was transferred in a Teflon-coated autoclave for 12 hours at a temperature of 180 °C. In the last step, the precipitates were collected by centrifugation and washed three times with distilled water. Finally, the resulting material was dried at 60 °C for a period of 12 h in a vacuum oven.
Bismuth oxide/graphene oxide synthesis
The graphene oxide previously obtained in the section 2.2 by the modified Hummers method was exfoliated and dispersed for 2 h by the ultrasonic method [13,14], latter the GO dispersion was centrifuged for 30 minutes at 6000 rpm to remove the unexfoliated graphene oxide. To this aqueous dispersion of GO (25 mg in 25 mL), approximately 3 g of bismuth nitrate pentahydrate were added and stirred for 30 min, subsequently it was placed in a Teflon-coated autoclave for 12 hours at 180 °C. The resulting material was washed once with water and ethanol and then dried in an oven at 60 °C for 24 hours. The content of Bi2O3 and GO was varied to evaluate the adsorbent and the photoactive material; the variations in weight percent were as follows: Bi2O3 10 %/GO 90 % (labeled as BIOGO A), Bi2O3 50 %/GO 50 % (BIOGO B), Bi2O3 90 %/GO 10 % (BIOGO C).
Characterization of materials
For the characterization of the materials a D8 advance diffractometer was used for powder samples applying Cu-kα radiation (λ=0.15406 nm) with a voltage of 40 kV and a current of 25 mA, to produce the X-ray emission; for the medium-infrared a spectrometer Nicolet IS50 Thermo Scientific in a range of 4000 to 500 cm¹ with a ATR module (with a diamond tip) was used. A TESCAN model VEGA 3 scanning electron microscope (SEM) was used it was operated in high vacuum (9x10⁻³ Pa) and measuring voltage of 20 keV; a Xplore Plus Raman spectrometer, Horiba Science, with an excitation laser of 532 nm in a measurement range of 100 cm-1 to 3200 cm-1; and for UV-Vis spectroscopy was used a Shimadzu UV 2600 spectrometer that can measure from 800 to 185 nm, at a scanning speed of 240 nm and with a resolution of 0.5 nm.
Adsorption and photocatalytic evaluation
A homemade photoreactor was employed for the tests (Fig. 1), a sealed cylindrical glass reactor of 80 mL of capacity. A 70 mL of aqueous solution of benzene (75 mg/L) or naphthalene (61 mg/L) were employed, the photoreactor had a cooling system to maintain (20 °C) the vapor-liquid equilibrium of the solution, the as prepared solutions were saturated previously with oxygen. The catalyst mass was 35 mg for each probe and stirred continuously in the solution at 700 rpm. For the adsorption-desorption equilibrium of the corresponding molecules in the solution, the suspension was stirred in the dark. An OSRAM Ultra-vitalux lamp (300 W) was subsequently turned on to simulate sunlight, the intensity of the visible light lamp was 90 W/m2, the lamp was placed 15 cm from reactor. The samples were taken every 30 minutes, each sample was filtered through a nylon membrane (0.45 (m, Millipore) to remove the solid particles before analysis. The analytical procedure to analyze the concentration of both molecules was using the UV-Vis spectroscopy from 400 to 185 nm following the characteristic peak at 252 nm for benzene and 274 nm for naphthalene, previous calibration curves. For the adsorption, the UV-Vis spectrum was related with the benzene and naphthalene concentrations by the Beer-Lambert law; the final quantity of both molecules adsorbed (Q) by mass of the material at the equilibrium time (final time) was estimated by:
Where Q is the quantity of the adsorbed molecule at the final time t by mass of the material, Co is the initial concentration of benzene or naphthalene (mg/L), C is the concentration at the final time (mg/L) and m is the concentration of the respective materials (g/L).

Results and Discussion
X-ray diffraction
First it was analyzed the precursor of graphene oxide, graphite, to identify and compare with graphene oxide, in Fig. 2(a) it shows the graphite diffractogram showing a sharp peak at 2θ= 26.4° (JCPDS 00-012-0212) corresponding to plane 002, this signal indicates the presence of carbon materials that have a hexagonal structure [11].
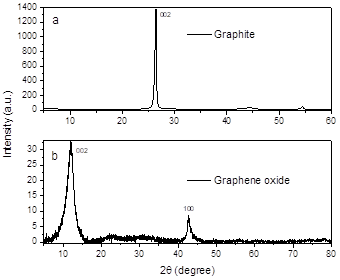
In the GO diffractograms in Fig. 2(b), the signal of plane 002 is displaced at a lower angle 2θ=12° (JCPDS 75-2078) [12, 15], which has a crystallite size of 20.48 nm, while graphite has a crystallite size of 63.46 nm. This change presented in the GO is attributed to the introduction of functional groups -OH and -C-C in layer during the synthesis process [16,17].
In Fig. 3, according to the procedure synthesis, corresponds to bismuth oxide in its monoclinic alpha phase (α- BiO3) according to the JCPDS (01-071-0465) [18,19], which has its characteristic peaks in 27°, 37°, 39°, 48°, 67° and 70°, non-additional peaks were found. The crystallite size was 64.63 nm.

To analyze the interaction among the graphene oxide layers with bismuth oxide the diffractograms were evaluated in different contents. A parameter is the number of layes (n), it can be calculated from the Debye-Scherrer and Bragg, the expression for the measurements is:
In Fig. 4 it is clearly distinguished that the α-BiO3 phase was prevalent to graphene oxide in the samples BiOGO B (50/50) with a number of layers of 246 and BiOGO C (90/10) with 240 layers; for the material BiOGO A (10/90) a small shoulder around 25° emerge, possibly because the number of layers is lower, 196, due to the amount of graphene oxide on it. About the crystallite size, it was measured on the major diffraction peak of Bi2O3 with values of 65, 81 and 79 nm for BiOGO A, BiOGO B and BiOGO C respectively; with a small crystallite size increases its content in-between layer decreasing its number as commented previously.

Fourier transform infrared spectroscopy using ATR
The GO spectrum in Fig. 5(a) represents the characteristic functional groups associated to the C-O-C vibration of epoxy groups at 1040 cm-1, the signals at 3000 cm-1 and 1400 cm-1 are due to the stretching and bending vibration of the O-H bond. The bands in the 1585 cm-1 and 1215 cm-1 are referred to the stretching of bonds C=C and C-OH, respectively [20,21]. For reference, graphite had a signal around 2100 cm-1 which belongs to the triple bonds of carbon (C(C), this bond of atoms forms a highly strong layer, this representing signal is not present in the GO [12].
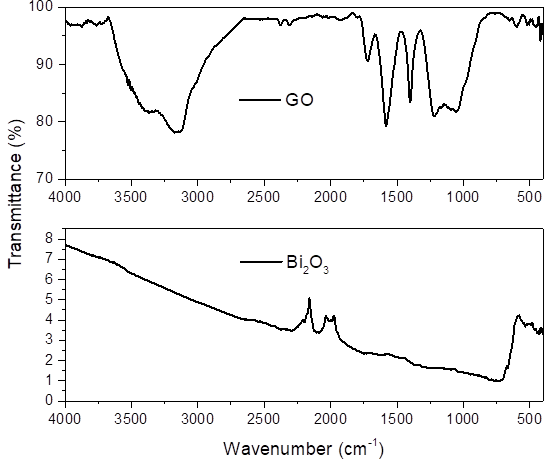
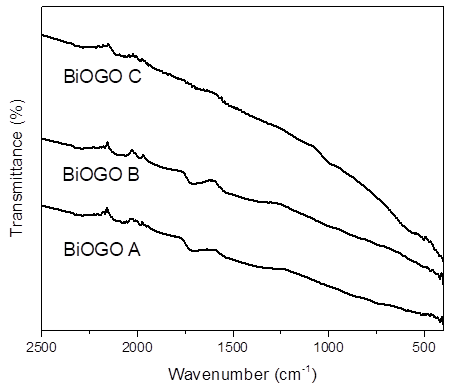
The spectra shown in Fig. 5(b) correspond to bismuth oxide (Bi2O3). The bismuth oxide has a single signal at 2105 cm-1 corresponding to the nitrile group (C(N), this indicates that not all nitrates were removed during the synthesis process [19]. The small vibration around 2000 cm-1 can be assigned to C=N+=N-. Similarly, in Fig. 6, it was observed that in the composites of BiOGO A, B and C have a second signal in the 1719 cm-1 that belongs to carboxyls which gives a reference of the presence of graphene oxide in bismuth oxide structure; in the BiOGO C the aforementioned signal it´s smaller due to the small amount of graphene oxide in the material.
Scanning and field emission electron microscopy
To know the morphology of the materials these were analyzed by SEM and FESEM, Fig. 7. As can be seen in Fig. 7(a) and 7(b) (SEM), packed dense two-dimensional leaves of GO and folded regions can be seen [13,22,24].

In Fig. 7(c) (FE-SEM), graphene oxide (GO) was analyzed at higher magnification. The accumulated and wrinkled graphene oxide layers can be seen; these stacked layers are attributed to the presence of functional groups between them, as confirmed by FTIR studies. The FE-SEM analysis in Fig. 7(d) shows the uniform size and shape only of the bismuth oxide for the lowest content of GO (BiOGO C), by the synthesis procedure (ultrasonication-hydrothermal) this material is dispersed over the graphene oxide flakes. The development of spherical particles is attributed to the synthesis process by the hydrothermal method, at first the nanoparticles of bismuth oxide were formed in the solution with ethylene glycol, when subjected to pressure and temperature conditions favors the solubility of the materials that are being formed inside the container, which were becoming nanospheres [13, 25]. The size of the irregular spheroidal particles is between 80 nm and 500 nm; in all cases, the particles are clumped together.
Raman spectroscopy
To analyze additional information about the structural properties, Raman spectroscopy was performed. From the results, the G-band is related to the presence of graphite structures with sp2 domain abundance; and the D-band is associated with the degree of distortion or structural disorder of the material.
The Fig. 8(a) corresponds to the GO spectrum where we have a D-band displaced at 1338 cm-1 which is due to the presence of disorder in hybridized sp² carbon systems and the formation of defects in graphene layers due to the process of oxidation of graphene. The G-band in 1583 cm-1 is derived from the stretching of the domain carbon bonds with sp² and is highly sensitive to the stress effects on the system sp² within the graphene sheets [26-28]. The intensity in the D-band can be attributed to the presence of functional groups in the structure of GO leaves. The 2D band in the GO shows us a structural disorder, that is the separation of layers of graphite and the introduction of functional groups.

The Fig. 8(b) shows a spectrum of bismuth oxide it has well-defined signals in 69, 93 and 481 cm-1 which the first two correspond to bismuth and the last two are of bismuth oxide in its alpha phase as reported [29].
In Fig. 9 are shown the spectra of bismuth oxide and graphene oxide materials; in the Fig. 9(a) the signals of graphene oxide are clearly dominant over the Bi2O3 materials for both BiOGO A and BiOGO B, it includes the band D which indicate the formation of defects in the layers of GO due to the inclusion of bismuth oxide which has almost imperceptible signals, this attributed to its quantity [29,30].

Fig. 9 (a) Raman spectrum of bismuth oxide (10 %) with graphene oxide (90 %) (BiOGO A), bismuth oxide (50%) with graphene oxide (50 %) (BiOGO B) and (b) bismuth oxide (90%) with graphene oxide (10%) (BiOGO C).
In Fig. 9(b), the Raman spectrum of the BiOGO C has clear signals at 88, 121 and 308 cm-1 corresponding to bismuth oxide in its alpha-phase. The small and wide shoulder in the 608 cm-1 indicates the presence of small traces of bismuth oxide in its delta-phase, according to the literature, this sample does not show signals of graphene oxide; this is due to its signal intensity being overpassed by the 308 cm-1 of Bi2O3 [30].
The carbon disorder was calculated by the ratio of D-band and G-band intensities (ID/IG), it was measured for GO, BiOGO A and BiOGO B, for comparison it was included the precursor graphite [27,28]. The results indicate, for graphite, a value of 0.13 which means a low level of structural defects, which is expected as it is a raw material. The GO has an ID/IG = 0.98 which is much higher due to the presence of functional groups and structural changes resulting from the oxidation process. For the BiOGO A and B compounds, an ID/IG = 1.07 and 1.04 are present, respectively, which are slightly higher due to the introduction of bismuth oxide, which is present in these materials [26,28].
Ultraviolet-Visible Diffuse Reflectance Spectroscopy
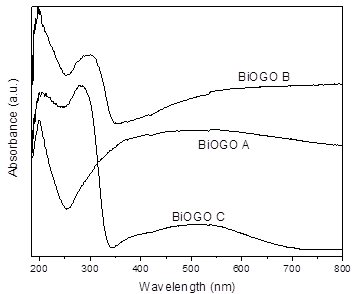
The UV-Vis absorbance spectra provide useful information on the electronic behavior as well as the GO dispersion property. A maximum absorbance of GO (sp2 conjugate carbons) around 210 nm depends on the degree of conjugation of GO (Fig. 10), which is dominated by the π-π* transition, also an n-π* transition of the C=O bonds is present [31,32].

In the same figure, it is possible to observe a considerable absorption of α-Bi2O3 in the UV region (340 nm) as reported previously [13,25]. For the composites in Fig. 11, the BiOGO A exhibits a GO signal around 200 nm, due to the small percentage of bismuth oxide only a broad shoulder was observed to increase its absorbance above 400 nm; over 500 nm, the predominant signal was attributed to the electronic transitions of GO. In contrast, BiOGO B and C showed absorption signals around 210 nm corresponding to the GO but with a strong absorption (300 nm) associated with Bi2O3.
The energy band gap of the materials was measured using the modified Kulbeka-Munk equation considering indirect allowed transitions (Fig. 12), the obtained results indicate that the BiOGO materials do not exhibit a considerable shift to higher wavelengths being the BiOGO B (2.17 eV) material with most promising material to work on visible light, the results of the energy band gap for the BiOGO A and BiOGO C were 2.41 and 3.14 eV respectively, whereas the GO and pure Bi2O3 were 1.59 and 2.35 eV, respectively.

Photocatalytic testing
The tests were evaluated using graphene oxide and bismuth oxide in various molar ratios as described in methodology. The starter concentrations for the photolysis, adsorption and photodegradation probes for naphthalene and benzene were 61 and 75 ppm, respectively. The photolysis test was evaluated to stablish the direct interaction of compound with light, the results indicate a maximum decomposition of 9% after 60 minutes of reaction for naphthalene and 19 % of benzene in the same period of time. The materials synergy for the removal of the pollutants is the sum of the results of the adsorption and photodegradation of naphthalene and benzene. About the adsorption tests, the maximum equilibrium time between adsorption and desorption was 60 minutes. The Fig. 13 shows the adsorption results of naphthalene with the materials graphene oxide (GO), bismuth oxide (Bi2O3) and BiOGO. As can be seen, the material that adsorbs the most was BiOGO C with 35 ppm, the quantity of naphthalene adsorbed was equivalent to 70.4 mg/g, this material has the highest bismuth oxide content (90 %); compared to the pure GO and Bi2O3 materials they adsorbed approximately 25 ppm, about 49 mg/g of naphthalene adsorbed. By having a low percentage of GO sheets dispersed on the hemispherical surface of Bi2O3, it increases the number of possible sites for the adsorption process.

The Table 1 shows the adsorption and photodegradation results, as well as the total decrease in concentration and the percentage of total elimination.
Table 1 Removal of naphthalene in aqueous media.
| Material | Adsorption (ppm) | Q* (mg naphthalene/g material) | Photodegradation (ppm) | Final concentration (ppm) | Naphthalene removal (%) |
|---|---|---|---|---|---|
| BiOGO A | 26.1 | 52.2 | 5.6 | 31.71 | 52 |
| BiOGO B | 33.6 | 67.2 | 1.9 | 35.51 | 58 |
| BiOGO C | 35.8 | 70.4 | 8.7 | 44.47 | 73 |
| Bi2O3 | 24.6 | 49.2 | 7.9 | 32.53 | 53 |
| GO | 24.6 | 49.2 | 1.4 | 26 | 43 |
*after 60 minutes
From the table it can be seen that the highest elimination of naphthalene was approximately 73% for the BiOGO C material, previously it has been reported that pure bismuth oxide presents photocatalytic activity under UV irradiation, in the tests it managed to eliminate approximately 50 % of naphthalene present, being the adsorption process dominant. It is worth to mention that the photocatalytic degradation processes are on the surface, although the percentage of photodegradation is lower than that of adsorption, the adsorbed naphthalene is the first exposed to the generated radicals, this is the importance of considering the total removal to understand the synergy between the adsorption and the photodegradation of the test molecule.
Similarly, for benzene, the adsorption tests were first carried out (Fig. 14), in this case the maximum equilibrium time between adsorption and desorption was 90 minutes. The benzene molecule was adsorbed to a greater extent with the BiOGO B material which has a 50/50 weight percent composition of bismuth oxide and graphene oxide, with a value of about 36 ppm, the quantity of benzene adsorbed was equivalent to 73.4 mg/g. As with naphthalene, benzene has the lowest adsorption on GO plates (13 ppm approx.). As it has a less porous arrangement in its structure, as consequence it has less adsorption site available.

Regarding the photodegradation, the reaction time under irradiation was 120 minutes, because the benzene molecule is more stable, the total time of the elimination reaction was 210 minutes. From the results, the material with the highest activity is GO degrading 12 ppm, however, the difference with the composite materials of bismuth oxide and graphene oxide is not significant since the BiOGO A material photodegraded 10 ppm of benzene, such as can be seen in Fig. 14. Particularly in this case, the pure bismuth oxide material is the one that presents a lower photodegradation under visible irradiation since, as mentioned, benzene is a strongly stabilized molecule (higher resonance energy).
In Table 2, the data of the adsorption and photodegradation reaction of benzene were compiled to estimate the maximum percentage of benzene elimination, as can be seen, the BiOGO B and C materials eliminate 57.36 and 52.79 percent respectively of the test molecule.
Table 2 Removal of benzene in aqueous media.
| Material | Adsorption (ppm) | Q* (mg benzene/g material) | Photodegradation (ppm) | Final concentration (ppm) | Benzene removal (%) |
|---|---|---|---|---|---|
| BiOGO A | 22.66 | 46.02 | 10.23 | 32.89 | 43.41 |
| BiOGO B | 36.22 | 73.4 | 7.42 | 43.64 | 57.36 |
| BiOGO C | 30.92 | 63.52 | 8.1 | 40 | 52.79 |
| Bi2O3 | 20.46 | 41.76 | 3.3 | 23.76 | 31.36 |
| GO | 12.2 | 27.52 | 12.88 | 25.76 | 34 |
*after 90 minutes
Finally, in comparison with some adsorption works, for polycyclic aromatics, good results were achieved, some authors have even reported these processes in periods of days, achieving values close to those obtained here (35 % elimination in 5 days).
It is important to note that although the photodegradation results for both naphthalene and benzene are not so impressive, it is because the reactions proceeded only under irradiation in the visible spectrum, a higher yield has been reported under UV-C light of high energy, however, the purpose of this research was to demonstrate the use of the adsorption assisted with the advanced oxidation process as an alternative to remove hydrocarbons from media.
Conclusion
The materials were synthesized successfully from the Hummers (GO) and hydrothermal methods (Bi2O3), the XRD indicates the obtaining of the alpha phase of bismuth oxide which has been reported as an active material in visible irradiation. The composite materials BiOGO do not suffer significant changes, the interaction with GO layer has minor influence in the formation of the materials. The layers separation on GO was confirmed by FTIR by the presence of different functional groups, this confirms the number of layers measured by XRD. It was clear seen in the micrographs the layers aforementioned, also the formation of spherical materials of Bi2O3, this morphology increases the adsorption sites useful to adsorb the pollutants as demonstrated by the adsorption test. The final confirmation of the materials was achieved with Raman spectroscopy, the defects found the evolution of precursor graphite to graphene oxide. From the structural phase results, it was derived the energy band gap of the materials, this section indicates no major modifications in the energy band gap, it was reflected in the low values of photodegradation. Nevertheless, the synergy, the removal of naphthalene and benzene demonstrated its utility in the recovery of the environment contaminated by these hydrocarbons using adsorption and photodegradation process.

