


 text new page (beta)
 English (pdf)
 Article in xml format
 Article references
 Send this article by e-mail
 Cited by SciELO
  Similars in
SciELO
Similars in
SciELO 
 Permalink
Introduction
Heavy metal ions and microbe’s persistence in the environment is responsible for the deterioration of the quality of ecological system. Separation of metals from multifaceted solutions containing trace amount of metals is achieved by MRT‐SPE technique (Molecular recognition technology solid phase extraction) [1]. Essential and non-essential (but harmful) metals may exist in industrial effluent, body fluid, residue of radioactive material and metallurgical extract. The metal to be targeted may have interference by the other highly active potential ions which demands selective identification and isolation techniques. Unadventurous methods like sedimentation, inductively coupled plasma mass spectrometry and inductively coupled plasma atomic emission spectrometry required skilled technical operator and also they are time consuming. Accurate analysis requires selective and sensitive materials capable of giving changes in absorption or emission spectra, redox potential and other physical properties like resistance [2,3]. Chemosensor are employed in various field including analytical, environmental, catalysis, industrial and medical sciences [4] as they meet the above requirement due to the accompaniment of high detection limit, selectivity, and specificity [5].
Medicines comprise of mercury are of skin ointment, laxative, antiseptic, and dental amalgams. Insertion of Hg2+ ions in the body foils the function of neurological system, brain, and kidney [6]. Copper, an essential metal, regulates energy production in cells, mechanism of oxygen transfer and transduction of signals in biological functions of body system [7]. Surplus intake of copper leads to acute nausea, multiple organ failure, hike in blood pressure miscarriages and Alzheimer’s diseases [8]. Plants and some microorganisms (algae, archaea, bacteria & primitive eukaryotes) contain nickel existing enzymes [9]. Existence of enzymes with nickel in higher organisms is not reported. Oral ingestion of nickel by human induces pathophysiological changes and causes genotoxicity, oxidative stress, lung fibrosis, cardiovascular diseases, immunotoxicity and cancer on the respiratory tract in living systems [10,11]. Sulphur containing enzymes having Ca2+ & Zn2+ ions are affected much by the category I carcinogens cadmium compounds. Accumulation of Cd2+ ions in biological system damages kidney, introduce cardiovascular disease and cancer [12]. Conservation of blood sugar, vitamin level, protection of immune and nerve cell functions are maintained by the manganese containing enzymes [13]. However, exposure to aerosols of Mnn+ or excess consumption of Mn2+ & Mn3+ containing component induces toxicity and affects brain, liver & cardio systems [14]. Non-biodegradable nature of lead makes it dangerous to human and living organisms [15]. Toxicity of lead includes kidney failure, neurotoxic effects including attainment of adolescence in children, shortfall of productivity and carcinogenic effect [16,17].
Embedded stability, aromatic nature, little toxicity and redox behavior of ferrocene-based complexes made them a gorgeous pharmacophore for drug design [18]. Coordination of ligated metal with ferrocene and its derivatives under different reaction conditions yielded complexes with fascinating redox processes and showing different measurable physical parameters like fluorescence. Further above type of complexes were found to have mixed properties of coordination complexes and organometallics [19]. Complexes derived with life essential metals like Co, Cu, Zn, Mn and Ni also showed antimicrobial activities when they are associated with heterocyclic molecules incorporated with N, O and S. It is reported that Schiff bases with benzimidazole moiety are sensitive to microbial agents and human pathogens [20].
Coordinating ability and biological activities of Schiff base ligands rest on the electron donating nature [21] of nitrogen atom (sp2 hybridized) present in the imine groups. Present work discuss the synthesis of multi metal ion sensing, unsymmetrical, tetra dentate, Schiff base ligands N'1-((E)-4-(Nitro)benzylidene)-N'4-((E)-2-(ferrocenylidene)succinohydrazide and N'1-((E)-4-(Dimethylamino)benzylidene)-N'4-((E)-2-(ferrocenylidene)succinohydrazide along with their antimicrobial activity.
Experimental
Materials
Ferrocenecarboxaldehyde, P-dimethyl aminobenzaldehyde, 4-nitrobenzaldehyde, succinic anhydride, silica gel and hydrazinehydrate used in the synthesis of Schiff bases were purchased from E. Merck industry and are of analytical grade and used without purification. Chemicals like CuCl2, HgCl2, Pb(OAc)2, MnCl2 , NiCl2 and Cd(OAc)2 utilized in CV and electronic spectral titration studies were of analytical grade and were obtained from Sigma-Aldrich. Acetonitrile (HPLC grade) got from E- Merck and absolute ethanol (spectral grade) acquired from Commercial Alcohols, Canada was employed for spectral studies. Supporting electrolyte tetrabutylammoniumperchlorate (99+% pure) was purchased from Chemical Center, Mumbai and employed without purification (with care).
Instruments
Mass spectrometer of model esquire 3000 obtained from Bruker Daltonics was employed to observe the mass spectra. For recording FTIR spectra with KBr pellets, in the range of 400-4000 cm-1, Perkin-Elmer 337 spectrometer was utilized. Electronic spectral studies (in the range 200 to 800 nm) were carried out in SHIMADZU MODEL UV-1800 240V spectrophotometer. BRUKER AVANCE spectrometer operating at 500 MHz was tied up to register 1H NMR spectra in C2D5OD solvent. Electrochemical analyses were done on CHI electrochemical analyzer 1200B model comprised of Ag/AgCl as reference electrode, glassy carbon as working electrode and platinum as counter electrode. Tetrabutylammonium perchlorate (0.1M) was used as supporting electrolyte under precautions in nitrogen atmosphere for CV studies. Responses to applied potential were recorded in acetonitrile medium (for CuCl2, NiCl2 and HgCl2) and in ethanol medium (for Pb(OAc)2, MnCl2 and Cd(OAc)2). Herarus C-H-N rapid analyzer was exploited to analyze the C, H and N contents of the receptors.
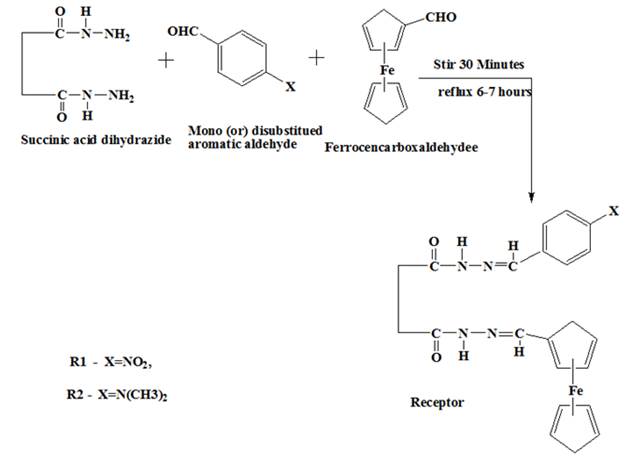
Synthesis of N'1-((E)-4-(nitro)benzylidene)-N'4-((E)-2-(ferrocenylidene)succinohydrazide [R1]
The precursor compound succinic acid dihydrazide was prepared by modifying the procedure reported in the literature [22]. To prepare succinic acid dihydrazide, solution containing 0.12 moles hydrazine hydrate in 150 ml of ethanol was added in drops along with stirring to a solution containing 0.05 moles of succinic anhydride in 50 mL of ethanol. The mixture was refluxed for 24 h. Precipitated product was dried and recrystallized from ethanol. Receptor compound was primed by adding a mixture containing 0.01 mole 4-nitrobenzaldehyde and 0.01mole of ferrocenecarboxaldehyde in 150 ml of ethanol to a solution having 0.01 mole of purified succinic acid dihydrazide in 50 ml of ethanol (scheme -1). Above mixture was stirred for half an hour and then refluxed for 6-7 h. Thin layer chromatographic technique was adopted to check the progress of the reaction at various time intervals. The reaction mixture was filtered after cooling and concentrated to get reddish yellow coloured N'1-((E)-4-(nitro)benzylidene)-N'4-((E)-2-(ferrocenylidene)succinohydrazide. Silica gel column was used to purify the crude sample by engaging ethanol as eluent. Colour: Dark reddish orange. Yield: 0.5939g (75%), m.p. 180 oC.
Synthesis of N'1-((E)-4-(Dimethylamino)benzylidene)-N'4-((E)-2-(ferrocenylidene)succino hydrazide [R2]
Concoction containing 0.01 mole of ferrocenecarboxaldehyde and 0.01 mole of P-dimethyl amino benzaldehyde in 150 mL ethanol was added with stirring (half an hour) to a solution of 0.01 mole of succinic acid dihydrazide in 50 mL of ethanol (scheme -1). Above mixture was refluxed for 6-7 h. The progress of the reaction was checked by thin layer chromatographic technique at various time intervals. Cooled reaction mixture was filtered and concentrated. Red colored crude sample obtained was purified in a silica gel column using ethanol as eluent. Yield: 0.5805 g, (77 %), Color: reddish orange, m.p. 181 ℃.
Inhibition measurement against microorganisms (In vitro)
Adopting the procedure reported in the literature [23], experiments were carried out in triplicate against four bacteria and two fungi at appropriate temperature. Average values obtained from above experiments were considered for analysis. Each bacterial isolate was suspended in Brain Heart Infusion (BHI) broth and diluted to approximately 105 colony forming unit (CFU) per mL. They were flood-inoculated onto the surface of media (Mueller Hinton Agar for Bacteria and Sabouraud’s Dextrose agar for fungi) and then dried. Five-millimeter diameter wells were cut from the agar using a sterile cork-borer and 30 µL (50µg compound in 500 µL DMSO) of the sample solution were poured into the wells. The plates were incubated for 18 h at 37 ºC for bacteria. Similarly fungal plates were incubated at room temperature (R.T) for 48 h.
Molecular docking method to estimate binding energy
The binding mode of synthesized compounds R1 and R2 with targeted proteins of the microorganisms were carried out using Auto dock version 4.2.6[24] running on windows 7. Targeted proteins were extracted from Research Collaboratory for Structural Bioinformatics (www.RCSB.org). Docking score values were calculated by employing molecular graphics laboratory (MGL) tools of Auto dock. Structures of R1 and R2 drawn using ChemSketch were converted to 3D structure with the help of 3D optimization tool.
Molecular Mechanics Force Field 94 (MMFF94) was used for geometrical optimization of ligands using ligand module. DFT - Quantum mechanics Geometry optimization using density functional theory (DFT) is done by moving the atoms of a molecule to get the most stable structure with the lowest possible ground state energy and therefore it is used for precise description of geometrical optimization. MMFF94 - Molecular mechanics ligands are considered to be fully flexible and some of the protein atoms are movable. The force field determines the energy of the protein-ligand complex for its every conformation. In this connect, DFT calculations are not carried out. The affinity of particular amino acid residue present in the selected protein with the synthesized ligands was done and the H-bond interaction & binding energy (Kcal/mole) were calculated.
Results and Discussion
Characterization by Elemental and Mass Spectral Studies
The data arrived in elemental analysis matches very well with the theoretically calculated one: R1- C22H21N5O4Fe (Found %): C, 55.65; H, 4.39; N, 14.70; Fe, 11.41; (Cal. %): C, 55. 60; H, 4.43; N, 14.76; Fe, 11.45). R2- C24 H27N5O2Fe (Found %): C, 61.10; H, 5.68; N, 14.79; O, 6.71. (Cal. %): C, 61.15; H, 5.72; N, 14.83; O, 6.77.
Advent of molecular peak (ESI) m/z at 474 and 472 for N'1-((E)-4-(Nitro)benzylidene)-N'4-((E)-2-(ferrocenylidene)succinohydrazide and N'1-((E)-4-(Dimethylamino)benzylidene)-N'4-((E)-2-(ferrocenylidene)succinohydrazide respectively on mass spectral analysis confirm the formation of expected receptors.
FTIR Spectral analysis
Peaks observed for R1 around 475 cm-1 and 818 cm-1 are assigned for tilt stretching vibration of ferrocene cyclopentadienyl ring and C-H out of plane bend vibration respectively. Cyclopentadienyl ring -C-C-H bending vibrations appeared between 937 cm-1 to 1210 cm-1 [25]. The peak at 1393 cm-1 is allocated for symmetric stretching vibrations of -NO2; 1515 cm-1 is allotted for -CH=N (imine) stretching vibration; 1667 cm-1 is dispensed for amide -C=O stretching vibration [26]. Peaks responsible for stretching vibration of secondary amine and water of hydration are seemed near 3080 cm-1 and 3200 cm-1 correspondingly (Fig. 1). For compound R2 in addition to the above-mentioned peaks, the stretching vibrational modes in CH3 groups are observed at 2932 cm-1 [27].

NMR Spectral analysis
The 1H NMR spectra of the synthesized sensors were recorded after dissolving them in C2D5OD solvent using 500 MHz frequency spectrometer. The peaks bestowed in the proton NMR spectrum of R1 are assigned accordingly δ,(ppm); 8.1(s, 2H, NCH), 7.3 (m, 4H, aromatic), 4.5 (m, 2H, cp subst), 4.3(m, 2H, cp subst), 4.1 (s,5H, cp unsubst), 2.8 (2s, 4H, 2CH2), 1.4(s, 2H, 2NH) (Fig. 2(a)). For R2 (Fig. 2(b)) assignments are δ, (ppm); 8.4(s, 2H, NCH), 7.5 (m, 4H, aromatic), 4.3 (m, 2H, cp subst), 4.5(m, 2H, cp subst), 4.2 (s, 5H, cp unsubst), 2.7 (2s, 4H, 2CH2), 1.5(s, 2H, 2NH), 3.3 (2s, 6H-2CH3).

Assessment of detecting ability of sensors
UV-Visible titration method was utilized to assess the ability of newly synthesized sensor materials to detect several metal ions. Receptor solution of 1X10⁻⁵ M concentration (2.5 mL) was taken in the quartz cell. Twenty μL of 1X 10⁻² M metal salt solutions were added up to seven additions and the spectral changes were recorded. The difference in solubility of metal salts split titration studies into two parts. Ethanol medium was engaged for salts of Mn, Pb and Cd. For Cu, Ni and Hg salts acetonitrile medium was employed.
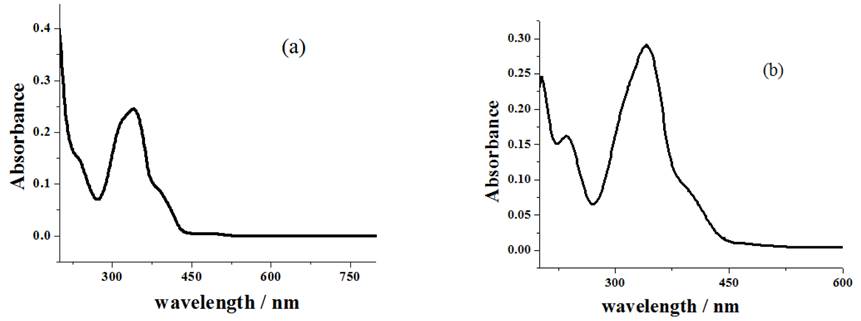
Two shoulders near 241 nm & 322 nm and a broad peak around 297 nm (Fig. 3(a)) were noticed for R1 in acetonitrile medium. Likewise two shoulders close to 233 nm & 420 nm and a wider peak at 306 nm were perceived (Fig. 3(b)) for R1 in alcohol. UV- province peak and shoulders are earmarked for aromatic ring π-π* transition [28]. The visible region peak is assigned for d-d transition [29].

Successive addition of Cu2+ ions to receptor solution roots to the disappearance of the shoulder existing at 241 nm (Fig.4(a)), red shift of 297 nm broad peak to prominent peak around 308 nm, development of new shoulder near 354 nm at the expenses of 322 nm shoulder (Fig.4(b)) and formation of MLCT band, associated with the coordination of metal ion with sensor, around 458 nm (Fig.4(c)) which exposes sensing behavior of compound R1[30].
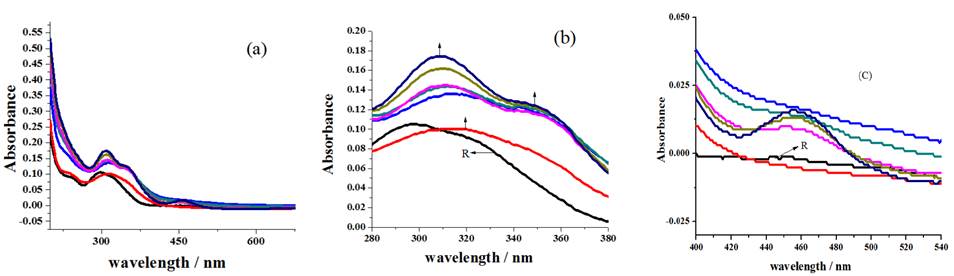
Fig. 4 Spectral changes noticed for the addition of Cu2+ ions (a) overall changes (b) redshift with new shoulder development (c) formation of MLCT band.
Cumulative additions of, Hg2+ ions causes conversion of 241 nm shoulder in to sharp peak at 235 (Fig. 5(a)); Ni2+ ions changes the 297 nm broad peak into shoulder near 309 nm (Fig. 5(b)); Pb2+ ions leads to the transformation of 233 nm shoulder into protuberant peak at 234 nm (Fig. 5(c)) projected the sensing ability of R1. Increasing the concentration of Mn2+ and Cd2+ ions into the receptor solution increases the absorbance value in all wavelength regions which also advocate the sensing behavior of R1[26].
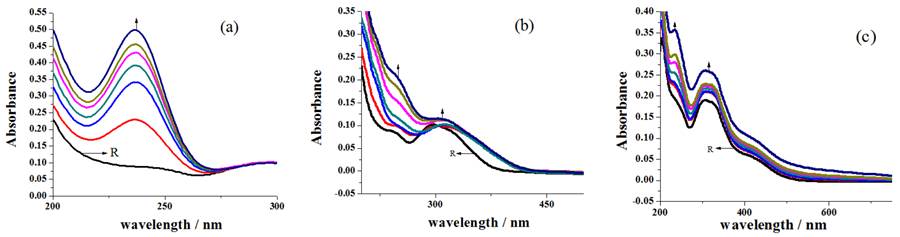
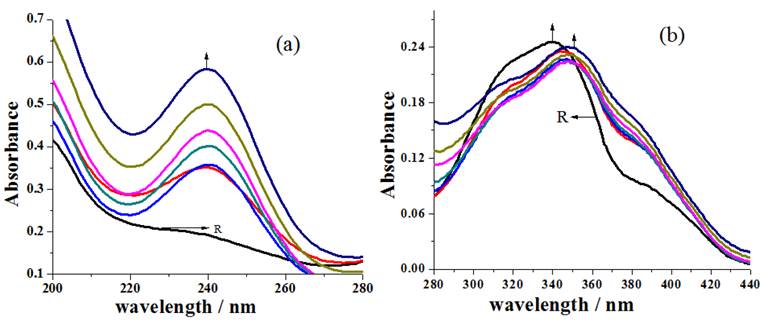
Compared to R1, protruding peaks are observed for R2 (Fig. 6(a) and 6(b)). Electron donating methyl groups present in the aromatic moiety of R2 might have caused the n-π* transition to occur effectively, which in turn causes the appearance of prominent peaks in the spectrum of R2.
Formation of MLCT band [30] accountable for the association of sensor with metal ion around 461 nm (Fig. 7(b)), blue shift of 340 nm broad peak to 335 nm (Fig. 7(c)) with the disappearance of 235 nm and 385 nm shoulders (Fig. 7(a)) of receptor for the incremental addition of Cu2+ ions to R2 discloses the sensing ability of receptor.
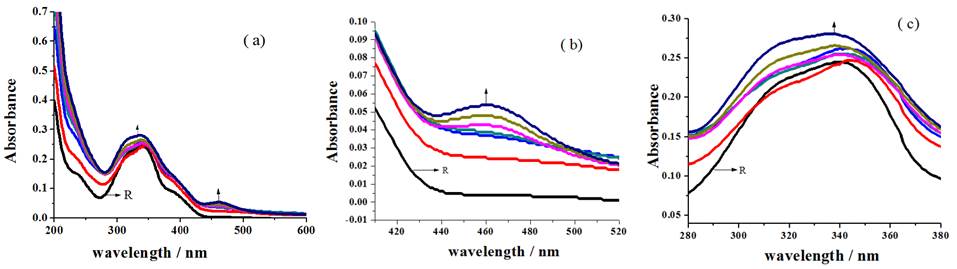
Fig. 7 Changes in the spectral behavior of R2 for the addition of Cu2+ ion (a) overall changes (b) MLCT band formation (c) blue shift of broad peak.
Additions of, Hg2+ ions originate new peak at 239 nm (Fig.8(a)), Ni2+ ions leads to red shift of 340 nm broad peak to 350 nm (Fig.8(b)) and Pb2+, Mn2+ including Cd2+ ions increase the absorbance throughout the wavelength region. Above observations substantiate the sensing behavior of R2 towards different metal ions.
Responses to applied potential and its correlation with sensing ability
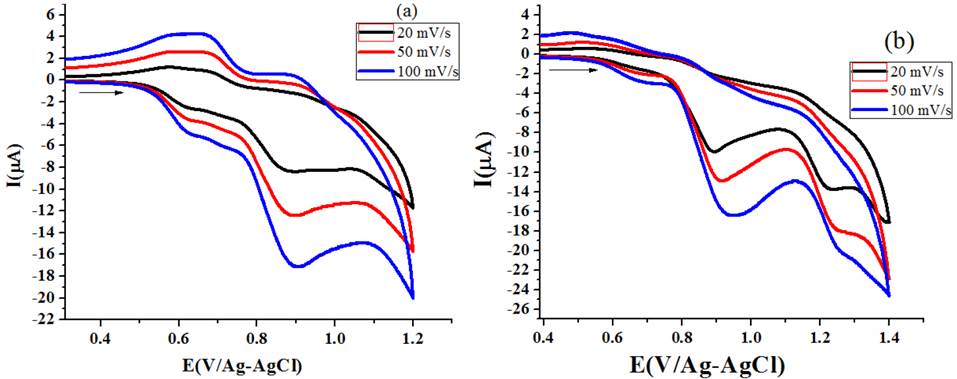
The cyclic voltammograms documented for R1 under various scan rate (Fig. 9(a) and 9(b)) comprised oxidation peak near 0.685 V alongside reduction peak around 0.558 V [31]. Parameters like ΔEP, Ipa and Ipc (Table 1) calculated from the voltammograms show raising trend with scan rate. The difference between the anodic and cathodic potential noticed (ΔEP) falls in the range of 125 - 163 mV which propose quasi-reversible reduction of ferrocene moiety [32], as it is very high than the expected 59 mV of reversible process.

Table1. Electrochemical parameters for R1.
| Scan Rate- mV/ sec | Epa (V) | Epc (V) | ΔEp (V) | E1/2 (V) | Ipa x10-6 (μA) | Ipc x10-6 (μA) |
| Solvent -Acetonitrile | ||||||
| 20 | 0.683 | 0.558 | 0.125 | 0.620 | -3.787 | 2.415 |
| 50 | 0.685 | 0.558 | 0.127 | 0.621 | -6.120 | 4.394 |
| 100 | 0.685 | 0.553 | 0.132 | 0.619 | -8.638 | 6.416 |
| Solvent - Ethanol | ||||||
| 20 | 0.706 | 0.558 | 0.148 | 0.632 | -3.167 | 1.623 |
| 50 | 0.712 | 0.551 | 0.161 | 0.631 | -4.563 | 3.019 |
| 100 | 0.712 | 0.549 | 0.163 | 0.630 | -6.242 | 4.661 |
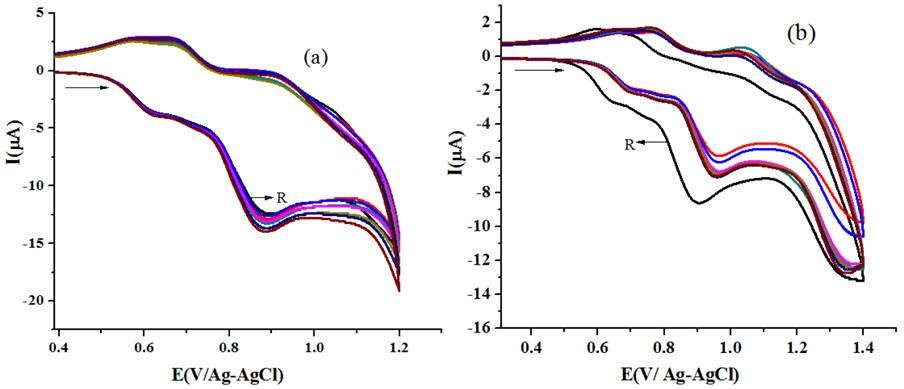
Redox behavior of ferrocene moiety after the addition of 20 μL (using micro pipette) of 1x10⁻³ M (Fig. 10(a)) or 1x10⁻¹ M (Fig. 10(b)) metal salts solutions up to 7 equivalents to 10 ml of 1x10⁻³ M R1 solution under 50mV/s scan rate demonstrate positive potential shift for oxidation peak and negative potential shift for reduction peak. Voltammograms obtained for the addition of Mn2+ ions to R1 solution are presented below as an example.
Contact between the metal ions and receptor leads to changes in the redox peak of ferrocene moiety. It is reflected in the noticed ΔEP and Ipa values. Electrochemical data taken for the successive addition of equimolar concentration of Cu2+ ions to R1 is presented in Table 2.
Table 2 Electrochemical data for the addition of 1x10⁻³ M Cu2+ ions to 1x10⁻³ M R1 solution (50 mv/s scan rate).
| Addition | Epa | Epc | ΔEp | E1/2 | Ipa x10-5 | Ipc x10-6 |
| Receptor | 0.635 | 0.587 | 0.048 | 0.611 | -3.732 | 2.637 |
| 20μL | 0.625 | 0.674 | 0.049 | 0.649 | -3.806 | 2.508 |
| 40μL | 0.631 | 0.676 | 0.045 | 0.653 | -3.59 | 2.854 |
| 60μL | 0.633 | 0.679 | 0.046 | 0.656 | -3.870 | 2.233 |
| 80μL | 0.624 | 0.670 | 0.046 | 0.647 | -3.733 | 2.919 |
| 100μL | 0.620 | 0.681 | 0.061 | 0.650 | -3.806 | 2.233 |
| 120μL | 0.620 | 0.676 | 0.056 | 0.648 | -3.532 | 2.919 |
| 140μL | 0.622 | 0.683 | 0.061 | 0.652 | -3.870 | 2.508 |
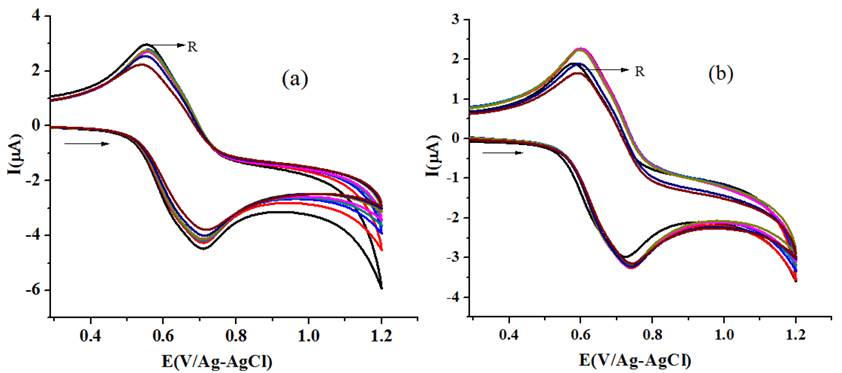
Dissimilarity in the binding affinity of different metal cations to sensor material is reflected in the noticed Ipa values (Table 3) for the addition of unalike metal ions (1x10⁻³ M) to receptor solution (1x10⁻³ M) (Fig. 11(a) and 11(b)). The repulsive force operating between the sensed metal cation and oxidized ferrocene moiety is also one of the reasons for the variation to occur in the noticed Ipa data [33]. Preference of recognizing order of R1 arrived from the ΔIpa % values intended from the Ipa statistic perceived for sensor solution and several metal ions added sensor solution is Hg-19.6 > Pb -15.9 > Ni-14.6 > Cu-8.7 > Mn -8.6 > Cd-2.9.
Table 3 CV data for the addition of various metal ion solution (R1, 10-3 M / M2+, 10-3 M) (Scan Rate-50 mV/ sec).
| Addition | Epa (V) | Epc (V) | ΔEp (V) | E1/2 (V) | Ipa x10-6 (μA) | Ipc x10-6 (μA) |
| Solvent - Acetonitrile | ||||||
| Receptor | 0.685 | 0.558 | 0.127 | 0.621 | -6.120 | 4.394 |
| Cu2+ | 0.679 | 0.553 | 0.126 | 0.616 | -5.992 | 4.433 |
| Ni2+ | 0.673 | 0.553 | 0.12 | 0.613 | -7.188 | 5.151 |
| Hg2+ | 0.677 | 0.555 | 0.122 | 0.616 | -6.949 | 5.470 |
| Solvent - Ethanol | ||||||
| Receptor | 0.712 | 0.551 | 0.161 | 0.631 | -4.563 | 3.019 |
| Cd2+ | 0.706 | 0.553 | 0.153 | 0.629 | -4.629 | 3.112 |
| Mn2+ | 0.712 | 0.558 | 0.154 | 0.635 | -4.274 | 2.758 |
| Pb2+ | 0.708 | 0.558 | 0.15 | 0.633 | -4.329 | 2.538 |

Fig. 11 Voltammograms recorded (scan rate- 50 mV/s) for the addition of different metal ion to R1(a) acetonitrile (b) ethanol.
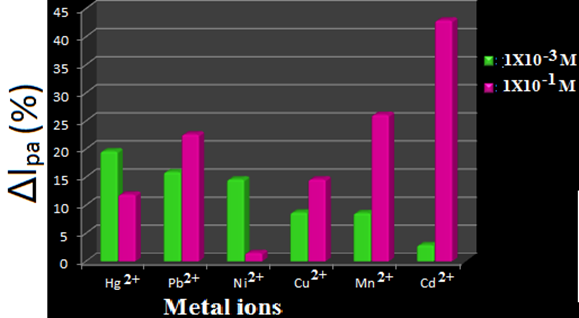
Sensing power of R1 (1x 10⁻³ M), under higher concentration of metal salts solution (1x 10⁻¹ M), deliberated (ΔIpa %) from the Ipa values (Table-4) is Cd - 42.9 > Mn-26.1 > Pb-22.6 > Cu-14.6 >Hg-11.9 Ni-1.5. Comparison of ΔIpa % amount attained for homo molar and hetero molar addition of metal salt solution exposes that R1 has better sensing ability at higher concentration of metal salts. Further, R1 is powerful towards Cd, Mn and Pb at higher concentration. It is potent to Hg, Pb and Ni at lower concentration. Fig. 12 represents the comparison made between the concentration of metal ions added and binding aptitude of R1.
Table 4 Electrochemical data obtained for the addition of 1X10⁻¹ M metal salt solutions to 1X10⁻³ M R1 (scan rate- 50 mV/s).
| Addition | Epa (V) | Epc (V) | ΔEp (V) | E1/2 (V) | Ipa x10-6 (μA) | Ipc x10-6 (μA) |
| Solvent - Acetonitrile | ||||||
| Receptor | 0.685 | 0.558 | 0.127 | 0.621 | -6.120 | 4.394 |
| Cu2+ | 0.727 | 0.613 | 0.114 | 0.67 | -7.906 | 5.151 |
| Ni2+ | 0.725 | 0.609 | 0.116 | 0.667 | -7.587 | 4.391 |
| Hg2+ | 0.739 | 0.624 | 0.115 | 0.681 | -6.912 | 4.991 |
| Solvent - Ethanol | ||||||
| Receptor | 0.712 | 0.551 | 0.161 | 0.631 | -4.563 | 3.019 |
| Cd2+ | 0.727 | 0.580 | 0.147 | 0.653 | -3.074 | 1.721 |
| Mn2+ | 0.739 | 0.601 | 0.138 | 0.67 | -3.266 | 2.229 |
| Pb2+ | 0.754 | 0.607 | 0.147 | 0.680 | -3.540 | 2.336 |
Electron donating methyl groups present in the aromatic moiety might have played role in the response showed by R2 for the applied potential and the voltammograms of R2 entail three redox peaks (Fig. 13(a) and 13(b)) under all scan rates. The metal centered redox peak perceived near 0.67V is assigned for the electrochemical behavior of Fe(II) present in the ferrocene moiety [32]. Ligand centered electron transition between aromatic moieties of receptor and azomethine group [28] emerges about 0.91 V. The redox peak appeared around 1.25V may be earmarked for electrochemical reversible reduction of imine group [34,35].
The sensing performance of R2 towards various metal ions was investigated using the same procedure used for R1. Figure 14(a) and 14(b) symbolize the changes in voltammograms noticed when 20 μL of HgCl2 salt solution with different concentration (either 1X10⁻³ M or 1X 10⁻¹ M) was added to 10 ml of 1X10⁻³ M receptor solution taken in the three compartment cell.
Different Ipa amount (Table 5) detected for dissimilar metal salt solution addition (20μL of 1X10⁻¹ M) to R2 solution (1X10⁻³ M) (Fig. 15(a) and15(b)) reflect the disparity in sensing aptitude of R2.
Table 5 Electrochemical data for hetero molar titration (R2, 10-3 M / M2+, 10-1 M) (50 mV/ sec).
| Addition | Epa (V) | Epc (V) | ΔEp (V) | E1/2 (V) | Ipa x10-6 (μA) | Ipc x10-6 (μA) |
| Solvent - Acetonitrile | ||||||
| Receptor | 0.635 | 0.587 | 0.048 | 0.611 | -3.732 | 2.637 |
| Cu2+ | 0.641 | 0.598 | 0.043 | 0.619 | -3.1290 | 1.707 |
| Ni2+ | 0.699 | 0.704 | 0.005 | 0.701 | -2.939 | 1.562 |
| Hg2+ | 0.690 | 0.770 | 0.08 | 0.73 | -1.853 | 1.373 |
| Solvent - Ethanol | ||||||
| Receptor | 0.659 | 0.532 | 0.127 | 0.595 | -1.812 | 1.302 |
| Cd2+ | 0.707 | 0.541 | 0.166 | 0.624 | -3.630 | 1.164 |
| Mn2+ | 0.682 | 0.521 | 0.161 | 0.601 | -1.756 | 1.085 |
| Pb2+ | 0.709 | 0.518 | 0.191 | 0.613 | -2.961 | 1.085 |
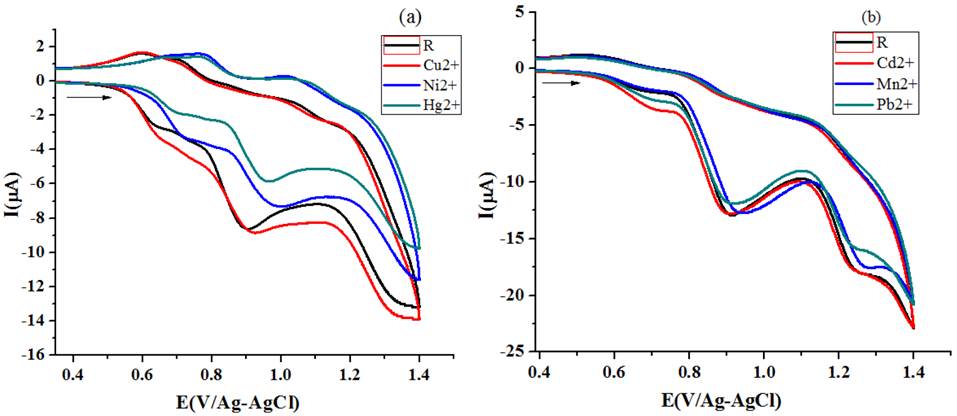
Fig. 15 Variations in CV of R2 [scan rate -50 mV/s] for the addition of different metal ion (a) acetonitrile (b) ethanol.
CV titration studies under homo molar conditions (addition of 20μL 1X10⁻³ M metal salt solution to 10 ml of 1X10⁻³ M receptor solution) also displayed difference in perceived Ipa values for Cu, Ni and Hg salt solution addition. For Pb, Cd and Mn salt solution addition the behavioral changes in the voltammograms are not appreciable, which indicate that the concentration of metal ions is too low for the receptor R2 to recognize them. The spot out ability of R2 arrived from ΔIpa values at multi molar concentration condition is Hg-47.9 > Ni-40.7 > Cu-35.2 >Mn-16.6 > Pb-16.6 > Cd-10.5 and at homo molar concentration it is (Cu-10.5>Hg-7.7>Ni1.2). The bar chart representation of role of concentration of metal ion and sensing ability R2 is given in Fig. 16.

Impedance measurement for receptors solution (R1 and R2) as well as Cu2+ ions (1x10⁻³ M and 1x10⁻¹ M) added receptor solution were measured. The Nyquist Plots (Fig. 17) arrived are presented here to support our investigation.
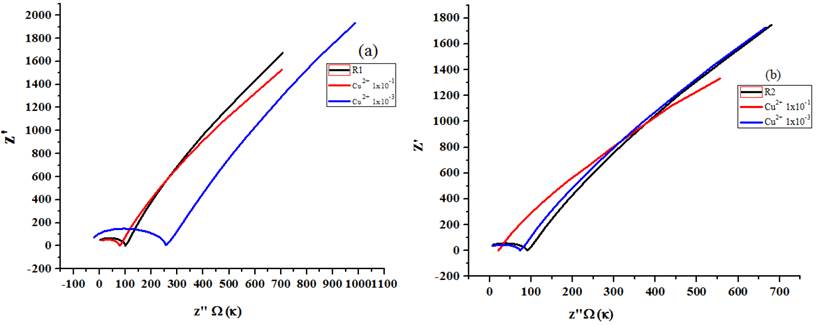
In the comparison chat for sensing ability of R1 (discussion section) it is proposed that R1 sensing ability towards copper increases with increase in concentration of Cu2+ ions. In the impedance plot (Fig. 17(a)) Rct value (260.7ohms) for 10-3 M Cu2+ ion added solution varies towards positive value compared to the Rct value of R1 (105.1 ohms), whereas for 10-1 M Cu2+ ion added solution the difference in Rct value (79.2 ohms) is towards negative side. Similarly, on analyzing the comparative chat of R2, it is declared that R2 is more potent at higher concentrations of Cu2+ ions. Impedance plot (Fig. 17(b)) of R2 (Rct- 90.3 ohms) shows minimum shift of Rct value (72.3 ohms) for 10-3 M Cu2+ ion added solution and maximum negative shift of Rct value (21.5 ohms) for 10-1 M Cu2+ ion added solution. Above observation ascertain that R2 require high concentration of Cu2+ ion for effective sensing.
Antimicrobial Studies
Inhibition zone detected in antibacterial studies for R1 & R2 using disc diffusion method containing Mueller Hinton Agar base against Escherichia coli, Salmonella typhimurium, Staphylococcus aureus and Streptococcus faecalis and anti-fungal studies in Sabouraud’s Dextrose agar as base against fungi Candida albicans and Aspergillus niger are of considerable amount. Antimicrobial analysis data perceived for R1 and R2 are presented in Table 6.
Table 6 In vitro antimicrobial studies data.
| Microorganisms | Control | R1 | R2 | Ciprofloxacin/ Ketoconazole |
|---|---|---|---|---|
| Zone of inhibition in mm for bacteria | ||||
| Staphylococcus aureus | - | 07 | 15 | 35 |
| Streptococcus faecalis | - | 10 | - | 28 |
| Escherichia coli | - | 09 | 10 | 35 |
| Salmonella typhimurium | - | 08 | 09 | 30 |
| Zone of inhibition in mm for fungi | ||||
| Candida albicans | - | 09 | 10 | 15 |
| Aspergillus niger | - | 07 | 10 | 27 |
Fungi Candida albicans growth is prevented by both compounds R1 (60 %) and R2 (66 %). Above results may lead to the development of new formulation of antifungal agent up on more specific research by pharmacist [23]. Growth of fungi Aspergillus niger is also restricted to an extend of R1 (26 %) and R2 (37 %). Level of preventive nature against all four bacteria by R1(20 %, 36 %, 26 % and 27 %) and R2(43 %, 0 %, 29 % and 30%) are on par with the value obtained for standard material Ciprofloxacine. Further it is clear that R2 is not successful to avoid the progress of Streptococcus faecalis. Schiff base compound 5-(benzylideneamino)-3-(4-methoxyphenylamino)-N-phenyl-1H-pyrazole-4-carboxamides, found to resist multidrug-resistant bacteria (MDRB) [36]. Some of the materials reported earlier showed higher antibacterial activity than ciprofloxacin [37]. Antifungal activity of cinnamyl Schiff bases [38] and resistivity of sulphonamides Schiff bases against multidrug-resistant fungi [39] also expose the antimicrobial activity of Schiff base compound.
Molecular docking studies
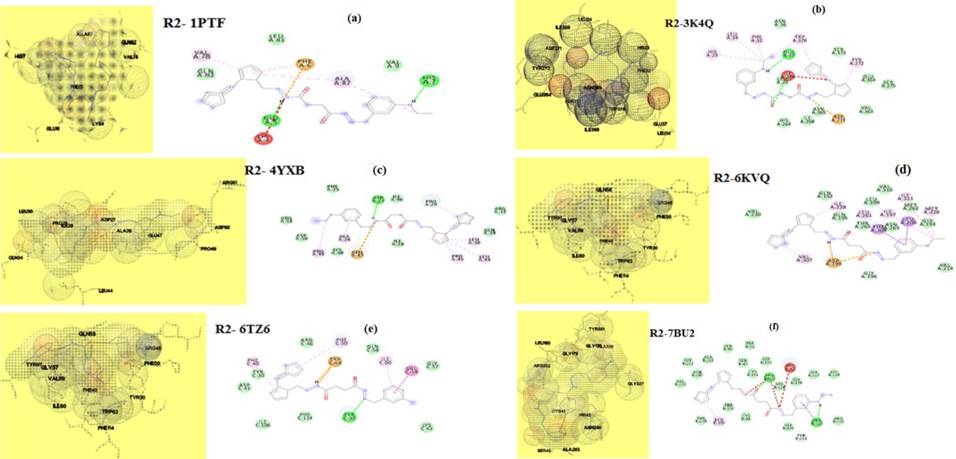
The driving force operating between the guest- host entities of drug molecule and targeted proteins of microorganisms is predicted using the molecular docking software. Relevant proteins employed in molecular docking studies for fungi are 3K4Q- Aspergillus niger, 6TZ6- Candida albicans, and bacteria are 6KVQ -Staphylococcus aureus, 4YXB- Salmonella typhimurium, 1PTF- Streptococcus faecalis and 7BU2- Escherichia coli. The data obtained are presented in Table 7. The 3D and 2D structural binding views of R1 and R2 are given in figures 18 ((a) to (f)) and 19 ((a) to (f)). The binding energy values calculated for R1 against fungi protein falls between - 6.99 to -7.63 kcal mol-1. For R2 it is -3.79 and -6.99 kcal mol-1, which exposes that both ligands are capable of fighting against fungi Aspergillus niger and Candida albicans.
Table 7 Results obtained in molecular docking studies.
| PDB | Free binding energy, kcal mol-1 | R1 | R2 | |||
| R1 | R2 | Hydrogen bonds with receptor amino acids | Distance(Å) | Hydrogen bonds with receptor amino acids | Distance(Å) | |
| 1PTF | -4.63 | -4.01 | 4-LYS 5-GLU 6-PHE |
3.94 3.78 3.19 |
6-PHE ALA-57 |
3.14 3.28 |
| 3K4Q | -7.63 | -3.79 | 32-PHE 23-HIS 365-ASN 373-SER |
3.91 3.58 3.86 3.44 |
32-PHE 365-ASN |
3.18 3.38 |
| 4YXB | -4.69 | -5.07 | 195-LEU 196-ILE 215-ILE |
3.43 3.17 3.27 |
26-ALA 27-ASP 28-ILE 29-PRO |
3.74 3.22 3.91 3.55 |
| 6KVQ | -8.28 | -2.14 | 22-GLY 131-VAL 103-SER |
3.28 3.66 3.16 |
192-GLN 193-GLY ASN-263 |
3.96 3.38 3.42 |
| 6TZ6 | -6.99 | -6.99 | 44-LYS 238-THR |
2.89 3.06 |
40-PHE 58-GLN 97-TYR |
2.78 3.86 3.75 |
| 7BU2 | -6.01 | -2.42 | 282-LEU 284-GLY 291-PHE |
3.55 3.72 3.13 |
329-ALA 332-ARG |
3.96 3.47 |
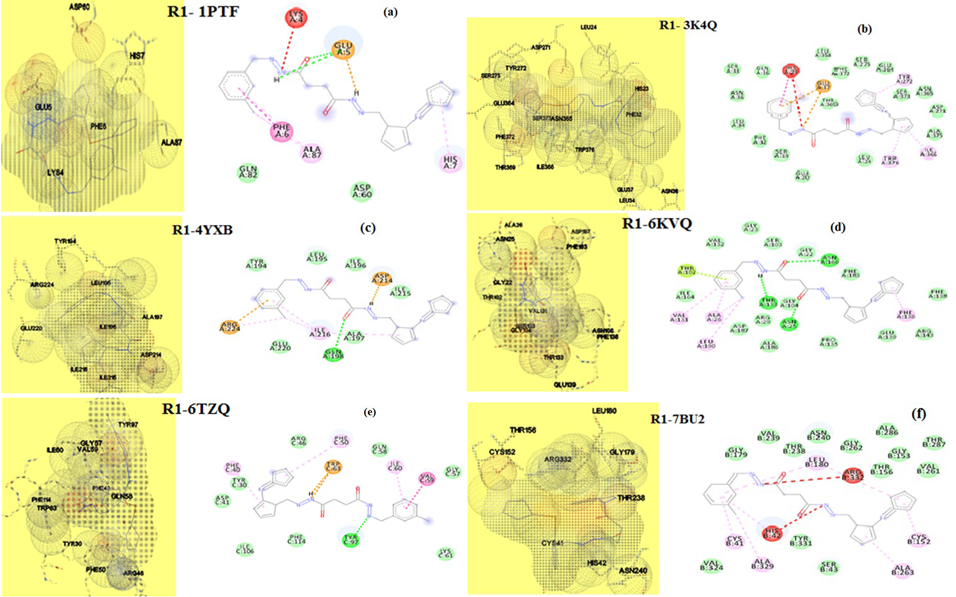
Fig. 18 3D and 2D view binding of R1 with (a) 1PTF, (b) 3K4Q, (c) 4YXB, (d) 6KVQ, (e) 6TZ6, (f) 7BU2.
Conclusion
High reactivity associated with ferrocene and its derivatives prevents the synthesis of unsymmetrical Schiff bases starting with a mixture of aromatic aldehyde, ferrocene aldehyde and amines (aliphatic or aromatic). Our attempts to prepare such type of Schiff bases resulted with unsymmetrical compounds N'1-((E)-4-(Nitro)benzylidene)-N'4-((E)-2-(ferrocenylidene)succinohydrazide and N'1-((E)-4-(Dimethylamino)benzylidene)-N'4-((E)-2-(ferrocenylidene)succinohydrazide. FTIR, proton NMR and Mass spectrum analysis endorse the formation of above materials. UV-Visible spectral analysis coupled with titration reveals the multi metal ion sensing capacity of newly synthesized sensors. From cyclic voltammetry studies, it is observed that the power of sensing changes with the change in concentration of targeted metal ions. Molecular docking and in vitro studies expose the antifungal activity of compound R1 and R2 against Candida albicans.

