


 text new page (beta)
 English (pdf)
 Article in xml format
 Article references
 Send this article by e-mail
 Cited by SciELO
  Similars in
SciELO
Similars in
SciELO 
 Permalink
Introduction
In recent years, ionic liquids (ILs) have attracted the attention from scientific community due to their unique physicochemical properties. ILs are salts with an asymmetric organic cation (generally substituted by an alkyl chain) and small organic or inorganic anion [1]. ILs have negligible vapor pressure, are liquids in a wide range of temperatures and have high chemical and thermal stability. Furthermore, their density, viscosity and hydrophilicity or hydrophobicity, the affinity towards organic and inorganic substances can be adjusted by selecting the cation and anion that constitute them [2]. The ILs have been applied in many fields, such as organic chemistry, electrochemical synthesis, separation processes, catalysis and polymerization processes [3]. Additionally, they have emerged as an alternative to conventional solvents in sample preparation techniques, because of the ability to incorporate functional groups within their structure that can interact selectively with a certain molecule or classes of molecules [4].
Solid-phase microextraction (SPME) is a miniaturized technique that appears as an alternative to conventional extraction procedures, using a small amount of extractant phase immobilized on a solid support and the technique is based on equilibrium processes [5]. SPME with fiber is the most widely used variant of this technique and generally consists of a fused silica fiber coated with a thin layer of extractant phase, such as polydimethylsiloxane, polyacrylate, divinylbenzene, carboxyne or octadecylsilane [6]. This technique can be carried out by direct-immersion of the fiber within the sample (DI-SPME) or when analytes are volatile or semivolatile by headspace (HS-SPME) [7]. Wide acceptance and multiple applications of SPME are due to simplicity of operation, it is considered as solvent-free technique and easy to automate. Besides, can integrate the sampling, extraction and preconcentration of analytes in one-step [8]. However, this technique has some disadvantages such as physical or chemical degradation of coating or extractant phase, mechanical fragility of the silica fiber and small number of commercially available fiber coatings [9]. To overcome these inconveniences, use of metallic materials as supports of the coating has allowed increasing the mechanical stability of fiber [10,11]. On the other hand, studies focused on development of new extractant phases have been presented as alternatives to traditional coatings to allow extraction of a wide range of analytes, with a lower cost, greater stability and durability [12].
In this sense, ILs emerge as new SPME fiber coatings due to their fascinating properties, in particular, their viscosity and adjustable miscibility in water [13]. In accordance with these properties of ILs, they have been successfully applied as new coatings in SPME fibers because their high viscosity improves the quality of coating and improves selectivity due to the nature of ionic groups they possess [14,15]. Others reports indicating that the high viscosity of ILs helps to generate a better coating of fibers; at the same time, its liquid state favors diffusion process of analytes from sample matrix to extractant phase [16]. Liu et al. [17] made the first report of use of ILs as SPME fiber coatings, in this work the 1-octyl-3-methylimidazolium hexafluorophosphate (OMIM-PF6) was used to coat fused silica and metallic fibers, evaluating its performance in extraction of benzene, toluene, ethylbenzene and xylenes in paints by headspace modality. Most of the fibers based on ILs have been applied in extraction procedures by headspace modality. There are reports where fibers have been manufactured based on ILs and they have been used in direct-immersion extraction, however, they have a limited application since they are used to extract non-polar analytes, such as alkylphenols [18] and organophosphate esters [19].
The developed fibers based to ILs have been manufactured by methodologies based on physical and/or chemical processes; of these methodologies, immersion-agglutination process is simplest, fastest and cost-effective [20]. Other coatings manufacturing processes, such as sol-gel technology, electrochemical polymerization, electrodeposition, bonding or chemical polymerization, among others; are laborious process that time consuming and use reagents, materials and equipment that make the procedure more expensive [21,22]. Therefore, in this work, the immersion-agglutination methodology was selected as fiber fabrication procedure. On the other hand, 1-decyl-3-methylimidazolium tetrafluoroborate (DMIM-BF4) was selected to manufacture of the fiber coating, because this IL in previous work within our work group, had the ability to extract hydrophilic compounds in liquid-phase microextraction processes [23]. Due to all of the above, there is a need to develop new coatings that allow expansion of SPME, particularly in direct-immersion extraction mode for which most of available coatings in market are not compatible. At the same time, to develop the fiber through a fast, simple and cheap manufacturing process.
The main goal of this work was the development and characterization of a new SPME fiber coating based on the DMIM-BF4 ionic liquid with help of a commercial adhesive and evaluate its potential use in direct-immersion extractions of molecules with a wide polarity range from aqueous samples. For to evaluate the new fiber coating performance, a diverse group of eight compounds belonging to the PPCPs as target analytes were used. The compounds included in the study have a wide polarity range with partition coefficients (log P) of -2.60 to 4.00. On the other hand, to the best of our knowledge, this study is the first that report the fabrication of a fiber coating based on DMIM-BF4 and makes an exploration to its use in extractions by direct-immersion mode for PPCPs analysis in water samples.
Experimental
Reagents and materials
Stainless-steel wires type 304 L 0.30 mm in diameter of orthodontic grade purchased from American Ortho Tech (Daytona Beach, FL, USA) were used as SPME fiber support. Etching of the wire was performed with hydrochloric acid (36.5-38 %) from J. T. Baker (Radnor, PA, USA), nitric acid (65 %) from CTR (Monterrey, NL, México) and sodium hydroxide (98 %) from Fluka (Steinheim, NR-W, DE). For development of the fiber coating, IL 1-decyl-3-methylimidazolium tetrafluoroborate (98 %, DMIM-BF4) from Sigma-Aldrich (Saint Louis, MO, USA) and adhesives UHU® from Bolton Group (Bühl, B-W, DEU) and Silicon Pelikan® from Pelikan México (Puebla, PUE, MEX) were used; in addition, dichloromethane (99.8 %) from Tedia (Fairfield, OH, USA), acetone (99 %) from J. T. Baker (Radnor, PA, USA), hexane (95 %) from Mallinckrodt (Phillipsburg, NJ, USA) and toluene (95 %) from Sigma-Aldrich (Saint Louis, MO, USA). PPCPs standards used as model analytes were benzophenone-3 (BP 3, 98 %), benzophenone-4 (BP-4, >97 %), caffeine (CAF, reagent plus), diclofenac (DIC, 95 %), metformin (MET, 97 %), methylparaben (MP, >99 %), propylparaben (PP, >99 %) and naproxen (NAP, USP grade) were all from Sigma-Aldrich (Saint Louis, MO, USA). For the mobile phase, methanol (HPLC grade) from J. T. Baker (Radnor, PA, USA), formic acid (99 %) from Merck (Darmstadt, HES, DEU), ammonium hydroxide (29 %) from Sigma-Aldrich (Saint Louis, MO, USA) and deionized water were used; the deionized water was obtained using a Pure Lab Flex filtration system from Elga Veolia (Lane End, BUC, UK).
Standards and working solutions
The PPCPs standard solutions (500 µg mL-1) were prepared in methanol and stored in dark in a freezer at -4 °C until use. Working solutions of analytes were prepared by dilution from concentrated PPCPs standard in deionized water or in sample matrix, in all solutions organic solvent (methanol) amount was ≤3 % and were stored in amber vials at 4 °C until use.
Chromatographic conditions
Chromatographic analysis was carried out on a Waters Alliance 2695 chromatography system by Waters (Milford, MA, USA) equipped with an on-line degasser, quaternary pump, autosampler, column oven and a Waters 2996 photodiode array detector. Chromatographic separation of target analytes was obtained on a Discovery HSF5 column (2.1 mm x 150.0 mm, 3 μm) from Supelco (Saint Louis, MO, USA) using a mobile phase of methanol and formate buffer solution (40 mM, pH 4). Two elution gradients were used, the first for determination of all target compounds, which consisted of a program that started with 5 % methanol, increasing to 85 % in 10 min in a linear gradient, followed by an isocratic period of 8 min, then return to 5 % methanol in 2 min and remaining unchanged for 15 min as equilibrium time (Gradient I); the other gradient was used once that the extraction capacity of the fiber toward the tested compounds was established and started in 60 % methanol, changing to 85 % in 9 min with a linear gradient and followed by an isocratic period of 2 min, and then methanol content decreased to 60 % in 1 min and was maintained for 13 min as equilibrium time (Gradient II). For both gradient systems, mobile phase flow was 0.2 mL min-1, an injection volume of 5 μL and column oven was maintained at 45 °C. The analyte detection wavelengths were 233 nm for MET, 273 nm for CAF, 257 nm for MP and PP, 232 nm for NAP, 280 nm for DIC and 290 nm for BP-3 and BP-4.
Fiber preparation
To start fiber manufacturing, stainless-steel wires 7 cm long were cut, of which 3 cm were etched by immersion in 5 M HCl solution at 50 °C for 60 min, using a bath with thermostatted recirculator Haake B3 and a magnetic stirring heating plate CIMAREC, both from Thermo Scientific (Waltham, MA, USA). Then, wire fragments were washed with deionized water for 15 min in an ultrasonic bath Bransonic 3510 from Branson Ultrasonics (Danbury, CT, USA). For homogeneous coating mixture 0.3 g of the adhesive, 0.3 mL of IL, 0.15 mL of dichloromethane were used and were stirred for 1 min in a vortex shaker. Coating of etched wires was carried out by immersion-agglutination method, dipping 2.0 cm of wire into the homogeneous mixture of IL and adhesive. Immersion cycles were three immersions for 30 s each, then the wires were dried for 1 h at room temperature and subsequently dried for 30 min at 40 °C in oven. Etch process evaluation and coating analysis of wires was made with help of a Leica 2000M stereoscope from Leica (Wetzlar, HES, DEU), SM-510 scanning electron microscope (SEM) from TOPCON (Tokyo, JPN) equipped with X-ray dispersive energy spectrometer (EDS) and electro disperse and secondary electron detectors. Also used a VHX 5000 digital optical microscope from Keyence (Osaka, JPN) and an FT-IR-ATR infrared spectrometer Frontier Model from Perkin Elmer (Waltham, MA, USA). Manufactured fibers were assembled in disposable syringes of 1 mL to facilitate handling.
SPME by direct-immersion
All extractions were performed by direct-immersion mode. In the analysis of the tap water samples, the previously optimized conditions of DI-SPME method were used, employing 8.0 mL of sample, which were placed in 10 mL vials of clear glass. The sample was subjected to 800 rpm constant agitation at laboratory temperature (21-22°C). Then, 2.0 cm of coated fiber were immersed in sample at a constant height for 15 min. After the extraction time, the fiber was removed from the solution and immediately introduced into a vial containing 0.3 mL of desorption solution, which was a mixture of deionized water and methanol (70:30) for 30 min. Finally, the vials were sealed and agitated with vortex shaker by 10 seconds, 5 μL of desorption solution was injected into HPLC system for analysis using Gradient II.
Method validation of SPME by direct-immersion
Analytical performance of DI-SPME proposed method for PPCPs analysis (MP, PP, NAP, DIC and BP-3) was evaluated under optimal conditions to determine their applicability in water sample analysis. Method was validated by means of parameters such as linearity, detection limit (LOD) and quantification limit (LOQ), precision and accuracy, taking into account recommendations of the EURACHEM guidelines [24]. To evaluate linearity, calibration curves of external standard by triplicate were constructed, using standard PPCPs solutions in deionized water at five concentration levels (0.5, 2.5, 5.0, 10 and 15 μg mL-1). The association between variables was established by a least squares regression analysis for responses of each analyte vs. concentration, equation of calibration line and correlation and determination coefficients (R2) were obtained. LOD and LOQ were calculated using calibration curve data, according to 3.3 and 10 times the ratio of the standard deviation of the calibration line intercept and slope of the calibration line, respectively. Precision was assessed by using the relative standard deviation percentage (% RSD) values of the analytes response or chromatographic peak areas at all concentration levels of the calibration curve within of three consecutive analytical runs carried out. Accuracy was evaluated by a back-calculated process for each standard of the calibration curve using the equation of calibration line previously obtained. Correlation between nominal concentrations of standards and calculated concentrations was evaluated by means of regression analysis and deviation of nominal value was calculated through recovery calculation.
Collection and water sample analysis
Ten water samples were collected, three samples were obtained from a cistern type tank from the potable water supply system of Monterrey municipality, identified as M1, M2 and M3; remaining seven samples were obtained from different taps connected to the potable water supply system in the municipalities of San Nicolás de los Garza (M4), Guadalupe (M5), Apodaca (M6), Monterrey (M7), Escobedo (M8), García (M9) and Santa Catarina (M10), all municipalities belonging to the Monterrey Metropolitan Area in the state of Nuevo León, México. All samples were refrigerated at 4 °C until analysis. Before extraction, samples were put to laboratory temperature and filtered by gravity through 125 mm diameter cellulose filter paper Whatman grade 2 from GE Healthcare (Chalfont St Giles, BUC, UK). The practical feasibility of proposed method for PPCPs determination (MP, PP, NAP, DIC and BP-3) in collected water samples was evaluated by analyzing fortified samples at 1.5 μg mL-1. Extraction-desorption process was carried out under optimal conditions established for SPME method by direct-immersion. For accuracy, recovery percentage (% R) was determined, which was calculated using Equation 1. Precision was evaluated with percentage of relative standard deviation (% RSD) of concentrations obtained from each of analytes extracted.
Results and discussion
Fiber preparation
Fiber manufacturing was divided into two stages: first, metal wires were etched and subsequently a homogeneous mixture of adhesive-solvent-IL for etched metal wires coating was obtained. A stainless-steel wire was chosen as the support to manufacture the new SPME fiber, which was subjected to etching based on a previously reported methodology with some modifications [18, 25]. Metal wire fragments of 3 cm were etched by immersion in 12 M HCl, 15 M HNO3 and 5 M NaOH at 50 °C for periods of 10 to 180 min, all experiments were performed by triplicate. After each treatment time, wires were washed twice in deionized water for 15 min in an ultrasound bath. To prove effectiveness of the different substances on morphology and surface of metal wires, analyses were performed using optical microscopy and SEM. Wires treated with 15 M HNO3 and 5 M NaOH showed no apparent etching at any of times evaluated when they were observed under stereoscope. On the other hand, when treatment with 12 M HCl was performed, wires presented roughness and porosity at 10 min, however, in all of them a considerable decrease in its diameter was observed, so it was decided to carry out a less aggressive treatment with 5 M HCl. After immersion in 5 M HCl solution, wires exhibited roughness and porosity at all evaluated times, which was more evident after 60 min. In Fig. 1(a) and 1(b), wire images are shown before and after treatment with 5 M HCl, respectively. Before treatment surface is smooth (Fig. 1(a)) and after treatment surface has great porosity (Fig. 1(b)), porosity increases its surface area, which favors adhesion and permanence of a greater amount of coating material on wire [19]. Although treatment time used was 40 and 45 min longer than that reported by Cui et al. [18] and Kang et al. [25], respectively; solution for etched used in this work is less corrosive and dangerous than HF solution used in both those works cited above.
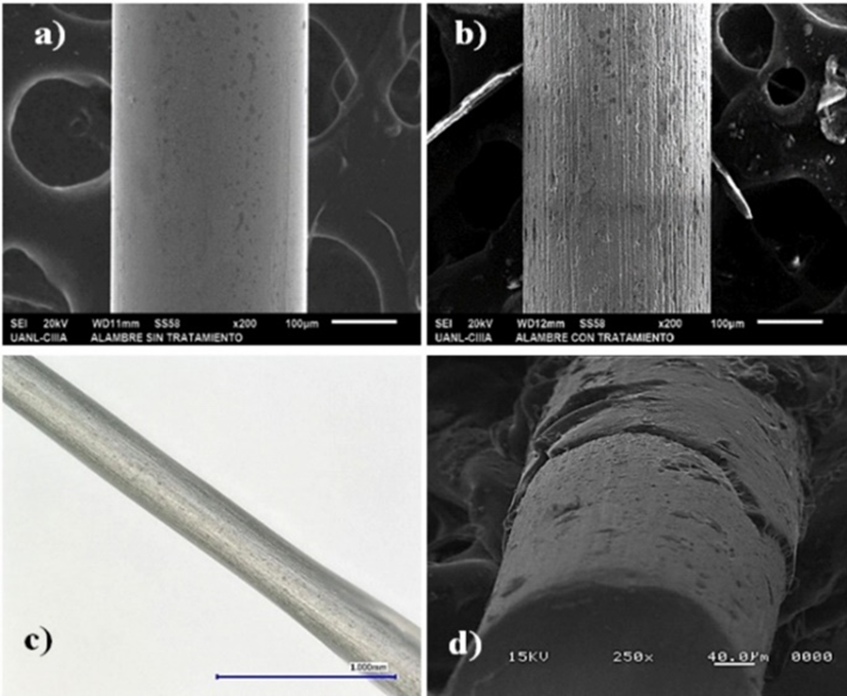
Fig. 1 SEM image of stainless-steel wire surface: (a) before and (b) after etching, both with magnifications of 200x. Images of stainless steel wire coating with DMIM-BF4 + UHU® obtained in: (c) optical microscope with magnifications of 150x and (d) scanning electron microscope with magnifications of 250x.
For coating development, a mixture of IL and commercial adhesives (Silicon Pelikan® and UHU®) was used, because the manufacture of fibers with greater thickness and physical and chemical resistance of coating has been reported when ILs are used in conjunction with an adhesive as coating material [26, 27]. In first instance, to obtain the homogeneous mixture of the new coating components, the solubility of selected adhesives was tested in different solvents, such as dichloromethane, acetone, toluene and hexane. In the same way, miscibility of the adhesives with the ionic liquid was evaluated. The adhesives solubility in organic solvents was proven because various reports mention that use of these substances together with IL-adhesive mixture improves their homogeneity and gives the coating material better physicochemical characteristics [28]. Silicon Pelikan® and UHU® were soluble in dichloromethane. On the other hand, both adhesives showed ability to form a homogeneous mixture with selected ionic liquid. For coating of the previously etched wire, immersion-agglutination method was used, which consists of submerging the material to be coated in the mixture or coating material for several cycles with different duration times, until obtaining desired film [19, 29]. Cycles evaluated were: one immersion for 1 min, three immersions for 30 s each and three immersions of 1 min each. IL and Silicon Pelikan® mixture was able to form a film on the wire in all evaluated conditions. However, coating achieved with three immersions of 1 min was visually most homogeneous. While IL with UHU® mixture was also able to form a film on the wire, process of three immersions of 30 s each showed a more homogeneous coating, however, a drop on distal part of wire was observed. As mentioned above, solvents addition in the IL-adhesive mixtures favor some characteristics of them, so that to avoid the presence of this drop at distal end of wire, it was decided to add dichloromethane to mixture. Therefore, wire was coated with mixture formed by IL, UHU® and dichloromethane; this last component was evaporated during drying process, leaving a uniform film. In the same way, Amini et al. [14] and Meng et al. [30] they added dichloromethane and acetone to coating mixtures, respectively; both mention that they performed it to obtain fibers with more homogeneous and thin coatings, as was done in this work.
Fiber characterization
Manufactured fibers based on Silicon Pelikan® and UHU® mixtures were observed with under an optical microscope and SEM. It was observed that Silicon Pelikan® coating fiber was not uniform because it presented two zones with different coating thicknesses, the first with an average thickness of 5.72 μm and other zone with 8.49 μm of average thickness. In the same way manufactured fiber with UHU® was evaluated, in Fig. 1c can be seen coating deposited on metallic wire when it was observed under an optical microscope. In addition, UHU® coating was uniform because only a coating area with average thickness of 7.12 μm is distinguished as can be seen in Fig. 1(d) obtained using electron microscopy. Because UHU® based fiber presented most uniform coating, was selected to continue with experimental development and use it in DI-SPME processes. The thickness of fibers made in laboratory is very varied and depend of coating material used in its manufacturing [16, 27]. However, it is important to highlight that it is desirable to achieve a homogeneous coating with greatest thickness possible to have a greater amount of extractant phase [8].
On the other hand, studies were also carried out in a SEM with an EDS detector to perform an elemental analysis of the fiber’s materials and to verify the presence of IL-adhesive mixture on wire [31]. Fig. 2(a) shows spectrum obtained from bare wire and as can be seen, wire composition is of Cr, Mn, Fe and Ni because emission lines corresponding to these elements were obtained. In Fig. 2(b), spectrum obtained of coated wire with DMIM-BF4 and adhesive is shown, in graphic corresponding elements lines to wire alloy appear, but it is important to highlight the presence of a line corresponding to carbon, which can be attributed to polymeric material deposited on wire surface.
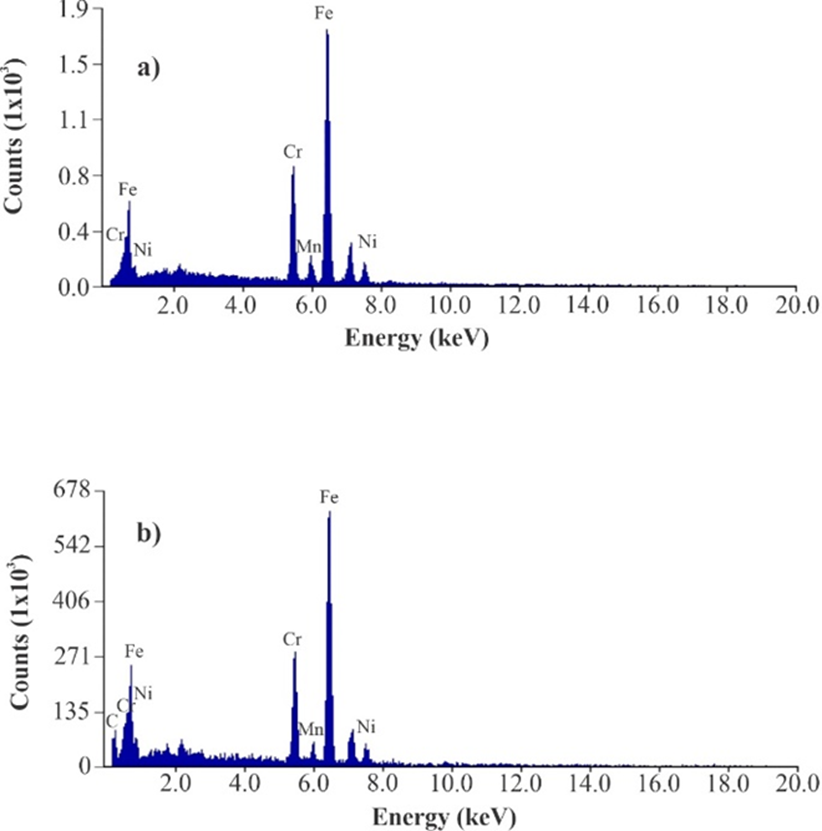
Fig. 2 Coating characterization images: (a) EDS spectra obtained from uncoated etched wire and (b) EDS spectra obtained from etched wire coated with DMIM-BF4 + UHU®.
In addition, infrared spectroscopy (IR) analysis was carried out in-situ on fibers, to compare and corroborate coating composition of fibers coated only with adhesive and fibers coated with the IL-adhesive mixtures [32,33]. The UHU® is a polyvinyl acetate and cellulose nitrate adhesive, and IR spectrum shows characteristic bands between 1720-1750 cm-1 corresponding to symmetrical stretching of C=O bond, a band between 1210-1250 cm-1 corresponding to stretching of C-O bond of the ester and band between 1010-1030 cm-1 derivative of stretching of CO(CH-O) group of polyvinyl acetate [34]. On the other hand, bands in regions 1300-1375 and 750-1000 cm-1 of the stretching of NO2 and R-O(-NO2) groups can be seen, respectively, both from nitrocellulose [35]. The UHU® adhesive IR spectrum is shown in Fig. 3(a). DMIM-BF4 IR spectrum has bands between 3100 and 3200 cm-1 due to symmetric and asymmetric stretching of CH bonds of imidazolium ring, and broad band that appears between 1000 and 1100 cm-1 corresponds to anion interaction with radiation [36-38], ionic liquid spectrum is shown in Fig. 3(b). IL and adhesive have some similar bands in their IR spectrums, for example, bands between 2800-3000 cm-1 due to stretching of CH bonds of aliphatic chains present in both substances and band between 1000-1100 cm-1, corresponds to overlap of IL anion bands and stretching band CO (CH-O) of adhesive that appears between 1010-1030 cm-1. Fig. 3(c) shows the IR spectrum obtained from coating deposited on wire, which shows that new extractant phase is composed of a mixture of IL-UHU® when observing characteristic bands of both substances in spectrum.

Fiber extraction capacity
The model analytes of this work were some PPCPs (MET, CAF, BP-4, MP, PP, NAP, DIC and BP-3) with different physical and chemical properties, as can be seen in Table 1. These molecules were chosen in order to evaluate the performance of the fiber in the extraction of hydrophobic and hydrophilic compounds on extractions by direct-immersion. For these experiments, a HPLC method previously reported by our working group was used [39].
Table 1 Chemical structures, log P and pK a values of PPCPs included in this study.
| Analyte | Structure | log P | pK a | Reference |
|---|---|---|---|---|
| Metformin |

|
-2.60 | 2.80 / 11.50 | 63 |
| Caffeine |

|
-0.07 | 13.90 | 64 |
| Benzophenone-4 |
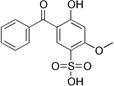
|
0.89* | 2.40*/7.60* | 65 |
| Methylparaben |

|
2.00 | 8.30 | 66 |
| Propylparaben |

|
2.90 | 8.20 | 66 |
| Naproxen |

|
3.18 | 4.30 | 64 |
| Diclofenac |

|
3.70 | 4.20 | 66 |
| Benzophenone-3 |
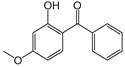
|
4.00 | 7.60 | 66 |
*Calculade with Chem Axon software from ChemSpider (Royal Society of Chemistry; Cambridge, UK).
To evaluate extraction capacity of manufactured fibers, extractions were made to aqueous standard solutions of the eight PPCPs in mixture (2 μg mL-1) using coated fibers only with adhesive and coated fibers with IL-adhesive mixture. Extractions were carried out using 8 mL of standard solution at laboratory temperature with stirring of 800 rpm and desorption was made by immersing 2 cm of coated fiber in 0.3 mL of water and methanol (80:20) for 30 min, all desorption solutions were injected to HPLC system and were analyzed using Gradient I.
The fibers coated only with UHU® and fibers coated with DMIM-BF4 and UHU® mixture showed ability to extract only MP, PP, NAP, DIC and BP-3; these compounds are most hydrophobic of eight studied molecules. MET, CAF and BP-4 are the most hydrophilic compounds and they were not extracted by any fibers. Results obtained with both fibers were compared and presence of IL in coating increases the extraction capacity of developed fiber as can be seen in Fig. 4.
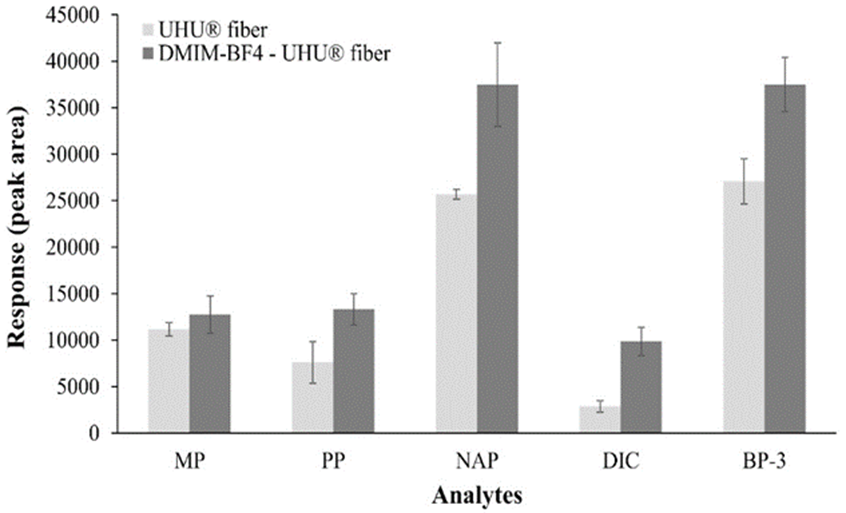
This is consistent with reports by He et al. [27] because they developed a coated fiber with silicone elastomer and 1-ethoxyethyl-3-methylimidazolium bis (trifluoromethane) sulfonylimide for amphetamine and methamphetamine extraction from urine samples, seeing that the presence of IL increased up to 7 times the extracted analyte amount. On the other hand, individual extractions of non-extracted molecules were made, to evaluate if fact of not extracting them was for a competition towards fiber. However, no recovery of these analytes was observed, which shows a low affinity of these toward fiber coating and not a competition with the other molecules. Interactions that coating components can present are ionic type due to inherent charges of DMIM-BF4 and nitrocellulose of UHU®, and hydrophobic interactions by alkyl chains that both substances have [40]. The ILs have very diverse structures, being able to present dispersive interactions, hydrogen bonds, π-π, dipole and ionic interactions [41]. According to type of extracted analytes, favored interactions between coating and analytes, are likely to be π-π because both have aromatic rings; they can also form hydrogen bonds and depending on pH they can be ionized, so they can even show ionic interactions. However, is likely that predominant interactions are of hydrophobic type because there is a greater presence of alkyl chains in coating structure; therefore, most favored analytes in extraction are those that have highest log P values. Then, serial extractions with same fiber of different PPCPs standard solutions at same concentration were performed to evaluate fiber durability, because lifetime of SPME fibers is a crucial factor for its application. In common fibers, extraction efficiency can decrease when increasing number of times that fiber is used, due to coating damage that occurs when it is exposed to high temperatures, different solvents, acids or strong bases or different sample matrices [42]. In these experiments with manufactured fiber, it was observed that chromatographic peak areas of analytes decreased as number of extractions increased. Even with this decrease, at least three extractions with same fiber were tested and these showed no significant difference. However, considering that manufacturing process is simple and cheap, it was decided to make only one extraction with each of manufactured fibers. Other works have reported the use of ionic liquids-based fibers in a greater number of extractions, but use their fibers in headspace mode extractions, in which coating has no direct contact with sample matrix, due to this there is a lower probability of damage, as reported by Gao et al. [43]. In case of extractions by direct-immersion mode, Shi et al. [19] developed a fiber based on 1-hexyl-3-methylimidazolium tris (pentafluoroethyl) trifluorophosphate, used in great number of extractions (up to 65) and this is attributed to the extremely high hydrophobicity of IL used.
As mentioned earlier, developed fiber did not show extraction capacity for MET, CAF and BP-4, so that various conditions were evaluated to find a chromatographic method able to separate the five extracted analytes (MP, PP, NAP, DIC and BP-3) in shortest possible time and continue with experimental development, resulting in method Gradient II (see experimental section).
Optimization of SPME by direct-immersion
SPME is a technique based on equilibrium processes and consists of two stages (extraction and desorption), analytical responses obtained in the two stages are affected by numerous factors. One option to determine optimal conditions of each stage, evaluate the statistical significance of factors involved and to reduce the number of assays to be performed, is using tools such as design of experiments.
Optimization of extraction conditions
In extraction stage, first an experimental design that consisted of a randomized 25-1 fractional factorial design with four central points was applied, for screening the most important factors that affect system and to find the highest extraction efficiency. The factors evaluated in optimization of extraction conditions were time (15 and 45 min), temperature (25 and 40 °C), stirring (0 and 800 rpm), salt addition (0 and 10 %) and salt type added (NaCl and Na2CO3), which are summarized in Table 2. Values of central points of the fractional factorial design were 30 min, 32 °C, 400 rpm and 5 % of salt addition. Previously mentioned factors were evaluated at two levels coded as high value (+) and low value (-), for continuous variables and at two levels (1 and 2) for categorical variables, performing 20 experiments, model design was assisted through Statgraphics Centurion XVII program from Statgraphics Technologies (The Plains, VA, USA).
Table 2 Experimental factors evaluated in extraction stage.
| Extraction factors | |||
|---|---|---|---|
| Factor | Code | ||
| Low value (+) | Central point | High value (-) | |
| Time | 15 | 30 | 45 |
| Temperature | 25 | 32 | 45 |
| Stirring | 0 | 400 | 800 |
| Salt addition | without | 5 % | 10 % |
| Salt type | NaCl | Na2CO3 | |
Even though in SPME process the extraction is correlationated with pH, since according to pKa of molecules these can be ionized or non-ionized, in non-ionized state extraction is favored, because the partition coefficient between fiber coating and molecules it increases [8]. Moreover, protonation and deprotonation of the nitrogen atoms in imidazole group of IL are largely pH-dependent, which can influence extraction efficiency due to change of hydrophobicity of sorbent coatings [44]. Therefore, in this work it was decided not to evaluate pH, in order not to favor extraction of one molecule while decreases extraction of another molecule, due to wide diversity of properties or characteristics of model analytes.
All assays were performed with 8 mL of PPCPs standard solutions in water at 2 μg mL-1 and desorption conditions were kept constant in all experiments, using 0.3 mL of a water and methanol (80:20) mixture for 30 min, immersing 2.0 cm of fiber. All experiments of conditions to optimize at extraction were analyzed by HPLC with Gradient II. The factor effects were evaluated by the chromatographic peak areas obtained for each of the analytes and coefficient plots were constructed with Modde 12.2 program from Umetrics (Umeå, SWE). These plots show a multiple linear regression model to evaluate relationship between dependent and independent variables. Variable effect is significant when the confidence interval does not cross zero. Model parameters: R2 (goodness of fit, R2 >0.5) and Q2 (goodness of prediction, Q2 >0.5) confirm the model validation. Conforming with results, all analytes exhibited good behavior in model designed according to values obtained in regression analyzes. On the other side, for most analytes, probability values obtained in lack-of-fit test were greater than 0.05, which indicates a good adjustment of analyte´s behavior in system and in estimation of standardized effect of each factor studied. Only for NAP and DIC were probability values lower than 0.05, which were 0.003 and 0.012, respectively.
It can be seen in Fig. 5(a) that temperature factor had a significant effect on MP, NAP and DIC responses, while sample agitation was significant in PP, DIC and BP-3 extraction. Agitation favors diffusion and mass transfer of sample analytes toward extractant phase, contributing to reduction time in which equilibrium is reached [45]. Therefore, it decided to work at 800 rpm of stirring rate because it was observed that analytes recovery was higher when extraction was carried out with agitation. The time factor did not have a significant effect on response of any analytes, so shortest extraction period (15 min) was selected. Although SPME is a non-exhaustive extraction technique, time is directly related to amount of analyte extracted, is possible to obtain quantitative and accurate results when extraction is performed in conditions where equilibrium has not been achieved, as long as time is accurately controlled throughout procedure [2]. On the other hand, salt addition (ionic strength) was a factor that only had a significant effect on NAP responses. The salt type added was significant for all analytes except for DIC; however, it was observed that when using Na2CO3, fiber coating took on a white color and presented an apparent deposit of crystals on the surface, therefore, this salt was discarded for subsequent experiments. Because of the previous results, only factors to optimize were salt concentration added (NaCl) and temperature. Initially, to carry out optimization of these factors, prediction tests were carried out, which consisted of a two-factor modeling test and contour plots of these experiments were generated. As can be seen in contour plots of Fig. 5(b), using low temperatures and low salt concentrations, all analytes response is maximized. Predictive values of salt content were in range of 0 to 4.5 % NaCl and temperature range was 25 to 28 °C. During all experiments, work was done at laboratory temperature (21-22 °C), coded in experimental design as 25 °C. The extraction temperature is critical for quantification and extraction efficiency because it affects kinetics and thermodynamics of the process. High extraction temperatures usually increase analytes diffusion rate, which causes faster extractions. On the other hand, because adsorption is generally an exothermic process, amount of adsorbed analytes on fiber decreases as temperature rises [46]. However, it was observed that for experiments at high temperatures analyte areas were lower than those obtained when working at laboratory temperature. This can be attributed to increase in temperature because IL solubility is favored in aqueous matrix and it show a decrease in its viscosity, which could cause a loss of immobilized coating on metal support [47]. Because of the above, extraction efficiency can be diminished; considering these observations, it was decided to set laboratory temperature (21-22 °C) as extraction temperature.

Fig. 5 (a) Coefficient plots for standardized effect of factors extraction time (ET), extraction temperature (TE), stirring (AG), salt addition (SA) and salt type (ST); evaluated in optimization of PPCPs extraction and (b) Contour plots obtained for predictive values of quantity of salt addition (ionic strength) and extraction temperature in optimization of PPCPs extraction.
With this, only factor to optimize was ionic strength of solution, for which a factor-by-factor design was used, carrying out three experiments by triplicate, evaluating conditions without NaCl, 3 % and 5 %. Results of optimization of the NaCl content showed that MP and PP recovery increases as salt content increases, while an opposite effect is observed with DIC and BP-3; with NAP a variable behavior is observed, as can be seen in Fig. 6.
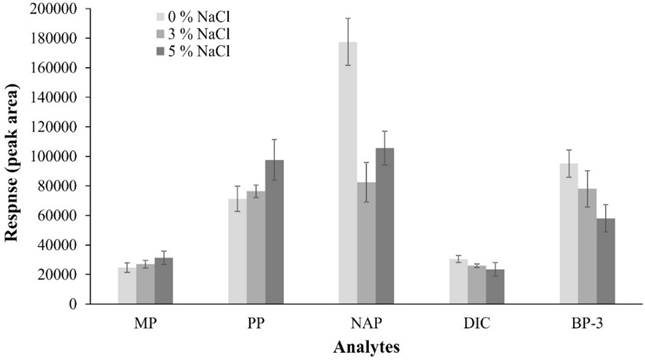
Fig. 6 Effect of NaCl addition on extraction efficiency of PPCPs in extraction optimization (n =3 by experiment).
In aqueous solutions, salt addition increases distribution constant of polar and no-ionized molecules by “salting out” effect and extraction efficiency is increased, as observed with MP and PP, which is consistent with that reported by Canosa et al. [48]. On the other hand, when extracted molecules are ionic, a decrease in extraction efficiency is observed because activity coefficient of species increases as ionic strength of solution increases [49]. Probably, this phenomenon occurs with NAP and DIC, because extraction efficiency was favored when salt in solution decreased since a fraction of these compounds must be present in their ionic form due to their pKa values (4.30 and 4.20, respectively). These results are consistent with those reported by Zhang et al. [50], who in NAP and DIC recovery using hollow fiber liquid-phase microextraction technique observed that salt addition decreased extraction efficiency of said drugs; therefore, they decided not to add NaCl to samples.
On the other hand, when salt is added to aqueous solutions of nonpolar solutes, solubility of these decreases and viscosity and density of solutions increase, diffusion of analytes toward SPME fiber decreases, this process has a more obvious effect when it comes to nonpolar molecules because their solubility is reduced, as reported by Zhao et al. [46]. This phenomenon may be reason of BP-3 results because is most hydrophobic analyte (log P: 4.0) compared with the others, since was observed that amount of analyte extracted increased when amount of salt added to sample decreased. In this way, Canosa et al. [48] reported this behavior when they added NaCl to a parabens mixture, extraction of butylparaben (log P: 3.5) decreased considerably, while extraction of ethylparaben (log P: 2.4) and propylparaben (log P: 2.9) increased because these molecules are most polar. In addition, to work without salt in extraction solution can be a favorable factor for fiber durability because it has been reported that one of disadvantages of using salts in DI-SPME is that they can be deposited on fiber, depending of salt type and coating type [51]. According to our results, it was decided not to add NaCl to extraction solutions, considering that DIC was the least favored analyte in extraction process but it shows a greater response without salt in extraction solutions. In summary, extraction conditions established were 8 mL of extraction solution, laboratory temperature (21-22 °C), and 800 rpm of stirring rate, no salt added and extraction time of 15 min.
Optimization of desorption conditions
As in extraction, initially most important factors affecting system were screened to find highest efficiency in desorption; for this an experimental design that consisted of a randomized full factorial design 23 without central points was applied. The factors studied were solvent type (water/methanol and buffer/methanol), solvent proportion (80:20 and 70:30) and desorption time (10 and 30 min), which are summarized in Table 3. Desorption volume was set at 0.3 mL to achieve total immersion of 2 cm of the generated coating. These factors were evaluated at two levels coded as high (+) and low (-) for continuous variables and at two levels (1 and 2) for categorical variables, performing eight experiments, design was assisted with the Statgraphics Centurion XVII program. To assess effect and significance of factors, coefficient plots were constructed in same way as on extraction optimization. To measure and compare the peak areas, we worked with standard aqueous solutions of 2 µg mL-1 and extraction conditions were kept constant, which were obtained from extraction optimization stage. All experiments of conditions to optimize at desorption were analyzed by HPLC with Gradient II.
Table 3 Experimental factors evaluated in desorption stage.
| Desorption factors | ||
|---|---|---|
| Factor | Value | Code |
| Solvent type | Water/methanol | 1 |
| Buffer/methanol | 2 | |
| Solvent proportion | 80:20 | 1 |
| 70:30 | 2 | |
| Time | 10 | Low (-) |
| 30 | High (+) | |
Complete desorption of analytes from fiber is important to improve reproducibility and sensitivity of method. Correct selection of solvent must ensure greatest analytes recovery from extractant phase, solvent combinations with greater elution strength, in general, is beneficial for this purpose [52]. In addition, solvent volume is a vital factor because a large volume increases efficiency but decreases ability to concentrate the sample [20].
As can be seen in coefficient plots of Fig. 7(a), solvent type (water/methanol and buffer/methanol mixtures) was a factor that had a significant effect in NAP response, for other analytes no difference was found. When reviewing all the experiments of the design, it was observed that a higher solvent proportion (70:30) generated high recoveries for all analytes, except for DIC. Because a greater quantity of methanol increases elution force of the solution, allowing greater analyte recoveries [53] it was decided to select a solvent proportion of 70:30 for subsequent studies.

Fig. 7 (a) Coefficient plots for standardized effect of factors solvent type (ST), solvent proportion (SP) and desorption time (DT); evaluated in optimization of PPCPs desorption and (b) Contour plots obtained for predictive values of solvent type and desorption time in optimization of PPCPs desorption.
On the other hand, time factor had a significant effect only on BP-3 response. Therefore, only factors to optimize were solvent type and desorption time. As first point for optimization of these factors, prediction tests were carried out, which consisted of a two-factor modeling test and contour plots of these experiments were generated with Modde 12.2 program. In contour plots of Fig. 7(b), predictive values of time factor to maximize analyte responses were between 10 and 30 min.
In same plots, it can be seen that predictive values about desorption solvent type, water/methanol mixture maximizes response of MP, NAP and DIC; buffer/methanol mixture maximizes PP response; while for BP-3, mixture used to increase response was indistinct. Because of previous results, it was decided to optimize desorption time (10, 20 and 30 min) and solvent type (water/methanol and buffer/methanol) using a factor-by-factor design, six assays with triplicates, performing 18 experiments. In time optimization experiments, chromatographic peak areas of all compounds increased significantly with increasing desorption time. Desorption process is also a kinetic phenomenon, if a prolonged contact time exist between extractant phase and desorption solution, greater amount of analytes recovered [54], so 30 min was selected as desorption time. On the other hand, to 30 min highest responses were obtained with water/methanol mixture respect to buffer/methanol desorption mixture, although there was only significant difference in NAP and DIC responses. This behavior can be attributed to fact that presence of buffer (pH 4) in the other desorption solution decreases affinity of molecules toward this solution, explained by the different pKa values of different studied molecules, which causes there to be electrostatic repulsion between molecules and desorption solution [55]. Therefore, water/methanol mixture was selected as desorption solvent. In summary, selected desorption conditions were 0.3 mL of water/methanol mixture (70:30) for 30 min.
Comparison of extraction efficiency and fiber reproducibility
Under optimal extraction and desorption conditions, extraction efficiency between fibers of same and different batches was compared, using standard solutions at different concentrations and an analysis of variance was carry out for results obtained with a level of significance of 95 %. The experiments within same batch were evaluated at concentrations of 0.5, 1.5 and 3.0 μg mL-1, one-batch of fibers per concentration and three fibers per batch. In all cases p-values (probability) >0.05 in variance analysis were obtained, which indicates that there is no statistically significant difference in extraction efficiency between fibers of each of batches at concentrations evaluate. Similarly, experiments between different batches were perform forming a single group constituted of one fiber from each batch per concentration and three batch were evaluated at concentrations mentioned above. In variance analysis, a p-value equal to 0.983 was obtained, which indicates that there is no statistically significant difference in extraction efficiency between fibers of different manufacturing batches.
To investigate extraction efficiency reproducibility, data obtained from previous experiments were evaluated and % RSD of responses obtained was calculated. Reproducibility within fibers same batch was between 2.05 and 9.31 % RSD values, while reproducibility between fibers of different batch presented % RSD values between 2.40 and 12.5. In general, highest % RSD values were obtained in responses obtained when comparing efficiency between fibers of different batches; however, all values were less than 15 %, which indicates a good reproducibility not only between fibers of same batch but also between fibers of different batches [56]. This also agrees with results of Shi et al. [19] because they mention that reproducibility from fiber-to-fiber was between 5.5-16 %, for a fiber manufactured in laboratory based on 1-hexyl-3-methylimidazolium tris (pentafluoroethyl) trifluorophosphate. On the other hand, Cui et al. [18] report fiber-to-fiber repeatability values lower than 11.2 % for a fiber developed in laboratory based on 1-octyl-3-methylimidazolium hexafluorophosphate. In our work, although there is variability in responses obtained, these are not wide and may be mainly due to variation in home-made fiber manufacturing and to multiple parameters that are controlled in SPME process, which in both cases are controlled exclusively by the analyst.
Method validation of SPME by direct-immersion
Analytical performance of the proposed method was evaluated, under the extraction and desorption conditions selected as optimal and validation parameters included were linearity, precision, accuracy and detection and quantification limits. In this experimental section, we followed methodology reported by Portillo-Castillo et al. [39] in a work carried out within our working group. Calibration curves by external standards were constructed for evaluation of analytical performance in concentration range of 0.5 to 15 μg mL-1 for all analytes. A summary of results is given in Table 4. The proposed method shows adequate linear relationship between peak areas and all range of tested PPCPs concentrations, coefficients of determination (R2) within 0.996-0.998 for all analytes were obtained. The method precision was evaluated using % RSD of analyte response at each concentration level of calibration curve, values were less than 5 % at all evaluated levels within analytical runs for all analytes, which is indicative of good precision; therefore, method is capable of generating same result in different measurements made under the same conditions. As an approach for accuracy, correlation analysis was carried out between concentration obtained for each calibration standard by using linear equation from regression analysis and real concentration. According to this model, method presented acceptable accuracy since for all analytes values of R2 >0.99 with slope values close to 1 were obtained. Moreover, for each back-calculated standard concentration, percentages of recovery were between 86.8-113.2 %, deviations from nominal value were lower than 15 %; which is indicative of a good accuracy, therefore, this method has ability to yield values with close proximity to true values of investigated analytes. The LOD and LOQ were in a rage of 0.023-0.079 μg mL-1 and 0.070-0.279 μg mL-1, respectively. Lower detection and quantification limits were obtained for MP, PP and BP-3, this suggests that there is a greater number of interactions or a greater affinity of these analytes toward extractant phase developed in comparison with DIC and NAP, under evaluated conditions. These data demonstrate that method based on developed fiber has great potential in extraction and determination of PPCPs included in this work.
Table 4 Analytical performance of DI-SPME method for quantitative analysis of selected PPCPs.
| Analyte | Linearity | Precision | Accuracyc | LOD | LOQ | |||
| Equation a | R 2 | % RSD b | R 2 | slope | % R d | (μg mL-1) | (μg mL-1) | |
| MP 257 nm | y = 13175x - 457 | 0.996 | < 3.17 | 00.996 | 0.000 | 88.4-110.7 | 0.046 | 0.139 |
| PP 257 nm | y = 51627x - 1323 | 0.996 | < 4.05 | 00.996 | 0.000 | 89.3-109.5 | 0.039 | 0.118 |
| NAP 232 nm | y = 177584x - 10089 | 0.996 | < 3.06 | 00.996 | 0.000 | 87.3-112.5 | 0.093 | 0.279 |
| DIC 280 nm | y = 25114x + 11643 | 0.997 | < 2.15 | 00.997 | 0.000 | 86.9-113.2 | 0.079 | 0.237 |
| BP-3 290 nm | y = 66488x + 31886 | 0.998 | < 2.48 | 0.998 | 0.000 | 94.6-105.4 | 0.023 | 0.070 |
a Linearity range: 0.5-15 μg mL-1
b % RSD of response
c Accuracy was obtained by a back-calculated process
d % R = recovery
Preliminary exploration of method applicability: water samples analysis
As a first approach, to evaluate applicability of DI-SPME method for PPCPs analysis with the developed fiber based on DMIM-BF4 and UHU®, potable water samples from supply chain of several municipalities of Monterrey Metropolitan Area of Nuevo León, México, were analyzed. Recovery and precision experiments were performed on spiked samples at 1.5 μg mL-1 to evaluate accuracy and repeatability of method, respectively.
With recovery assays, possible matrix effect that sample can have on developed methodology was evaluated and results obtained for each sample are presented in Table 5. The recovery percentages found in samples were between 3.39-183.29%. In all samples, highest recovery values were found for MP or PP, followed by BP-3, then NAP and lowest values were found for DIC. Low results found in recovery assays may indicate a possible effect of sample matrix, which was very evident for NAP and DIC, because recoveries were found between 45-58% and 3-36%, respectively. This effect was evident when comparing chromatographic peak areas obtained in method validation and chromatographic areas obtained in analysis of samples; peak areas obtained in validation were larger because in this experiment we worked with standards prepared in deionized water subjected to extraction process and not in sample matrix. Having found a matrix effect in analyzed samples implies that construction of calibration curves in sample matrix or calibration by standard addition is required for subsequent studies, as recommended by Dashtbozorgi et al. [57] and Trujillo-Rodríguez et al. [58], to perform an accurate quantification of the analytes.
Table 5 Results obtained from PPCPs analysis in water samples using the manufactured fiber.
| Samplesa | Analytes | |||||||||
|---|---|---|---|---|---|---|---|---|---|---|
| MP | PP | NAP | DIC | BP-3 | ||||||
| %R b | %RSD c | %R b | %RSD c | %R b | %RSD c | %R b | %RSD c | %R b | %RSD c | |
| Monterrey (M1) | 118.89 | 10.69 | 97.54 | 9.11 | 52.79 | 5.24 | 9.78 | 14.44 | 110.59 | 13.63 |
| Monterrey (M2) | 179.16 | 4.70 | 154.06 | 4.22 | 57.84 | 3.79 | 27.42 | 15.48 | 88.01 | 4.28 |
| Monterrey (M3) | 110.88 | 9.41 | 112.15 | 11.79 | 47.56 | 4.00 | 19.86 | 15.77 | 86.02 | 5.86 |
| San Nicolás (M4) | 114.60 | 6.58 | 116.63 | 8.68 | 45.78 | 2.56 | 3.39 | 16.40 | 89.76 | 6.55 |
| Guadalupe (M5) | 107.23 | 4.29 | 104.93 | 4.02 | 50.25 | 2.05 | 21.51 | 13.68 | 78.89 | 4.39 |
| Apodaca (M6) | 148.15 | 6.92 | 144.94 | 1.51 | 55.72 | 2.32 | 35.40 | 6.41 | 92.74 | 3.36 |
| Monterrey (M7) | 104.36 | 8.74 | 106.81 | 10.20 | 48.60 | 4.40 | 10.37 | 15.34 | 79.99 | 4.88 |
| Escobedo (M8) | 103.03 | 5.03 | 102.05 | 3.69 | 49.48 | 1.30 | 16.90 | 15.57 | 80.35 | 5.76 |
| García (M9) | 127.84 | 4.42 | 116.99 | 6.87 | 48.78 | 1.79 | 3.41 | 16.59 | 67.51 | 1.60 |
| Santa Catarina (M10) | 183.29 | 6.95 | 158.37 | 10.50 | 55.50 | 2.17 | 27.42 | 13.08 | 76.30 | 6.27 |
a n = 3, spiked to 1.5 μg mL-1, b % R = recovery, c % RSD = repeatability
Regarding to precision assays, % RSD for all analytes were less than 15 %, except for DIC. % RSD values for MP were between 4-11 %, for PP 3-12 %, for NAP 1-6 %, values for BP-3 were in range 1-14 %, while percentages for DIC were between 6-17 %. % RSD values are very different among each of analytes due to physical and chemical characteristics of each of them and to matrix effects that were found in samples. However, although recoveries for some analytes are not satisfactory, these results demonstrate an adequate repeatability of proposed method for PPCPs analysis in water samples.
In the same way, extractions were performed on samples without PPCPs and no signal corresponding to any of analytes was found, Fig. 8(a) shows a typical chromatogram obtained after extraction of a sample without PPCPs using the developed fiber. At the same time, a typical chromatogram obtained after extraction of a spiked sample at 1.5 μg mL-1 is shown in Fig. 8(b), where chromatographic peaks corresponding to each of added analytes can be seen and UV spectra from each of them.

Comparison with other coatings
Various methods have been developed using commercial SPME fibers of different composition for determination of divers PPCPs [59, 60]. However, some disadvantages of SPME are associated with high-cost of fiber and difficult to prepare in a typical laboratory. To overcome these problems, alternative materials have been proposed for support and coating of laboratory-made SPME fibers [9-11]. Based on this, proposed fiber was compared with previously reported laboratory-made coatings for PPCPs extraction by DI-SPME in water samples following by HPLC-UV analysis.
Wan Ibrahim et al. [61], prepared a coating fiber with multi-walled carbon nanotubes, agarose, and chitosan for nonsteroidal anti‐inflammatory drugs extraction. They found recoveries for NAP and DIC between 89-105 %. The recoveries found in our work are lower that range reported by these authors. However, manufacturing your coating requires longer preparation time (>49 h) and large reagents amounts are used, while preparing our fiber takes short time and little amount of reagents. On the other hand, a fiber made of double confined polymeric ionic liquids for UV filters extraction; showed recoveries between 98-118 % for BP-3 [62]. The recoveries found in our work are generally lower, nevertheless, polymerization process that they used to obtain coating is laborious and involves a long time. Moreover, to bond coating on fiber an expensive device is used (UV camera) and takes more than 2 h. In our work, the new fiber was prepared by a simple and fast method, because immersion of metallic support causes that material was deposited in short time and no costly and sophisticated devices are needed. Besides, amount of adhesive and IL to achieve coating is very little, in addition; this mixture can be reused up to 3 times to produce other fibers, making it an economical process.
On the other side, is important to mention that works previously described were focused on analysis of molecules within same class of PPCPs, such as non-steroidal anti‐inflammatory drugs and UV filters. The analytes studied in our work belong to different classes of PPCPs and are analyzed in the same analytical run. The new fiber coating has some disadvantages, such as short lifetime, can be an inexpensive and attractive alternative to commercial and laboratory-made fibers to monitoring some PPCPs. Furthermore, this work is the first report about use of DMIM-BF4 as a coating for SPME fibers and its potential application in SPME by direct-immersion. Even, this ionic liquid can serve as base for development of new coatings or extractant phases for other techniques.
Conclusion
In this work was possible to manufacture an SPME fiber with metal support coated with a mixture of DMIM-BF4 and a commercial adhesive, through an economical, simple and fast technique. Until now, no report has been found where this IL has been used as an SPME fiber coatings and its application in direct-immersion modality. The fiber showed good stability, good adhesion, and coating uniformity, with an average thickness of 7.12 μm. The new coating exhibits strong interactions with hydrophobic compounds; coating composition provides a high capacity for extraction of PPCPs such as methyl and propylparaben, naproxen, diclofenac and benzophenone-3 in SPME by direct-immersion. The fiber was stable, but a decrease of its extraction capacity was observed by performing three consecutive extractions with same fiber. However, no statistically significant difference was observed in analysis of efficiency and reproducibility of extraction between fibers of same batch and fibers of different batches of fabrication. In addition, a direct-immersion SPME coupled to HPLC-DAD method was developed and validated for analysis of methylparaben, propylparaben, naproxen, diclofenac and benzophenone-3, which proved to be linear, precise and accurate, this method can be a good option for the PPCPs analysis. In an approximation to fiber applicability, established method was used to analysis of water samples and no signal of the target analytes was found. Although, the proposed method does not offer high sensitivity for determination of PPCPs, reduced extraction time, cost and makes SPME fibers more accessible to assay labs. The new SPME fiber is an economical alternative to commercial fibers or it can be starting point for development of other fibers.

