


 text new page (beta)
 English (pdf)
 Article in xml format
 Article references
 Send this article by e-mail
 Cited by SciELO
  Similars in
SciELO
Similars in
SciELO 
 Permalink
Introduction
Phthalates (PAEs) form a large group of compounds that are obtained by esterification of benzene-1,2-dicarboxylic acid; more than sixty different PAEs have industrial applications where they confer flexibility, workability and durability to a wide range of products. As plasticizers, PAEs can be found in coated textiles, flexible hoses, construction articles and finishing, in various products of personal care and in food packing materials. Due to their extensive and widespread uses, phthalates are ubiquitous environmental contaminants and they are also present in foods [1,2]. Several phthalates have been classified as endocrine disruptors [3] and the following six are considered priority pollutants by the United States Environmental Protection Agency (USEPA): dimethyl phthalate DMP, diethyl phthalate DEP, di(n-butyl) phthalate DBP, benzyl butyl phthalate BBP, di(2-ethylhexyl) phthalate DEHP, di(n-octyl) phthalate DnOP [4]. In an effort to decrease the use of PAEs, different non-phthalate plasticizers have been introduced, among them di(ethylhexyl) adipate (DEHA) as a substitute for DEHP [5].
Determination of plasticizers, especially PAEs, is an analytical task important in the field of food control with a variety of analytical procedures available. The great majority of studies have been devoted to the assessment of PAEs in water and in beverages whereas analysis of the solid foods, presenting more complex chemical composition, has been less common [6-8]. Of note, much attention has also been paid on the migration of PAEs from the packing materials [6,9]. As often highlighted, a special care is needed to avoid/control sample contamination by phthalates potentially present in air, laboratory material, reagents, solvents and even coming from laboratory personnel [10,11]. The actual state-of-the art in sample preparation has been presented in few comprehensive reviews [6,8,12] yet this is still an active field of methodological development driven by the requirement of selective and efficient extraction of PAEs. While analyzing solid foods, liquid extraction is a convenient approach in which water-acetonitrile mixtures are typically used; other mixtures based on hexane, dichloromethane, chloroform, acetone or acetonitrile may be needed for highly non-polar PAEs in fatty foods; to achieve better efficiency, magnetic stirring, microwave assisted extraction or shaking in the ultrasonic bath have been reported [1,13-19]. As to the instrumental techniques, coupling gas (GC) or liquid (LC) chromatography with mass spectrometry (MS) has been preferentially used [1,8,12,15,16,20]; since the USEPA priority PAEs are semi-volatile and thermostable compounds, gas chromatography seems to be the most appropriate technique for their separation [12,16,21,22]. The use of capillary columns with non-polar phases (polydimethylsiloxane or polymethylphenylsiloxane) has been recommended because they provide good resolution of PAEs thanks to relatively high temperatures and lower bleeding as compared to the polar columns [16,23]. Liquid samples or sample extracts not containing low-volatile interferences can be introduced directly, preferably in splitless mode if determination of low concentrations is required; for more complex matrices, solid phase micro-extraction with headspace has been reported [7,8]. Finally and in relevance with the present work, a triple quadrupole mass spectrometry detector (TQMS) offers advantages of excellent selectivity and high detection power through the use of multiple reaction monitoring (MRM), yet this quantification mode has only recently been introduced to the analysis of phthalates in solid foods [15,16].
In Mexico, maize tortilla is a staple food and this product is also gaining international acceptance. The accumulation of PAEs in maize grain has been demonstrated [17] and additionally, tortillas may become contaminated during their elaboration and during short- or long-term storage. Noteworthy, for consumption on the same day, fresh and hot tortillas are wrapped in paper or in plastic and are often maintained warm for hours; for longer storage, plastic bags are used and the product is left at room temperature with expiration period from weeks up to one year (if vacuum-packed).
In the present work, a GC-MS/MS procedure with MRM quantification is set-up and then applied for the determination of six priority phthalates and DEHA in maize tortillas and flours. Some of the analyzed products contained relatively high concentrations of PAEs (total concentration > 300 μg kg-1) and the rest were moderately contaminated (total phthalates between 50 and 300 μg kg-1 dry mass) [24]. The results obtained strongly suggest that migration of PAEs from packing materials contributes to their content in tortilla.
Experimental
Reagents and samples
Deionized water (18.2 MΩ cm, Labconco, USA), HPLC-grade acetonitrile, hexane and isooctane as well as analytical reagent grade sodium chloride and sodium sulfate anhydride, were from Sigma.
The EPA 506 mix containing six phthalates (dimethyl phthalate DMP, diethyl phthalate DEP, dibutyl phthalate DBP, benzyl butyl phthalate BBP, di(2-ethylhexyl) phthalate DEHP, di(n-octyl) phthalate DnOP) and di(2-ethylhexyl) adipate (DEHA) in isooctane, at 1000 µg mL-1 each, was used for calibration. Specification of the lot number LC05856 purchased from Sigma, are provided in Electronic Supplementary Material (Table 1S).
Maize tortilla (T1 - T15) were purchased during summer 2016 at randomly selected markets in Guanajuato city and its vicinity (Guanajuato State, Mexico). These products included long shelf-life tortillas packed in plastic bags, fresh tortillas commercialized this same day still warm or at ambient temperature and wrapped in plastic or paper (Table 1). In each case, three tortillas were pooled after eliminating the first one which was in a direct contact with the packing material. Additionally, three commercial maize flours (F1, F2, F3) were also purchased in the local supermarket.
Table 1 Descriptive variables of the analyzed tortilla samples.
| Brand | PM1 | t2 | T3 | Brand | PM1 | t2 | T3 |
|---|---|---|---|---|---|---|---|
| 1 | -1 | -1 | 1 | 9 | -1 | -1 | 1 |
| 2 | 1 | 1 | -1 | 10 | -1 | -1 | 1 |
| 3 | 1 | 1 | -1 | 11 | 1 | 1 | -1 |
| 4 | -1 | -1 | 1 | 12 | 1 | -1 | 1 |
| 5 | -1 | -1 | 1 | 13 | -1 | -1 | 1 |
| 6 | -1 | -1 | 1 | 14 | 1 | 1 | -1 |
| 7 | 1 | 1 | -1 | 15 | 1 | 1 | -1 |
| 8 | -1 | -1 | 1 |
1 PM - packing material: (-1) - paper wrap, (1) - plastic bag;
2 storage time: (-1) maximum one day, (1) longer than one day;
3 - storage temperature: (-1) ambient temperature, (1) warmed.
Sample pretreatment
A fresh mass was cut into small pieces, three portions per sample (5 g each) were taken and homogenized independently with 7 mL of acetonitrile:water 1:1 mix (T18 Ultra-Turrax® polytron, IKA®); then 3 mL of saturated sodium chloride solution were added and the extraction with 10 mL of hexane was carried out (vortex, 3 min). The mixtures were centrifuged at 3150 g for 10 min and the upper, organic phase of each sample was transferred to 25 mL glass vial. Traces of water were eliminated by addition of sodium sulfate anhydride (0.5 g), the solvent was evaporated under nitrogen stream and the extract was re-constituted in 500 µL of isooctane. In order to report phthalate concentrations with respect to the dry mass, humidity was assesses by drying 20 g aliquot of each brand of tortilla at 80oC [25]; of note, mean water content calculated for all samples was 44.1 ± 1.2%.
For the analysis of maize flour, 1 g of the sample was taken and processed as described above.
GC-MS/MS analysis
A model Bruker 456-GC gas chromatograph coupled to a SCION TQ mass spectrometer (Bruker Daltonics) with a column BP-5 MS (30 m x 0.25 mm, 0.25 μm film thickness, SGE Analytical Science), were used. The flow rate of helium as a carrier gas was maintained at 1 mL min-1; the injection port was set to splitless with 1 μL injection and 45 s, and maintained at a temperature of 250 °C. The column oven temperature program was: 70 ° initial temperature holding for 2.5 min, then ramping to 250 °C at 30 °C min-1 and holding for 2.5 min and finally ramping to 300 °C at 30 °C min-1 and holding for 2.5 min (total run 15.2 min). Temperature settings for the transfer-line heater and ion source of the MS were 290 °C and 250 °C, respectively. Spectra were acquired in the m/z range 50-500. The energy of electron impact ionization was 70 eV; collision cell was operated at 2 mtorr of argon. For quantification in MRM mode, the conditions are detailed in Table 2; for each compound, the m/z window ± 1 was applied and peak area was acquired as analytical signal. A Bruker MS Workstation 8.0 was used for data collection, processing and GC-MS/MS control. The assignation of individual phthalates was carried out by comparing both, mass spectrum and retention time with those obtained for external standards. Calibration solutions were prepared by appropriate dilution of EPA mix with isooctane to obtain concentrations 25, 50, 100, 250, 500 and 1000 µg L-1 for each compound (blank was always run in parallel). Detection and quantification limits (DL, QL) were evaluated based on signal-to-noise ratio; the criterions of three and ten standard deviations were adopted for DL and for QL, respectively [26]. For each analyte, the signal was obtained for the lowest calibration standard and the noise was evaluated as standard deviation of five MRM blank replicates. Method quantification limit was obtained in the same manner but in the presence of sample matrix (20 times diluted T1 extract).
For recovery experiments, 200 µL and 1000 µL of standard mix (500 µg L-1) were added to the T1 sample yielding the concentration of standard in tortilla 20 µg kg-1 and 100 µg kg-1 of each compound, respectively.
Table 2 Summary of multiple reaction monitoring (MRM) conditions selected for the determination of six phthalates and for and di(2-ethylhexyl) adipate (DEHA).
| Analyte | tret±SD, min |
Time segment, min |
Ion transitions1 m/z |
CID energy, eV |
|---|---|---|---|---|
| DMP | 7.40 ± 0.08 | 6.0 - 7.90 | 163/133 (194/163) |
10 |
| DEP | 7.98 ± 0.07 | 7.47 - 8.53 | 149/121 (177/149) |
15 |
| DBP | 9.43 ± 0.08 | 8.53 - 9.93 | 149/121 (205/149) |
15 |
| BBP | 11.89 ± 0.09 | 9.93 - 12.39 | 149/121 (206/149) |
15 |
| DEHA | 11.94 ± 0.08 | 11.40 - 12.44 | 129/111 (129/57) |
5 |
| DEHP | 12.72 ± 0.06 | 12.20 - 13.22 | 149/121 (167/149) |
15 |
| DnOP | 13.69 ± 0.09 | 13.13 - 14.20 | 149/121 (279/149) |
15 |
1 m/z values for precursor and quantifier ions (precursor/qualifier ions)
Contamination control
All standards and solutions were prepared and kept in flasks or vials made of glass. Glassware and metal scissors (for cutting tortillas) were washed with a soap and warm water and always wrapped in aluminum foil. Deionized water was extracted with hexane prior to its use. It was intended to perform all operations in a short time and to keep all sample/solutions containers closed or under nitrogen stream; the personnel used disposable phthalate-free vinyl gloves. Polypropylene micropipette tips were rinsed with hexane upon the use. Blank was always run in parallel and analyses were repeated if high concentrations of PAEs in blank were found. The obtained results were blank-corrected.
Statistical analysis
The results presented are means obtained for three independent replicates, standard deviations were calculated using Microsoft Excel 2010. Principal component analysis (PCA) was carried out using Unscrambler 7.0 software package (Camo, Norway). Significance level was established at p<0.05.
Results and Discussion
Set-up of GC-MS/MS procedure
For the selection of GC-MS and MRM conditions, EPA 506 mix was diluted with isooctane yielding 500 μg L-1 of each compound in working solution. Typical capillary column for GC-MS was used; specifically, BP5-MS column presents low bleeding, its 5% phenyl polysilphenylene-siloxane film provides non-polar character and, it can be used in a wide temperature range (-40 - 330 oC). Separation conditions were tested in a full scan mode for m/z range 50-500, by varying temperature gradient and He flow rate with the intent to obtain baseline separation of seven compounds in a relatively short time. Finally, selected conditions are presented in the Experimental section and the retention times for individual solutes are listed in Table 2 (total chromatographic run 15.2 min). The chromatographic signals were assigned based on mass spectra of individual compounds (NIST library, version 2.0, 2011). The experimental and library spectra are shown in Fig. 1S (Electronic Supplementary Material, ESM). Using 70 eV energy for electron-impact ionization, the most intense ions were selected as precursors for MRM quantification; these were: m/z 149 for DEP, DBP, BBP, DEHP and DnOP, m/z 163 for DMP and m/z 129 for DEHA. The second, qualifier precursor ion for each compound was that of the second most intense signal in respective mass spectrum (Table 2, Fig. 1S). A range of collision energies (5-25 eV) was examined in search to attain the highest possible abundance of suitable for MRM product ions; the selected ions and CID energies are summarized in Table 2. In this Table, time segments of chromatogram used for signal acquisition of individual compounds are also listed. As already commented in the Introduction, MRM technique has not been in common use in the analysis of phthalates in solid foods [15,16] and, to the best of our knowledge, it was only recently applied for GC-MS/MS determination of DBP, BBP and DEHP [16]. In the cited work, precursor ions applied for DBP and BBP were the same as listed in Table 2; however, for DEHP m/z 149 was not considered due to the co-elution problem which was not observed in the present work. On the other hand, the US Consumer Safety Commission, establishes the GC-MS procedure for the determination of phthalates in selective ion monitoring mode (SIM), recommending the sum of several signals, in order to increase the detection power (m/z 194, 135, 77 for DMP; 177, 76, 105 for DEP, 149, 167, 205, 223 for DBP, 149, 167, 279 for DEPH; 149, 167, 261, 279 for DnOP) [27]. The clear benefit of MRM is that the transition between precursor and product ions provides significant improvement of S/N value with respect to SIM, especially when SIM integrates several signals for one compound.
Using the established conditions, calibration was carried out as described in the Experimental section. The linear regression functions, linearity and repeatability parameters are presented in Table 3. As can be observed, R2 > 0.999 was always obtained and repeatability for slope and intercept were in the range 1.4 - 3.8% and 3.4 - 16%, respectively, based on three independent replicates of calibration process. Furthermore, relative standard deviation of the calibration factors (CF: signal-to-concentration ratio) was calculated based on all replicates of individual calibration standard for each analyte and the obtained values (2.1 - 6.9%) were lower than 20%, in agreement with USEPA indication for chromatographic analyses [28]. To evaluate possible effect of chemical matrix on ionization efficiency, calibration was also performed in the presence of sample matrix (2-fold diluted T1 extract). In Table 3, signal suppression/enhancement (SSE) calculated as the ratio between slopes of linear regression functions obtained in the presence and in the absence of sample matrix is presented for each compound; the obtained values were in the range 82.9 - 104%, indicating that the sample matrix had only minor effect on the analyte ionization efficiency [29]. The evaluated detection limits of calibration were as follows: 2.62 μg L-1 DMP, 2.56 μg L-1 DEP, 3.16 μg L-1 DBP, 2.78 μg L-1 BBP, 1.33 μg L-1 DEHA, 2.45 μg L-1 DEHP, 5.31 μg L-1 DnOP. The quantification limit of the method for tortilla were computed based on calibration performed in the presence of the sample matrix (20-fold diluted extract of T1) [26] with the following values obtained: 1.47 μg kg-1 DMP, 1.55 μg kg-1 DEP, 1.92 μg kg-1 DBP, 1.72 μg kg-1 BBP, 0.94 μg kg-1 DEHA, 1.49 μg kg-1 DEHP, 3.21 μg kg-1 DnOP. Of note, in the recent studies focused on the determination of PAEs in solid foods by GC-MS or MS/MS with integrated solid phase extraction, solid phase microextraction or QuEChERS (Quick, Easy, Cheap, Effective, Rugged y Safe) approaches, the quantification limits in the range 0.06 - 43 μg kg-1 were reported [8,16,30], which clearly supports the fit-per-purpose suitability of the proposed here procedure.
Table 3 Calibration parameters evaluated in the absence and in the presence of sample matrix.
| Analyte | Linear regression1 | R2 | RSD(CF)2, % | SSE3, % |
|---|---|---|---|---|
| DMP | Y = 7.37x10⁵(2.10x10⁴) c + 1.71x10³(2.88x10²) | 0.9998 | 4.7 | 95.1 |
| DEP | Y = 1.33x10⁷(1.78x10⁵) c + 278(41.3) | 0.9998 | 2.1 | 97.2 |
| DBP | Y = 1.72x10⁶(2.44x10⁴) c + 2.65x10⁴(1.19x10³) | 0.9999 | 2.7 | 98.5 |
| BBP | Y = 7.12x10⁵(2.24x10⁴) c + 4.41x10³(1.60x10²) | 0.9991 | 5.9 | 93.9 |
| DEHA | Y = 1.47x10⁷(5.01x10⁵) c + 3.28x10⁴(1.97x10³) | 0.9993 | 6.9 | 82.9 |
| DEHP | Y = 6.73x10⁶(2.55x10⁴) c + 754(30.1) | 0.9997 | 3.7 | 102 |
| DnOP | Y = 6.75x10⁵(1.79x10³) c + 6.56x10³(2.66x10²) | 0.9994 | 5.3 | 104 |
1 Matrix-free calibration function based on three independent replicates : Y - signal measured as the peak area in MRM mode; c - analyte concentration, μg L-1; in the parentheses standard deviation for slope and intercept are given [28].
2 Relative standard deviation of the calibration factors (CF = Y/c) obtained for all replicates of individual calibration standards [28].
3 Signal Suppression/Enhancement calculated as the ratio between slopes of linear functions obtained in the presence of sample matrix and for matrix-free calibration [37].
For accuracy testing, T1 sample was analyzed using two-point standard addition. As described in the Experimental section, standard mix was added directly to the sample yielding 20 μg kg-1and 100 μg kg-1 of each compound (100 μg L-1 and 500 μg L-1, respectively, in the solution introduced to GC-MS/MS system). The MRM chromatograms obtained in this experiment are presented in Fig. 1. For each analyte, the signals obtained in the sample without standard addition and this same sample spiked with two different concentrations are presented. Additionally, the signal obtained for matrix-free calibration solution (250 μg L-1 of each compound, except 500 μg L-1 DEHP) and for blank, are also included. The respective quantitative results are presented in Table 4; percentage recoveries in the range 75.5 - 129% for 20 μg kg-1 standard addition and 74.0 - 100% for 100 μg kg-1, are indicative of acceptable accuracy [28]. Noteworthy, similar or poorer recovery results had been previously reported for phthalate determination if foods [15,16,31].
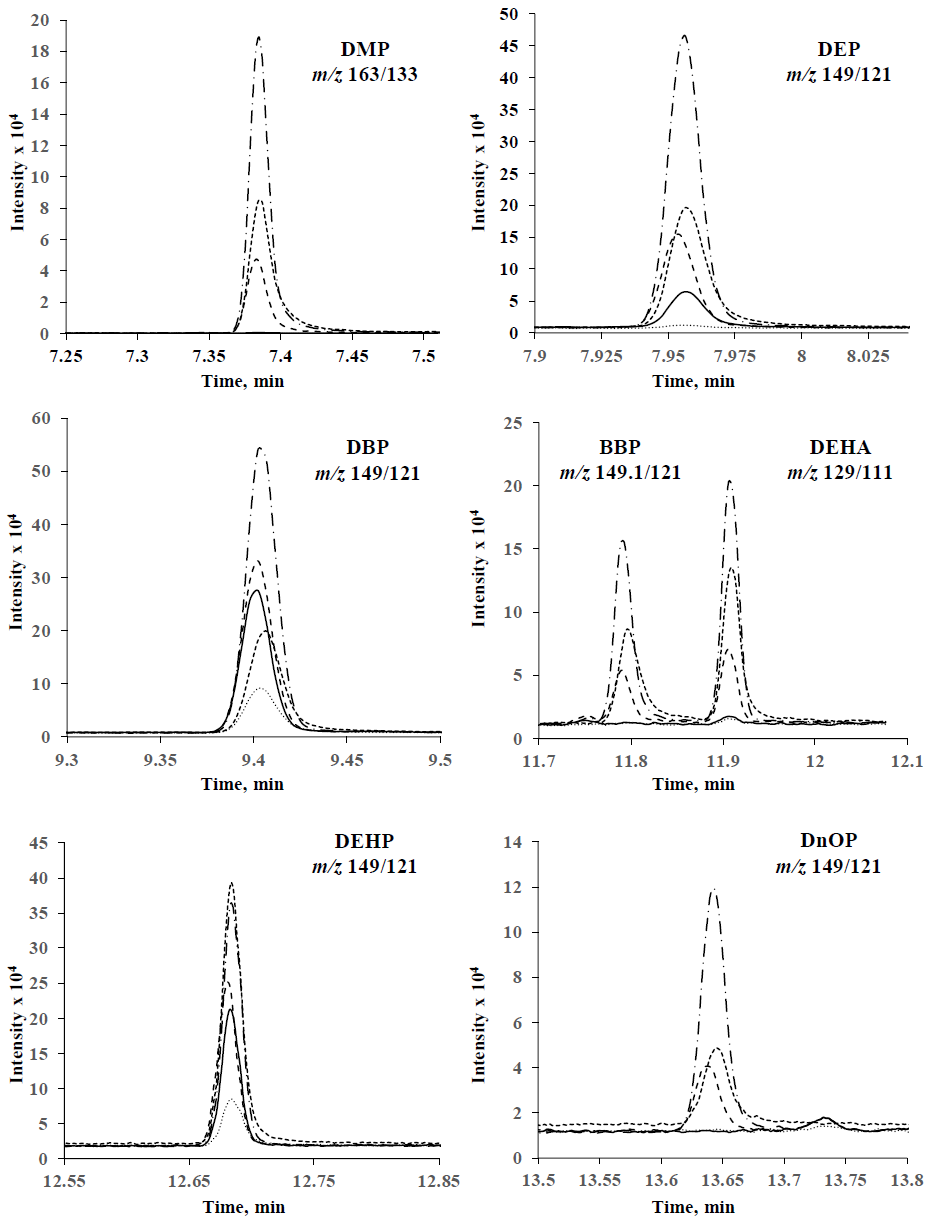
Fig. 1 Typical GC-MS/MS chromatograms obtained in MRM mode for individual compounds in: (……) standard solution containing 250 μg L-1 of each compound, except 500 μg L-1 DEHP; (_____) T1 sample; (-----) T1 spiked with 20 μg kg-1 of each compound (100 μg L-1 in the on-column injected solution); (_._._) T1 spiked with 100 μg kg-1 of each compound (500 μg L-1 in the on-column injected solution); (****) blank.
Table 4 Results of recovery experiment carried out for T1 sample.
| Analyte | Mean concentration ±SD, μg kg-1 | Recovery, % | |||
|---|---|---|---|---|---|
| No standard added |
20 μg kg-1 added |
100 μg kg-1 added |
20 μg kg-1 added |
100 μg kg-1 added |
|
| DMP | nd | 22.3 ± 0.9 | 100 ± 8 | 111 | 100 |
| DEP | 17.8 ± 1.9 | 32.9 ± 1.8 | 108 ± 10 | 75.5 | 90.2 |
| DBP | 56.2 ± 2.0 | 72.5 ± 3.1 | 136 ± 7 | 81.5 | 79.8 |
| BBP | nd | 18.9 ± 1.5 | 90.6 ± 6.5 | 94.5 | 90.6 |
| DEHA | nd | 19.3 ± 1.2 | 81.2 ± 2.9 | 96.9 | 81.2 |
| DEHP | 24.9 ± 2.1 | 50.7 ± 1.7 | 120 ± 4 | 129 | 95.1 |
| DnOP | nd | 16.9 ± 1.6 | 74.0 ± 2.3 | 84.5 | 74.0 |
nd - not detected, means and standard deviations based on three replicates.
Determination of phthalates in maize tortillas and flours
The results obtained for fifteen commercial samples, are presented in Table 5. Beyond any doubt, DEHP (71.6 - 420 μg kg-1 dry mass), DBP (nd - 274 μg kg-1) and DEP (nd - 73.2 μg kg-1) were found as the most abundant phthalates and this finding is in agreement with studies performed on other food items in Europe (Belgium, UK, Portugal), Asia (China, Korea) and North America (Canada, USA) [24]. On the other hand, DMP was not detected in any sample, while BBP was found only in one type of tortilla and DnOP in two samples. As for total phthalates, the decreasing order of contamination was as follows: T13 (604 μg kg-1) > T4 (551 μg kg-1) ≈ T8 (544 μg kg-1) > T3 (494 μg kg-1) > T2 (449 μg kg-1) ≈ T12 (436 μg kg-1) > T11 (334 μg kg-1) > T5 (227 μg kg-1) ≈ T10 (215 μg kg-1) > T7 (202 μg kg-1) ≈ T15 (202 vg kg-1) > T9 (169 μg kg-1) ≈ T14 (165 μg kg-1) > T6 (144 μg kg-1) > T1 (98.9 μg kg-1). It should also be mentioned that DEHA, which is another type of plasticizer, has been found and determined in nine samples, covering the concentration range of 2.92 - 197 μg kg-1 dry mass. Among the analyzed samples, the first six could be classified as foods of high total phthalate content (> 300 μg kg-1), according to the recent classification proposed by Serrano et al. [24]. In the cited review article, total PAEs concentration < 50 μg kg-1 corresponded to low phthalate content, 50 - 300 μg kg-1 range was assigned to medium contamination and food containing more than 300 μg kg-1 of total PAEs, was considered highly contaminated. Fatty food products such as poultry, cheese, cream or vegetable oil were reported as susceptible for accumulation of relatively high PAEs concentrations whereas for plants and grains - derived foods, lower concentrations were informed [24]. It should be stressed however that the determination results varied not only among different food items, but also among different geographical regions; as an example, DMP and DEP were the most common PAEs reported in China food [18] whereas in USA the most abundant phthalates were DEP and DEHP [32].
Table 5 Determination of phthalates and di(2-ethylhexyl) adipate in tortilla (T1-T15) and maize flour (F1-F3) samples. Mean values of concentrations are given with respective standard deviation based on three independent replicates. DMP was not detected in any sample.
| Brand | Mean value ± SD, μg kg-1 (dry mass) | ||||||
|---|---|---|---|---|---|---|---|
| DEP | DBP | BBP | DEHA | DEHP | DnOP | Σ | |
| T1 | 17.8 ± 1.9 | 56.2 ± 2.0 | nd | nd | 24.9 ± 2.1 | nd | 98.9 |
| T2 | 73.2 ± 4.5 | 41.1 ± 2.5 | nd | 57.1 ± ± 2.3 | 277 ± 21 | nd | 449 |
| T3 | 62.4 ± 2.9 | 44.4 ± 1.9 | 21.3 ± 1.6 | nd | 365 ± 25 | nd | 494 |
| T4 | 12.1 ± 0.8 | 92.8 ± 7.7 | nd | 197 ± 14 | 249 ± 14 | nd | 551 |
| T5 | 15.6 ± 1.2 | 29.3 ± 1.4 | nd | 15.7 ± 0.9 | 166 ± 13 | nd | 227 |
| T6 | 4.60 ± 0.07 | 27.2 ± 3.1 | nd | nd | 112 ± 9 | nd | 144 |
| T7 | 6.12 ± 0.44 | 55.1 ± 1.4 | nd | 56.4 ± 1.7 | 84.1 ± 5.7 | nd | 202 |
| T8 | 62.8 ± 3.8 | 231 ± 17 | nd | nd | 250 ± 21 | nd | 544 |
| T9 | 4.90 ± 0.59 | nd | nd | nd | 164 ± 9 | nd | 169 |
| T10 | 12.3 ± 0.5 | 131 ± 11 | nd | nd | 71.6 ± 2.7 | nd | 215 |
| T11 | 6.06 ± 0.16 | 22.4 ± 0.18 | nd | 191 ± 10 | 104 ± 7 | 10.6 ± 0.5 | 334 |
| T12 | 3.38 ± 0.61 | 5.44 ± 0.23 | nd | 3.33 ± 0.21 | 420 ± 30 | 3.99 ± 0.79 | 436 |
| T13 | nd | 274 ± 11 | nd | 61.5 ± 3.8 | 268 ± 18 | nd | 604 |
| T14 | 12.4 ± 0.4 | 58.3 ± 2.9 | nd | 11.8 ± 0.8 | 82.3 ± 3.5 | nd | 165 |
| T15 | 17.6 ± 2.1 | 74.1 ± 4.3 | nd | 2.92 ± 0.23 | 107 ± 8 | nd | 202 |
| F1 | 11.4 ± 1.3 | 35.9 ± 1.8 | nd | nd | 28.1 ± 1.6 | nd | 79.0 |
| F2 | 11.0 ± 0.9 | 30.8 ± 1.1 | nd | nd | 23.4 ± 1.2 | nd | 65.2 |
| F3 | nd | 31.8 ± 1.9 | nd | 20.7 ± 2.1 | 31.3 ± 2.0 | nd | 83.8 |
nd - not detected
Since this is the first study determining phthalate concentrations in maize tortilla, it seemed interesting to compare the results obtained here with PAEs concentrations reported elsewhere for foods elaborated from grains; as can be observed in Table 6, relatively few data were found and these included products based on wheat, buckwheat, rice and maize [16-18,24,32-35]. As already highlighted before, in all cited studies DEHP presented the highest concentrations among PAEs and was followed by DBP and DEP. Tortillas analyzed in the present work contained higher concentrations of PAEs with respect to PAEs estimated in maize grain using algorithm that considered different sources of contamination [35]; however, our results were lower than those reported for maize grain under irrigation with wastewater [17]. In addition to the demonstrated uptake of PAEs by maize plant [17], grain-derived food items may become contaminated during elaboration process and due to migration of phthalates from packing materials [6,9].
Table 6 Selected examples of concentrations reported for priority PAEs in grain-derived foods in comparison with the results of this work.
| Food items | DMP | DEP | DBP | BBP | DEHA | DEHP | DnOP | ref |
|---|---|---|---|---|---|---|---|---|
| Wheat, bread and bread products | 3.27-58.9 NA NA nd-3.2 |
0.35-1.97 NA NA nd-50 |
13.7-572 1.9-41 93.0-232 nd-5130 |
NA 0.6-1.9 NA nd-440 |
NA NA NA NA |
45.7-750 12-536 111-386 nd-3400 |
nd NA NA nd-33.4 |
[18] [16] [38] [24] |
| Cereals and cereal products | NA nd-58.9 NA |
40-2200 nd-2200 NA |
30-1900 nd-2100 7.5-152.4 |
480 nd-530 NA |
100-2200 NA NA |
20-3400 nd-4400 5.0-270.4 |
NA nd-61.4 NA |
[33] [24] [38] |
| Buckwheat pancakes | NA | NA | 1.0 | nd | NA | 9.8 | NA | [16] |
| Pasta, noodles and rice | nd-0.41 nd-90.8 NA |
0.02-1.45 nd-22.4 NA |
1.48-99.0 nd-360 3.6 |
NA nd-63 0.6 |
NA NA NA |
14.0-378 nd-761.6 53.1 |
nd nd-6.1 NA |
[18] [24] [16] |
| Total diet | nd | 9.63 | 23.2 | 12.4 | 1.4-6010 | 14.4-714 | nd | [34] |
| Maize-containing products | NA | NA | 54.2 | 0.7 | NA | 114 | NA | [16] |
| Maize grain | 958* NA |
538* 7.7** |
3099* 21** |
528* 4.7** |
NA NA |
2072* 209** |
4866* NA |
[17] [35] |
| Maize tortilla | nd | nd-73.2 | nd-274 | nd-21.3 | nd-197 | 23.4-420 | nd-10.6 | *** |
| Maize flour | nd | nd-11.4 | 30.8-39.5 | nd | nd-20.7 | 23.4-31.3 | nd | *** |
* cultives irrigated with wastewater;
** concentrations (μg kg-1 fresh mass) estimated by mathematical modelling;
*** results obtained in this work;
NA - not analyzed; nd - not detected.
Tortilla making and storage as potential sources of PAEs contamination
Nowadays, practically all commercialized tortillas are prepared from maize flour. The PAEs concentrations found in three major brands of flour (F1-F3) are presented in Table 5. Overall, the results for the three samples were similar, with DBP (30.8 - 35.9 μg kg-1) and DEHP (23.4 - 31.3 μg kg-1) found as the most abundant phthalates; DMP and DnOP were not detected, DEP was found in two samples (11.0 - 11.4 μg kg-1) and DEHA only in F3 brand (20.7 μg kg-1). Most importantly, total PAEs were generally lower in flour (65.2 - 83.3 μg kg-1) than in tortillas (98.9 - 604 μg kg-1) and these products could be classified as medium contaminated, according to Serrano et al. [24] Concentrations found in the flour samples were similar to those estimated in grain by mathematical modelling (Table 6) [35]. Certainly, maize flour should be considered as one of the PAEs sources related to their content in grain; however, due to the higher concentration and higher variability of total and individual phthalates in tortillas as compared to flour, tortilla making, and storage should be considered as additional sources of contamination. During elaboration, a dough may capture PAEs from the containers and from the surrounding environment, especially when exposed on the conveyor belt. As to the storage conditions, variables such as the type of packing material, time and temperature might affect migration of phthalates from the wrap. As shown in Table 1, these three variables were varying in fifteen samples analyzed. Taking the values of descriptive variables from Table 1 and the concentrations of individual PAEs determined in each tortilla, principal component analysis (PCA) was carried out. This multivariate method is generally considered an unrestricted tool useful to present the structure of data while reducing their dimensionality and it can be applied to any data matrix (independently of physical dimensions of variables) [36]. We performed PCA to detect possible relationships between storage conditions and PAEs content in tortilla. The obtained model is presented in Fig. 2; after elimination of two outliers (T2, T7), two first principal components accounted for 61% of total data variability. The scores and X-loading plots show the distribution of tortilla samples (Fig. 2a) and the distribution of variables (Fig. 2b), respectively, in the bi-dimensional space of two first PCs. As can be observed, PCA model ordered samples according to their PAEs content: from low contaminated T1, T6, T9 to heavily contaminated T3, T13. Indeed, a cluster of three most abundant and total PAEs on X-loading plot is located in the same space as contaminated samples on the scores plots. Considering PC1, variables of time (t) and packing material (PM) are grouped with PAEs concentrations, indicating that long storage time and plastic bags (see Table 1, where plastic bags are annotated as 1 and paper wrap as -1) contribute to tortilla contamination with phthalates. It was expected that keeping tortillas warm in plastic bags should facilitate migration of phthalates; however, temperature seems to be inversely related to other variables (Fig. 2b). As indicated in Table 1, tortillas are kept warm only if they are to be sold at the same day (short time) and if so, they are wrapped in paper (-1 value for PM); that is why PCA model related inversely temperature with time and package. In further studies, the effect of temperature on PAEs migration from packing material to tortilla should be studied in more detail; this aspect is important because for consumption, tortillas are usually heated wrapped. It is also important to emphasize that PCA results are preliminary, and larger series of samples characterized by different descriptive variables (storage time, temperature and packing material) should be included in future work.
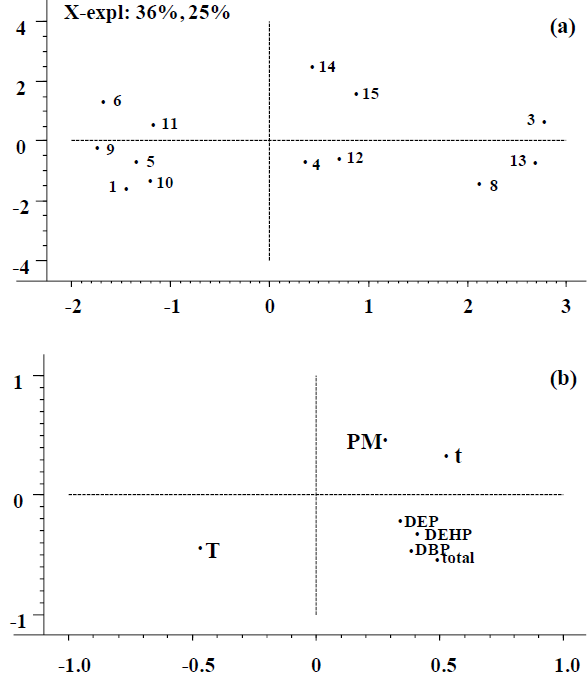
Fig 2 Principal component analysis (PCA) of data characterizing tortilla samples T1-T15: (a) scores plot showing the distribution of tortilla samples and (b) X-loadings plot showing distribution of variables (DEP, DBP, DEHP and total PAEs concentrations; t - storage time; T - storage temperature; PM - packing material, see Table 1), both in the reduced dimensionality of PC1 and PC2.
Conclusions
In this work, phthalate determination in maize tortilla was carried out for the first time. A procedure based on gas chromatography separation and mass spectrometry detection in multiple reaction monitoring mode was set up, yielding method detection limits for six priority PAEs and for di(2-ethylhexyl) adipate in the range 0.94 - 3.21 μg kg-1. Baseline chromatographic separation of the analytes allowed for using these same ion transitions for quantification of DEP, DBP, BBP, DEHP and DnOP providing the highest possible signals magnitude. Fifteen commercial tortilla samples were analyzed and the obtained results indicated medium-to-high contamination with PAEs. The obtained results indicate the following contamination sources: (i) PAEs contained in maize flour; (ii) exposure to phthalates during tortilla making and (iii) migration from packing material which is favored by storage time and usage of plastic bags. Further studies should clarify effect of temperature on PAEs migration from wrap to tortilla.

