


 text new page (beta)
 English (pdf)
 Article in xml format
 Article references
 Send this article by e-mail
 Cited by SciELO
  Similars in
SciELO
Similars in
SciELO 
 Permalink
1. Introduction
Polycarbonate composites are used in a variety of industries, including building, vehicles, aerospace, consumer electronics, and packaging. To determine the applications, it is necessary to analyze the thermal stability, mechanical strength, wear resistance, viscoelastic behavior, and flame resistance of nanoparticles, as well as their topography, size, and dispersion (Charde Sonawane, Sonawane & Shimpi, 2018; Khan et al., 2019). It is based on a series of experiments conducted with sophisticated tools that are both expensive and time intensive. When considering mechanical strength at changing temperatures, thermo-mechanical qualities are one of the critical factors that determine the application of polymer composites (Ghanshyam, Sonawane et al., 2016).
Thermomechanical properties are investigated with the use of a dynamic mechanical analyzer (DMA). These dynamic tests are beneficial in the investigation of polymeric materials' viscoelasticity. It expresses material stiffness and damping as storage modulus and tan delta. It is a measure of the degree of crosslinking between nanoparticles and the polymer matrix, expressed as a glass transition temperature. (Landge et al., 2021). The enhancement of thermomechanical characteristics is dependent on the interaction between matrix and filler, the extent of cross linking, and crystallinity. The storage modulus and damping behavior of the composites have been reported to rise or decrease with the addition of nano-fillers (Ghanshyam et al., 2016a; Ghanshyam et al., 2017).
Polycarbonate composites exhibit a wide range of thermomechanical properties that vary according to the type of nanofiller, organic modifier, composite synthesis method, and processing conditions. According to the literature, polycarbonate clay composites displayed superior qualities when modified with phosphonium salts rather than ammonium salts (Suin, et al. 2013). The dynamic mechanical characteristics of polycarbonate with ammonium modified clay nanofillers synthesized via melt extrusion did not improve (Carrion et al. 2008). Polycarbonate reinforced with nanoparticles of silica produced via melt intercalation was projected to have improved thermo-mechanical characteristics. Due to the existence of hydrogen bonding, the strong interaction between the carbonyl group in the PC and the hydroxide group on silica results in the increase of characteristics. Thus, the effect of silica nanoparticle modification does not result in a significant change in dynamic mechanical characteristics (Luyt et al., 2011). Additionally, a decrease in thermomechanical characteristics was seen for PC/carbon nanotubes (Jin et al., 2008) as well as PC/ ZnO (Carrion et al. 2007; Charde et al., 2017). In another case, thermomechanical characteristics of PC/silica composites made by blending and melt pressing were found to be improved when compared to pure PC for 1% and 2% composites (Chau et al., 2010; Motaung et al., 2012).
The idea of lowering testing effort has been examined consistently by scientists, and after a great deal of work, computational procedures have been established as the optimum option. It was able to limit the number of analyses in order to obtain a rough notion of how composites behave. In the instance of an artificial neural network (ANN), a computational technique, a subset of experimental data is used to accurately anticipate the behaviour of a substance without conducting detailed testing (Mishra et al. 2009a; Mishra et al. 2009b).
In material research, ANNs have been effectively utilised to forecast characteristics of materials. The dynamic mechanical characteristics of PTFE-based short carbon fibre composites were determined using ANN. It was determined that a sizable dataset was required due to the complexity of the relationship between the input and output (Zhang et al., 2002a). A study utilising ANN and SVR on polymer clay composites demonstrated a link between the thermo-mechanical characteristics and composition of the clay and temperature. The anticipated model was said to be advantageous for producing polymer clay composites with desired mechanical properties (Majid & Lee, 2009). Another study used an ANN technique called Radial basis functional network to investigate polymer-clay/silica hybrid composites. It was established that such methods could be used to forecast the properties of composites (lingaraju et al., 2011). The thermomechanical characteristics of a system of PC-clay nanocomposites were predicted using ANN using only the input variable as storage modulus (Charde & Sonawane, 2016).
The present study examines the thermomechanical characteristics of polycarbonate/caco3-silica core shell composites (polycarbonate composites), utilising input and output data from DMA results for polycarbonate composites generated via melt extrusion. The purpose of this study was to determine the ability of artificial neural networks to anticipate and simplify in order to estimate thermomechanical characteristics. A model (ANN) was constructed to facilitate the study of the thermomechanical properties of polycarbonate composites, hence reducing the number of experiments required and aiding in the understanding of such composites' behavior (Malika & Sonawane, 2021a; Malika & Sonawane, 2021b; Shimpi, Khan et al., 2018).
Such ANN models facilitated the identification of composites' potential without the need for tests. This could result in cost and time savings associated with material characterization and analysis (Aktay et al., 2005; Majid & Lee, 2009; Khan & Khan, 2002).
2. Materials and methods
2.1. Materials
CaCO3 nanoparticles were synthesized and used after drying. Na2SiO3.9H2O, and HCl used in the experiments were of analytical purity and were used as obtained. Polycarbonate (MAKROLON® 2407) was purchased from Bayer, India.
2.2. Synthesis and modification of nanoparticle
The Na2SiO3 solution was added to the slurry of CaCO3 nanoparticles in a mole ratio of SiO2/CaCO3 of 1:5. Heating the mixture to 80°C and monitoring the pH continuously until a pH of 7 was achieved. The slurry was aged for two hours. CaCO3 SiO2 core shell nanoparticles were obtained by washing the slurry, filtration, and drying.
Stearic acid was used to modify the product. Drying nanoscale CaCO3/SiO2 core shell nanoparticles at 100°C for 12 hours to remove any absorbed moisture. Stearic acid (0.002 mol) was dissolved in 100 ml pure toluene and then transferred to a flask equipped with a stirrer. Around 5g of CaCO3/SiO2 core shell nanoparticles were slowly added over a 10-minute period with vigorous stirring (2,500 rpm). After the particles were completely added to the mixing chamber, the materials were mixed for an additional hour with continuous stirring. After grinding the product, a fine powder of stearic acid-coated CaCO3/SiO2 core shell nanoparticles was obtained. (Sonawane et al., 2011; Zhang & Li, 2004).
2.3. Polycarbonate composites
Melt extrusion at 280°C and 100 rpm was used to fabricate polycarbonate composites. The injector was maintained at 310°C and filled with melt polymer. The mould was kept at 145°C, the moulding pressure was approximately 900 bars for 7 seconds, and the post pressure was approximately 650 bars for 5 seconds. Prior to mixing, the PC pellets were dried at 80°C for 12 hours, and the PC was gradually fed with 5g of PC and the corresponding percentage of nanoparticles. The use of counter current screws and recycling for three minutes should ensure adequate mixing of nanoparticles into the polycarbonate matrix. Composites were moulded to a 50x10x1 mm3 dimension for the purpose of evaluating their thermomechanical properties.
2.4.1. XRD
After thoroughly cleaning the sample holder, the nano powder was spread on the sample holder. The sample was then placed inside the XRD machine (Model-DY-1656) and the sample was investigated to understand the phase(s) and size of the nano powder.
2.4.2. SEM
The sample of nano powder was affixed to a metallic stub which is placed on the sample holder. There is a fixed sample holder inside the machine on a rotatable disc. The nano powders were thus made ready for SEM. The equipment used was SEM (JEOL-JSM 5800), to study the morphology of the nanoparticles operated under low vacuum at an accelerating voltage of 25 kV to get the sharp image of the sample.
2.4.3. TGA
From TGA, the data on weight loss and decomposition of the samples with temperature is available. Thermo-gravimetric analyzer was TG 6300 type analyzer (SII Nanotechnology Incorporation, Japan) under the inert atmosphere with nitrogen at the rate of 60-100 ml/min. About 2 to 10 mg of the sample were heated from 25 to 800°C at a heating rate of 10°C.
2.4.4. DSC
DSC 7020, AS-3D, SII Nanotechnology Inc., Japan was used to determine the glass transition temperature (Tg). The analysis was carried out under inert atmosphere at a rate of 60 - 100 ml/min using 5-10 mg of sample. It involves heating the samples from 25°C to 550°C at a rate of 10°C/ min. 5 mg of the sample was taken in an aluminium pan and sealed for the DSC analysis.
2.4.5. DMA
DMA Q 800, TA Instruments Inc., USA, was used to study the storage modulus and tan ∂. Temperature range was 40-170°C and the rate of heating was 3°C/ min in an ambient condition. The specimens were prepared by injection molding machine “HAAKE Mini CTW” and had the dimension 50x10x1mm3. Analysis was carried out at a constant vibration frequency of 1 Hz, using a single cantilever clamp.
2.5. Computational method
The biological nervous system stimulates an artificial neural network that is being used as a tool. Similar to the brain, it is capable of recognizing patterns within data. Numerous processing units (or artificial neurons) are connected in a predetermined manner to perform a desired pattern recognition task (Yegnanarayana, 2003). Neurons are organized into three layers: input, hidden, and output. The input layer is the one that receives the input dataset. The hidden layer functions as the system's brain. The target layer determines the system's final output, referred to as the output layer. The neurons and their interconnections adjust the input data at each step to produce the output. Additionally, one or more layers of hidden neurons can be used (Nasir et al., 2009). Each neuron has the ability to transmit data to the next neuron. The output of a preceding neuron is multiplied by the weight, then modified using function, and finally deviated by the bias. Throughout the training period, system changes result in weight and bias adjustments to achieve optimal performance. Finally, the model's performance is quantified using the mean squared error (MSE) (Zhang et al., 2002b). The equation used to attain the output for a neuron t is given as below,
Where xi, signifies the ith weight, b denotes the bias and, a signifies the transfer function. Here a feed forward neural network with three layers was chosen. The transfer function being tangent sigmoid (tansig) for the hidden layer. A linear transfer function (purelin) was selected for the output layer. The log sigmoid function is determined by eq. 2 and tansigmoid by eq. 3.
where linear activation function is given by eq. 4
The performance of ANN model was evaluated in terms of mean squared error (MSE) as given by eq. 5
Where, n is the number of experimental data, the experimental data is denoted as Yi,e and the corresponding predicted data denoted as Yi, p.
We have used MATLAB based ANN toolbox, version R2012a (“Matlab neural network toolbox, http://www.mathworks.com/products/neural-network,” n.d.) for developing the model. This tool provides supervised learning. This tool is a combination of feedforward, backpropagation, radial basis, and dynamic networks (Khanam et al., 2016). A sensitivity analysis is useful for the evaluation of the comparative significance of each input variable on the output and is given by Garson (1991),
where, the comparative implication of the jth input variable on the output variable is Ij. The number of input neurons is Ni and hidden neurons is Nh. The connection weight is W. The input, hidden and output layers are denoted by the superscripts I, h and o respectively. The input, hidden and output neurons are represented by the subscripts k, m and n respectively.
2.6. Proposed Methodology
We are considering that percentage composition of nanoparticles and temperature influences the output that is tan δ and finally glass transition. The system is a polycarbonate/ calcium carbonate-silica core shell composites with varying concentration of nanoparticles such as 1%, 3% and 5%. The damping effect (tan δ) is considered as a nonlinear function of percentage of nanoparticles and temperature. Additionally, for fast learning of the model, we consider transition temperature at zero percentage nanoparticles composition (pure PC). It is only one and constant value obtained from loss tangent (tan δ) peak point (Khan et al., 2009). We are using MATLAB, R2012a which applies supervised and feed forward back propagation via neural network tool.
3. Results and discussion
3.1. SEM
The nanoparticles were analysed using SEM images and found to be hexagonal, cube-like crystals. Figure.1 is the image of CaCO3/SiO2 core shell nanoparticles which are hexagonal cubes same as the basic CaCO3 nanoparticles. This confirms that the shape of nanoparticles used as core is governed by the shape of core shell nanoparticles. CaCO3 nanoparticles were directly coated with a layer of silica by hydrolysis and condensation of Na2SiO3 in aqueous solution.

3.2. XRD
The shape and size of CaCO3 /SiO2 core shell nanoparticles were evaluated by XRD. The analysis of crystal structure using XRD illustrates the strong and sharp peaks showed that the nanoparticles was well crystalline. The average crystallite size (D) of the CaCO3 /SiO2 core shell nanoparticles was calculated using Scherer’s formula.
Where, shape factor is D, x-ray wavelength is λ, FWHM of diffraction peak is β, Bragg angle is θ.
The average crystallite size (D) of the calcium carbonate was calculated using Scherer’s formula and was found to be 32 nm. It was concluded from Figure 2 that all of the peaks obtained in the XRD pattern of CaCO3 /SiO2 core shell nanoparticles matched perfectly with the standard CaCO3 pattern as is evident from. XRD image as given in Figure 2 of CaCO3 /SiO2 core shell nanoparticles show that coating on CaCO3 does not change the crystal structure of CaCO3 core (Klugg & Alexander, 1974).

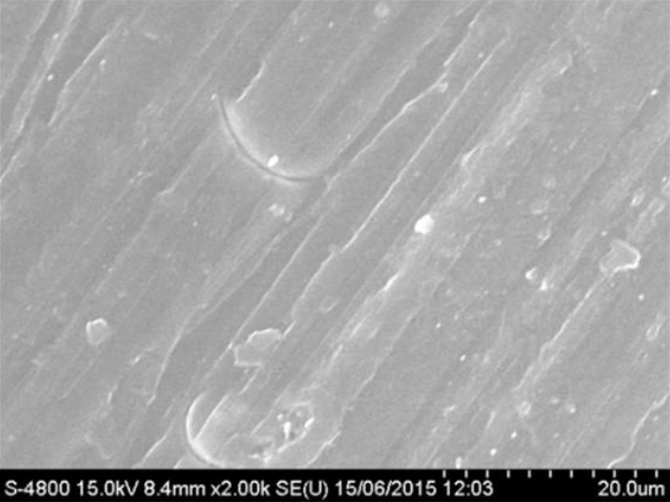
3.3. FE-SEM
3% loading of CaCO3 /SiO2 core shell nanoparticles were found to be aggregated together and the aggregation were detached from each other as shown in Figure 3a.
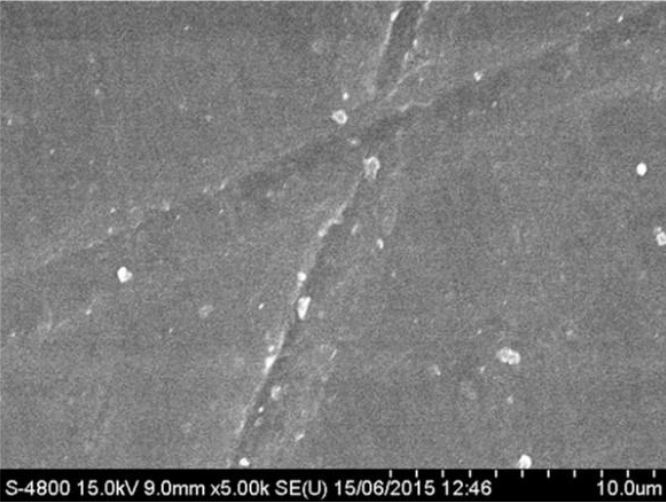
With increasing CaCO3 /SiO2 core shell nanoparticles loading, the amount of the aggregation increased as can be seen for 5% loading in Figure 3b. These aggregations comprised of several nanoparticles due to which their size reached micrometre level. Obviously, it was difficult to disperse nanoparticles homogeneously in the PC matrix through compounding PC pellets with CaCO3 /SiO2 core shell nanoparticles during the melt extrusion processing (Sen et al., 2018).
3.4. Thermal properties
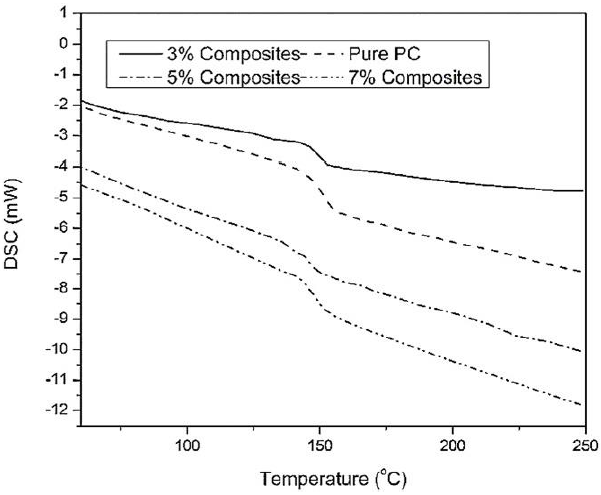
Thermal degradation of pure PC and polycarbonate/ CaCO3-silica core shell composites (polycarbonate composites), confirmed a two-stage process as is evident from Figure 4a. The reinforcement of core shell nanoparticles did not lead to any significant enhancement in thermal stability of the polycarbonate composites. From Table 1, it was observed that the onset of degradation for the case of polycarbonate composites was at a lower temperature as compared to the pure PC. This behaviour indicated a decrement as the concentration of nanoparticles increased. But the early degradation has also resulted in higher charred residue for the polycarbonate composites, indicating probable improvement in flame resistivity (Sonawane et al., 2009a; 2009b).
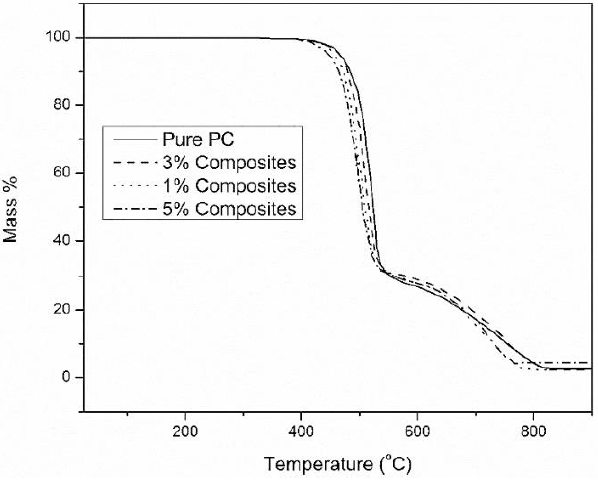
Table 1 TGA data as obtained for PC and polycarbonate composites.
| Sample | Ton set(oC) | T0.5oC | Charred Residue |
|
|---|---|---|---|---|
| PC | 461 | 519 | 0.8% | |
| PC+ SiO2CS |
1%CaCO3- | 459 | 505 | 0.8% |
| PC+ SiO2CS |
3%CaCO3- | 447 | 498 | 2.8% |
| PC+ SiO2CS |
5%CaCO3- | 436 | 491 | 2.7% |
The DTG curve as is shown in Figure 4b, confirmed two stage degradation process of pure PC and polycarbonate composites. Also, the DSC endotherms depicted by Figure 4c, specified that the glass transition temperature values (Tg) of polycarbonate composites are nearly similar as that of pure PC. The Tg did not improve which confirmed the thermal stability decrement, as is observed by TGA. It means that presence of nanomaterials could not restrict the mobility of PC chain segments, indicating a poor reinforcement. Tg values did not change much, which can be confirmed with Tan Del curves. Table 2 displays a comparison of Tg values (Sonawane et al., 2010).

3.5. Thermo-mechanical properties
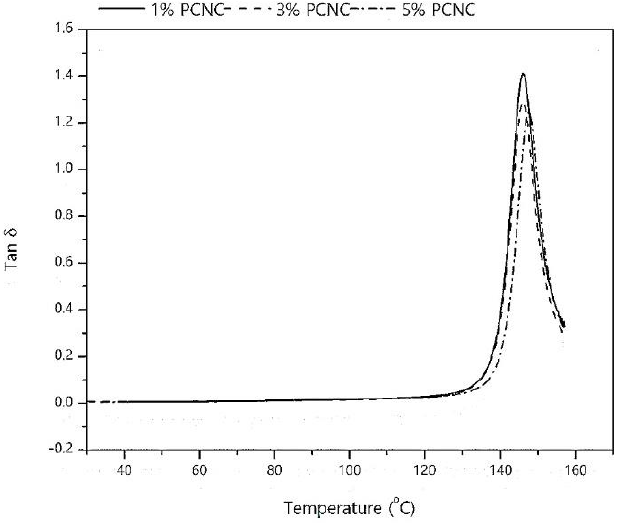
The calcium carbonate-silica core shell nanoparticles were modified using stearic acid to achieve a good compatibility with the polycarbonate matrix. Polycarbonate composites were prepared at 280°C in an extruder using counter current screw arrangement. Figure 5a and 5b represent the results obtained from DMA. Figure 5a shows dependence of storage modulus on filler composition with temperature for polycarbonate composites. It is observed that the storage modulus of composites increases with the percentage composition thus leading to increase in stiffness of the material but only in the room temperature region. It is also clear that storage modulus for 5% polycarbonate composites confirmed maximum enhancement. The transition value of 5% polycarbonate composites is slightly lower than that of 1% and 3%. This is supported by Figure 5b where the peak points represent Tg and it is higher for 1% and 3% polycarbonate composites. When the reinforcement of nanoparticles in the polymer matrix is good, the damping effect represented by the peak in Figure 5b should decrease with percentage composition leading to better Tg. The dynamic mechanical properties depend on several factors i.e., filler’s size, morphology and the extent of interaction between the filler and the polymer matrix. Here in spite of the presence of surface modifier, the Tg values did not improve, and the reinforcement achieved is low. The reason could be the catalysis of degradation due to a degradation of surface modifier at the processing temperature which is high. It is thus confirmed that the presence of higher percentage of nanoparticles did not lead to a restriction of polymer chain mobility. If this behaviour can be predicted using ANN a lot of time and money could be saved (Shimpi, Borane et al., 2018; Ghanshyam et al., 2016b).

3.6. Designing ANN model
A neural network, in its broadest sense, is made up of a number of neurons that, when combined, can perform any constructed function. To improve results, a sufficient training set should be identified. Approximately 70% of the data set is used for operating system training, with the remaining 30% divided between testing and validation. The input layer, the hidden layer, and the output layer comprise the three layers of an ANN. Every neuron has three components: a normalised input, a transfer function, and an output. The network's neuron is stimulated by the weighted number of inputs, and one outcome is sent to the output units. The network will continue to operate until a convincing measurement accuracy is achieved. The data obtained from dynamic mechanical analyzer are in large volume, which is preferred for ANN applications. The data was obtained for a system of PC/ calcium carbonate-silica core shell composites with various compositions of nanoparticles like 1%, 3% and 5%.
The datasets were used to train various developed ANN model. The data were separated as the training data set and validation data and the values are listed in supplementary Table S1. The data were normalized to obtain dimensionless parameters within a certain range using eq. 8.
Where, the normalization value is y, the original value is x. The maximum original value is xmax. The xmin is the minimum original value.
Thus, the collected data using the normalization technique were processed. The same data was used to design neural network models to predict thermo-mechanical properties. The process of designing included a sequence of trials with several neural configurations along with layer and the function configuration. These models were compared, and the most successful model selected.
The different transfer functions available are purelinear, tan-sigmoid and log sigmoid. The function used for the second layer input to output is purelinear as it can generate the output in any numerical values, whereas tansigmoid and logsigmoid can generate outputs of either 1 or 0. The algorithm used to train the network was Levenberg-Marquardt algorithm (TrainLM). For most of the systems, the highest accuracy in prediction was provided by TrainLM. The training of models up to 1000 epochs using training dataset was an integral part before selecting any model. Epochs can be defined as number of times an ANN model is permitted to regulate the weight and bias to accomplish better simulation. A better performance using the single-layer models was observed in training as compared to the multiple layer models. In single layer models, large models as compared to smaller models were confirmed to be comparatively better, e.g. 2-[4]-1. It was found that as the hidden layer increases in size like more than 4 neurons, no further enhancement in performance is expected. The single layer model with number of neurons as 4, was selected for the hidden layer as shown in Figure 6a.

The final model was selected when the system gradually converged and further improvement in performance was not observed anymore. It was observed that as the training cycles increased the error percentile dropped sharply. The parameter settings for ANN model are mentioned in Table 3.
Table 3 Parameter settings for ANN based Prediction model.
| Neural network parameters |
Selected values |
|---|---|
| Input layer neurons | 2 |
| Number of hidden layers | 1 |
| Number of neurons in the hidden layers | 4 |
| Number of neurons in the output layer | 1 |
| Activation function of hidden layers | Tansig |
| Activation function of output layers | Purlin |
| Training algorithm | Levenberg-Marquardt |
| Number of epochs | 1000 |
3.6.1. Comparison of experimental and ANN results
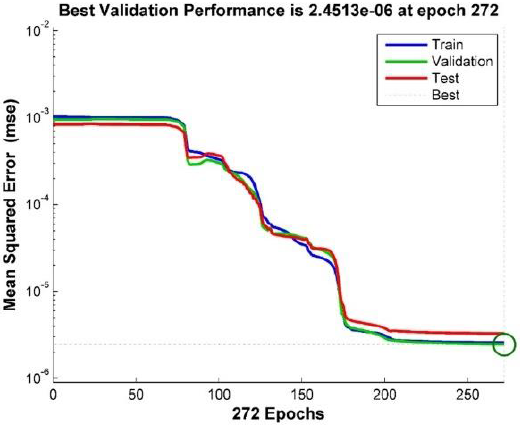
By comparing the experimental values with its corresponding predicted values as obtained by using ANN model, the final model was tested and validated. Figure 6b represents all prediction set with training, validation and test and the regression (R) was found to be close to 1. In all the cases it was observed that the values of R were close to 1, indicating the fact that the suggested ANN model was precise in predicting tan δ values. This also proves that the ANN model is capable of predicting the thermo-mechanical properties of polycarbonate composites (Sarve et al., 2015). Figure 6c represents the performance curve and it shows that performance converges to the range of 10-6 with 272 epochs. The experimental results were found to be in good relationship with the predicted values for all the parameters tested here with a high regression coefficient of 0.9999. Figure 7 shows assessment of experimental and ANN outputs when compared. It was observed that the coefficient of correlation is also close to 1 depicting the fact that the model used is the most suitable for the said system.

Figure 6b Correlation between target and network outputs during training, its validation and testing together.

3.6.2. Prediction of thermo-mechanical properties for sample data
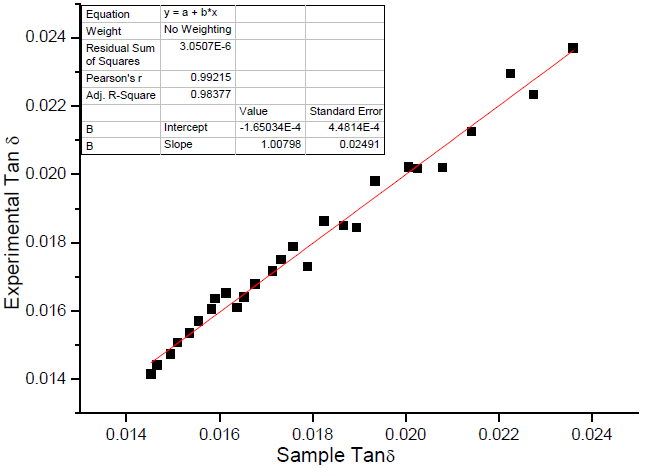
Using the established ANN model, it was easier to predict the tan δ values i.e., thermo-mechanical properties for a given sample inputs with different concentrations of PCNC. Table 4 shows the data set used for testing the model along with experimental and predicted values of tan δ. The experimental and predicted properties follow the same trend with a correlation coefficient of 0.992 as shown in Figure 8. This value of correlation coefficient indicates the capability of the model to predict the results.
Table 4 Model tested for 1 and 2% composition of PCNC at 149°C peak temperature.
| Concentration (%) | Temperature | Experimental Tan δ | Predicted Tan δ | % Error |
|---|---|---|---|---|
| 1 | 93.13809 | 0.014528 | 0.014148 | 2.61564 |
| 1 | 94.03843 | 0.014662 | 0.014417 | 1.67099 |
| 1 | 95.08978 | 0.014947 | 0.014739 | 1.39158 |
| 1 | 96.14039 | 0.015097 | 0.015068 | 0.19209 |
| 1 | 97.04145 | 0.015352 | 0.015357 | -0.03257 |
| 1 | 98.09259 | 0.015548 | 0.015701 | -0.98405 |
| 1 | 99.1447 | 0.015834 | 0.016052 | -1.37678 |
| 1 | 100.0445 | 0.015907 | 0.016358 | -2.83523 |
| 1 | 101.0944 | 0.016144 | 0.01652 | -2.32904 |
| 1 | 102.1443 | 0.01638 | 0.016089 | 1.77656 |
| 1 | 103.0436 | 0.016526 | 0.016409 | 0.70798 |
| 1 | 104.0937 | 0.016768 | 0.016788 | -0.11927 |
| 1 | 105.1428 | 0.017139 | 0.017171 | -0.18671 |
| 1 | 106.0427 | 0.017325 | 0.017503 | -1.02742 |
| 1 | 107.0918 | 0.01758 | 0.017894 | -1.78612 |
| 1 | 108.1418 | 0.017889 | 0.017289 | 3.35402 |
| 1 | 109.0426 | 0.01825 | 0.018631 | -2.08767 |
| 1 | 110.0928 | 0.018659 | 0.01850034 | 0.85031 |
| 1 | 111.1484 | 0.018937 | 0.018443 | 2.60865 |
| 1 | 112.0485 | 0.019346 | 0.019797 | -2.33123 |
| 1 | 113.0988 | 0.02006 | 0.020215 | -0.77268 |
| 1 | 114.1486 | 0.020256 | 0.0201643 | 0.45271 |
| 1 | 115.0477 | 0.020795 | 0.0202018 | 2.85261 |
| 1 | 116.0984 | 0.021414 | 0.0212472 | 0.77893 |
| 1 | 117.1472 | 0.022258 | 0.022948 | -3.10001 |
| 1 | 118.0479 | 0.022743 | 0.0223379 | 1.78121 |
| 1 | 119.0959 | 0.023599 | 0.0236919 | -0.39366 |
| 1 | 93.13809 | 0.014528 | 0.014148 | 2.61564 |
| 2 | 108.0515 | 0.022193 | 0.022166 | 0.1230 |
| 2 | 108.2017 | 0.02228 | 0.021932 | 1.5600 |
| 2 | 108.3514 | 0.022367 | 0.021992 | 1.6780 |
| 2 | 108.5018 | 0.022454 | 0.022414 | 0.1789 |
| 2 | 108.6518 | 0.022541 | 0.022263 | 1.2340 |
| 2 | 108.802 | 0.022628 | 0.021999 | 2.7800 |
| 2 | 108.9511 | 0.022714 | 0.022058 | 2.8900 |
| 2 | 109.0992 | 0.0228 | 0.022369 | 1.8900 |
| 2 | 109.2493 | 0.022886 | 0.022527 | 1.5678 |
| 2 | 109.3987 | 0.022973 | 0.022929 | 0.1907 |
| 2 | 109.5484 | 0.023059 | 0.022708 | 1.5210 |
| 2 | 109.6988 | 0.023146 | 0.022896 | 1.0780 |
| 2 | 109.8479 | 0.023232 | 0.023193 | 0.1678 |
| 2 | 109.9978 | 0.023318 | 0.02303 | 1.2350 |
| 2 | 110.148 | 0.023404 | 0.022725 | 2.9011 |
| 2 | 110.2999 | 0.023492 | 0.022809 | 2.9080 |
| 2 | 110.4499 | 0.023578 | 0.023169 | 1.7340 |
| 2 | 110.6006 | 0.023664 | 0.023341 | 1.3670 |
3.6.3. Prediction of tan δ for an unknown concentration 2% PCNC
The prediction capability of the ANN model is checked using an unknown concentration of 2% PCNC. The results obtained using the designed ANN model is listed in table 4. The values when compared to the experimental outputs of 3 % PCNC are close to the expected range which proves that the model is the most suitable for prediction of thermo-mechanical properties of polycarbonate composites.
3.6.4. Sensitivity analysis
The weights used for sensitivity analysis is obtained from the ANN model. In the biological sciences, the strengths between the axons and dendrites are equivalent to these weights. Subsequently the percentage of the input signal which should be transmitted into the body of neurons, will be decide by each weight (Slokar et al., 1999). The comparative significance of the three input variables is listed in Table 5. The relative importance of temperature at which load is being applied is more than the other variable but they help in learning the system faster for better performance. In absence of these the system takes longer time to converge, and generalization obtained is not good (Shimpi et al., 2011; Charde, Sonawane, Sonawane, & Navin, 2018).
3.6.5. Prediction of Glass transition temperature using optimization by genetic algorithm
Figure 9 demonstrates the effects of temperature and concentration on the tan δ values in 3D. The ANN model was used to optimize the conditions using genetic algorithm. It is observed that tan δ values are almost constant up to a temperature of 130°C very close to its transition value. A steep increase in the values is observed up to a maximum value of tan δ=1.2. This peak value corresponds to the glass transition temperature of the polycarbonate composite for a concentration of 5% PCNC and it is 147°C.

4. Conclusions
The current effort was an attempt to investigate the possibility of using an artificial neural network to precisely predict the thermomechanical properties of polycarbonate composites. The experimental results are found to be consistent with the predictions of the ANN. This model is best suited for a system composed of polycarbonate composites, as the addition of filler results in a decrease in Tg values. Correlation coefficients that are high and mean squared error values that are small ensure that the training process is accurate. The uniform correlation coefficient values and close mean squared error values observed for the training, validation, and testing data sets indicate that the ANN model has a high degree of generalization competence. Tan values for unknown concentrations are also within the acceptable range. Optimization contributes to the determination of the glass transition temperature of polycarbonate composites. Thus, using an ANN model, it is possible to predict the thermomechanical properties of polycarbonate composites as a function of concentration and temperature. This prior knowledge is beneficial when determining the ultimate application for the new composite product. After the network is finalized, the time required is only a few seconds to a few minutes, making it a faster option than characterizations and testing, saving both time and money.
Conflict of interest
We on behalf of all the authors state that there is no conflict of interest as far as this manuscript is concern.
Financing
There was no funding available for this research work carried in our laboratory.

