


 text new page (beta)
 English (pdf)
 Article in xml format
 Article references
 Send this article by e-mail
 Cited by SciELO
  Similars in
SciELO
Similars in
SciELO 
 Permalink
1. Introduction
Anthocyanins are natural colorants extracted from a wide variety of sources such as fruits (grapes, red raspberry and cranberries) (Bassa & Francis, 1987; Fuleki & Francis, 1968) ,vegetables (red cabbage, red radish, sweet potato) and petals of some flowers (Giusti & Wrolstad, 1996; Patil et al., 2009).Anthocyanins are considered as potential replacements for synthetic counterparts because of their bright attractive colors, water solubility that allows their incorporation into aqueous food systems and a number of health benefits such as improved visual acuity, anticancer and antiviral activities (Markakis, 1974). However, anthocyanin containing products are susceptible to color deterioration during processing and storage. The main limitation of most of the anthocyanin pigment for commercial applications is its chemical instability and low tenctorial strength (Teh & Francis, 1988). The details of structures, properties and extraction procedures of anthocyanins have been recently reviewed by Silva et al. (2017). Several extraction procedures have been employed for the extraction of anthocyanin. Recently, (Esmailian et al., 2021) have studied the optimization of extraction of However, the presence of residual solvents in the extract will limit its application as food colorant. Hence, the complete separation of the solvent from the extract is of importance. Hence, an efficient extraction procedure should maximize anthocyanin recovery with a minimal amount of adjuncts and minimal degradation or alteration of its natural state.
In this regard, the liquid emulsion membrane (LEM) has gained much importance as it is a versatile and gentle technique. LEM involves three phases: the innermost (interior) phase is usually aqueous; the intermediate phase is an organic solvent (membrane phase) and the outer (exterior) phase, which is aqueous. Liquid emulsion membranes are double emulsion, i.e., water/oil/water (w/o/w) systems or oil/water/oil (o/w/o) systems. Solute is usually transported across the membrane. It is driven by the ability of the desired species to partition in the membrane phase, and its diffusion rate through the membrane. Chanukya and Rastogi (2010) have reported the dealcoholization of anthocyanin extract from red cabbage using the liquid emulsion membrane (Chanukya & Rastogi, 2010). In our study, we applied the response surface methodology to perform the optimization of parameters affecting the LEM performance (surfactant concentration, volume ratio of emulsion to feed phase, stirring speed during extraction and extraction time).
2. Materials and methods
2.1. Raw materials
Red cabbage was collected from the local market of Tumkur, Karnataka, India, and it was stored in a refrigerator. Ethanol and other chemicals were procured from Sigma Aldrich (USA).
2.2. Preparation of anthocyanin extract
Red cabbage was washed with water and cut into pieces. About 25 g of cabbage was grinded in a domestic grinder with 50 g of 50% ethanol and filtered using muslin cloth. The filtrate was centrifuged at 5000 rpm for 5 min to obtain clear solution.
2.3. Preparation of liquid membrane
To prepare an emulsion, a known quantity of kerosene oil with Span 80 and mixed at 1500 rpm for 15 min. Once the solution became homogenous, 60 g of water was added drop wise with mixing at 300 rpm and again agitated at 3500 rpm until a stable emulsion was obtained (45 min).
2.4. Extraction of alcohol from anthocyanin extract
Extraction was conducted by mixing anthocyanin extract and emulsion in definite proportions (on volume basis) and agitated for known time and rpm in a magnetic stirrer (REMI, LDMS- 6777). During this period some alcohol was transferred to stripping phase. The two phases were separated by transferring it to a separating funnel. The bottom phase (raffinate phase) was analyzed for alcohol and anthocyanin concentration by potassium dichromate method as described by Williams and Reese (1950) and the anthocyanin pigment content was measured according to the method described by Wrolstad et al. (2005).
2.5. Multistage cross current extraction of alcohol
Multistage extraction was carried out by treating the residual anthocyanin extract obtained after the first-stage extraction with the fresh emulsion for the second-stage extraction. The residual anthocyanin extract obtained after the second-stage extraction was treated with fresh emulsion for the third-stage extraction. In this way, six stages of extraction were conducted.
2.6. Application of RSM for optimization of parameters
RSM was used to study the influence of four variables (volume ratio of emulsion to feed, concentration of lecithin, extraction rpm and extraction time). A five-level four-factor central composite rotatable design was utilized (Table 1). A total of 30 experiments were conducted in accordance with a 24 full factorial design plus six central points and eight axial points (star points). The distance of the star points from the center point is given by α=(2n)1/4, where n is the number of independent factors. Hence, for the four factors, α=2. The coded and uncoded experimental factors and their respective test ranges are given in the tables below. These ranges were established based on the results obtained by the preliminary experiments.
2.7. Statistical analysis of data
The data obtained from CCRD was used to determine the regression coefficients of the following quadratic response surface model:
Where Y is the predicted response variable (% dealcoholization)
3. Results and discussions
3.1. Statistical analysis of parameters
The dealcoholization extent was calculated for each trail and the results are tabulated in Table 2. Highest dealcoholization of 18.63 % was observed at 350 rpm, 17.5 min, 3% concentration of Span 80 and feed to emulsion ratio of 3 (Run. 25 to 30). The experimental data was analyzed by multiple regressions using Design-Expert 13 software. The final estimative models for dealcoholization in terms of uncoded factors was as follows:
Table 2 CCRD matrix showing real values along with experimental values and predicted values.
| Sl.no. | Speed/rpm | Time/min | Concentration of Span 80, % |
Feed to emulsion ratio |
% removal of ethanol (experimental), % |
% removal of ethanol (predicted), % |
| 1 | 200.00 | 10.00 | 2.00 | 2.00 | 10.25 | 11.11 |
| 2 | 500.00 | 10.00 | 2.00 | 2.00 | 6.45 | 8.42 |
| 3 | 200.00 | 25.00 | 2.00 | 2.00 | 9.45 | 11.06 |
| 4 | 500.00 | 25.00 | 2.00 | 2.00 | 8.65 | 8.34 |
| 5 | 200.00 | 10.00 | 4.00 | 2.00 | 6.47 | 8.51 |
| 6 | 500.00 | 10.00 | 4.00 | 2.00 | 7.76 | 6.60 |
| 7 | 200.00 | 25.00 | 4.00 | 2.00 | 6.76 | 8.93 |
| 8 | 500.00 | 25.00 | 4.00 | 2.00 | 9.05 | 7.18 |
| 9 | 200.00 | 10.00 | 2.00 | 4.00 | 9.25 | 10.64 |
| 10 | 500.00 | 10.00 | 2.00 | 4.00 | 10.81 | 6.45 |
| 11 | 200.00 | 25.00 | 2.00 | 4.00 | 6.05 | 11.61 |
| 12 | 500.00 | 25.00 | 2.00 | 4.00 | 12.76 | 16.67 |
| 13 | 200.00 | 10.00 | 4.00 | 4.00 | 7.23 | 7.44 |
| 14 | 500.00 | 10.00 | 4.00 | 4.00 | 8.05 | 4.27 |
| 15 | 200.00 | 25.00 | 4.00 | 4.00 | 6.35 | 12.00 |
| 16 | 500.00 | 25.00 | 4.00 | 4.00 | 9.47 | 9.85 |
| 17 | 50.00 | 17.50 | 3.00 | 3.00 | 11.17 | 9.50 |
| 18 | 650.00 | 17.50 | 3.00 | 3.00 | 10.41 | 10.43 |
| 19 | 350.00 | 2.50 | 3.00 | 3.00 | 10.5 | 9.92 |
| 20 | 350.00 | 32.50 | 3.00 | 3.00 | 10.32 | 12.52 |
| 21 | 350.00 | 17.50 | 1.00 | 3.00 | 10.35 | 6.30 |
| 22 | 350.00 | 17.50 | 5.00 | 3.00 | 4.5 | 4.45 |
| 23 | 350.00 | 17.50 | 3.00 | 1.00 | 12.18 | 7.80 |
| 24 | 350.00 | 17.50 | 3.00 | 5.00 | 10.52 | 11.80 |
| 25 | 350.00 | 17.50 | 3.00 | 3.00 | 18.40 | 18.63 |
| 26 | 350.00 | 17.50 | 3.00 | 3.00 | 18.40 | 18.63 |
| 27 | 350.00 | 17.50 | 3.00 | 3.00 | 18.40 | 18.63 |
| 28 | 350.00 | 17.50 | 3.00 | 3.00 | 18.40 | 18.63 |
| 29 | 350.00 | 17.50 | 3.00 | 3.00 | 18.40 | 18.63 |
| 30 | 350.00 | 17.50 | 3.00 | 3.00 | 18.40 | 18.63 |
Where, R1 is extent of dealcoholization, ‘A’ is agitation speed, ‘B’ is extraction time, C is concentration of Span 80 and ‘D’ is volume ratio of emulsion to feed. The values of R1 were calculated by equation (2) and are tabulated in Table 2. It can be observed that, the values predicted by model and experimental were close to each other, as evident by high R2 value (0.93).
Table 3 illustrates the ANOVA results for the second-order response surface model fitted. Fisher’s variance ratio (ratio of mean lack of fit to mean square of pure experimental error) was high for the predicted model (F=12.29) and had a low probability (p<0.0001), which demonstrated the high significance of the model. There is only a 0.01% chance that "Model F-Value" this large could occur due to noise. The significance of each term was evaluated by their p-values. The smaller the p-value, the more significant is the corresponding coefficient. Thus, concentration of Span 80 was most significant as p-value for it was less as compared with the other factors. This was due to the fact that, surfactant decreases the interfacial tension between emulsion globules which in turn decreases their Sauter diameter. This leads to higher contact area between feed solution and globules resulting in high extraction efficiency. However, above a critical concentration of surfactant, the removal efficiency of alcohol decreases due to larger diffusional resistance offered by surfactant film. Hence, the concentration of surfactant plays a vital role during LEM. Among the linear terms, AD was significant, while all quadratic terms were statistically significant.
Table 3 Analysis of variance.
| Source | Sum of squares |
Df | Mean square | F value | p-value prob>F |
| Model significant | 494.63 | 14 | 35.33 | 12.29 | <0.0001 |
| A-speed | 3.89 | 1 | 3.89 | 1.35 | 0.2631 |
| B-time | 2.45 | 1 | 2.45 | 0.85 | 0.3704 |
| C-Conc.of Span 80 | 24.46 | 1 | 24.6 | 8.51 | 0.0106 |
| D-ratio of emulsion to feed | 0.14 | 1 | 0.14 | 0.048 | 0.8297 |
| AB | 1 | 8.19 | 2.85 | 0.1120 | 0.081 |
| AC | 1 | 0.93 | 0.32 | 0.5787 | 0.5385 |
| AD | 1 | 10.94 | 3.81 | 0.0700 | 0.047 |
| BC | 1 | 0.24 | 0.084 | 0.7754 | 0.7518 |
| BD | 1 | 0.85 | 0.30 | 0.5944 | 0.5553 |
| CD | 1 | 0.57 | 0.20 | 0.6635 | 0.6297 |
| A2 | 1 | 135.56 | 47.15 | 54.93 | <0.0001 |
| B2 | 1 | 105.25 | 36.61 | 59.86 | <0.0001 |
| C2 | 1 | 257.69 | 89.64 | 105.84 | <0.0001 |
| D2 | 1 | 119.17 | 41.45 | 48.05 | <0.0001 |
| Residual | 43.12 | 15 | 2.87 | - | - |
| Lack of fit | 43.12 | 10 | 4.31 | - | - |
| Pure error | 0.000 | 5 | 0.000 | - | - |
| Cor total | 537.75 | 29 | - | - | - |
| Std.dev. | 1.70 | R2 =0.93 | |||
| Mean | 10.93 | Adj. R2=0.84 | |||
| C.V. % | 15.51 | Pred. R2=0.53 | |||
| Press | 248.39 | Adequate precision =11.91 | |||
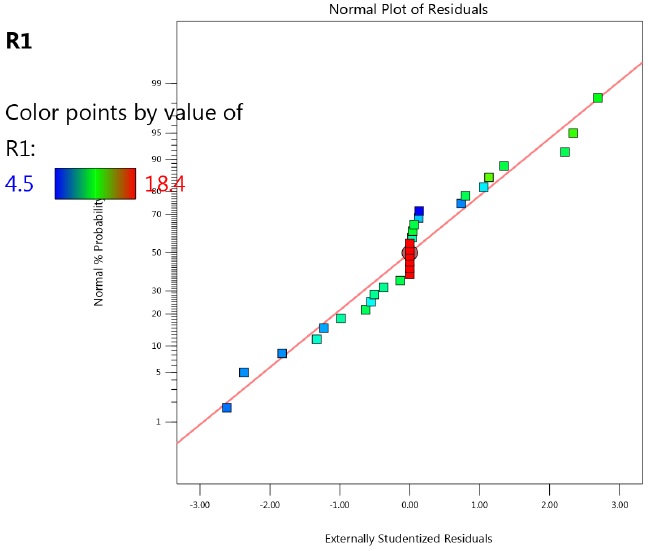
Further, adequate precision gives an indication of signal to noise ratio. Therotically, a ratio > 4 is desirable. In the present work, it was 11.91 and hence satifactory. R2 (Coefficient of regression) indicates the proportion of variation in the depended variable explained by regression model. Adjusted R2 is coefficient of determination adjusted for the number of independent variables in the regression model. High values of R2 obtained in the present work (0.93) indicated that they would accurately predict the relationships between the parameters. However, predicted R2 and Adjusted R2 values were lower than R2.
The normal probability resiudal plot was a straight line, thus confirming the normality of experimental data (Figure 1).
3.2. Analysis of response surface plots
3.2.1. Effect of agitation speed and extraction time
The Design-Expert software gives 3-D surface plots which can be analyzed for understanding the mutual interactions among independent variables. These graphs are obtained by fixing two parameters constant, while other two parameters are kept constant. Figure 2 shows the mutual interactions between agitation speed and extraction time. It was observed that, the dealcoholization increased with increasing agitation speed and then decreased at higher agitation speed. This might be due to breakage of emulsion at high agitation speed due to shear force . Due to emulsion breakage, the solute leaks out of internal phase (Kulkarni & Mahajani, 2002) At lower agitation speed, the rate of coalescence of droplets increases and leads to larger emulsion globules. This decreases the interfacial area for mass transfer. At high stirring speeds, although interfacial area increases due to formation of small size emulsion droplets, the swelling phenomena becomes significant because of increased rate of water transport through the membrane. Also, the shear force on the emulsion droplets increases. This leads to breakdown of globules and leakage of inner stripping phase into the feed solution. The shear induced breakage of fragile emulsion droplet near tip of the impeller or impact on the wall of a contactor imposes upper limit on the stirring speed. Hence a trade-off exists for level of mixing during extraction (Gallego-Lizon & Pérez De Ortiz, 2000). Hence, it can be said that, the optimum stirring speed which gave better emulsion stability and rate of metal extraction closely depends on the conditions of parameters used, such as the emulsion compositions and the equipment, and types of metal to be extract.
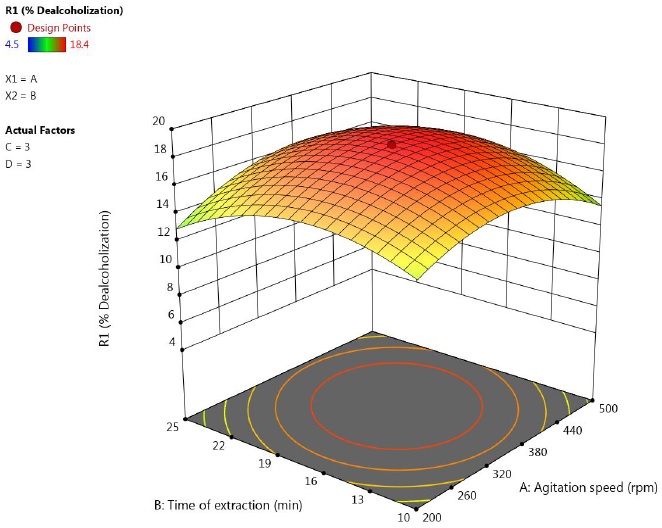
Figure 2 Response surface plot showing the effect of speed and time on percentage of ethanol removal (concentration of Span 80=3 %, feed to emulsion ratio = 3).
Emulsion stability is also closely related to extraction time. As the time of extraction increases, the water transport into the membrane phase increases. This causes the swelling of emulsion droplets. Swelling is detrimental to LEM process not only because it leads to breakdown of emulsion globules but can also lead to difficulty in demulsification step (Amini et al., 2008). Therefore, an adequate contact time is very important for LEM process. The extraction time in the present study was varied from 5 to 30 min. The % dealcoholization decreased at higher extraction time.
3.2.2. Effect of Span 80 concentration
Figure 3 shows the effect of agitation speed and Span 80 concentration on extent of alcohol removal. As was observed in earlier discussion, the Span 80 concentration was more influential among other factors. At lower surfactant concentration, the recovery of alcohol was low. With increasing concentration, the % dealcoholization increased due to higher interfacial area available. An initial increase of the surfactant concentration in membrane phase improves the stability of the membrane and hence the percentage extraction.
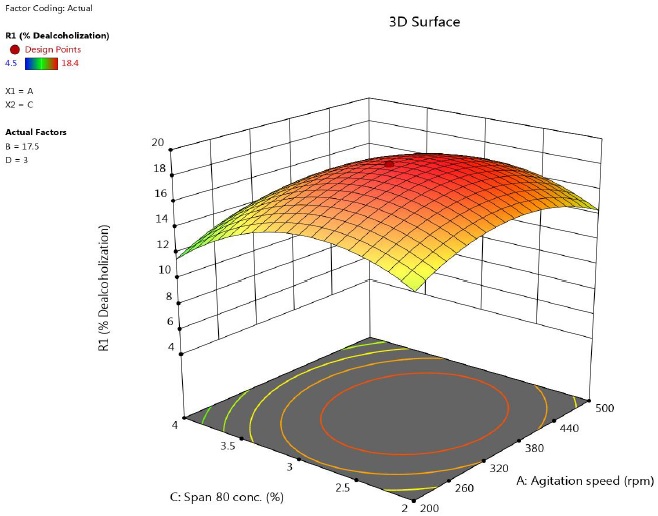
Figure 3 Response surface plot showing the effect of speed and concentration of lecithin on percentage of ethanol removal (time = 17.5 min, feed to emulsion ratio = 3).
Gallego-Lizon and Perez De Ortiz, (2000) have reported that the increasing surfactant concentration decreases the interfacial tension of emulsion globules which in turn decreases their Sauter diameter. This leads to higher contact area between feed solution and globules resulting in high extraction efficiency. However, above a critical concentration of surfactant, the removal efficiency of alcohol decreases due to larger diffusional resistance offered by surfactant film. Hence, the amount of surfactant in the membrane must be minimum, but enough to stabilize the emulsion.
3.2.3. Effect of volume ratio of emulsion to feed
Figure 4 shows the effect of agitation speed and volume ratio of emulsion to feed phase on extent of dealcoholization. It was observed that, a maximum was observed. At higher volume of emulsion, alcohol removal decreased. Unlike conventional solvent extraction, in LEM, an increase in volume of emulsion does not lead to increased extraction rates.
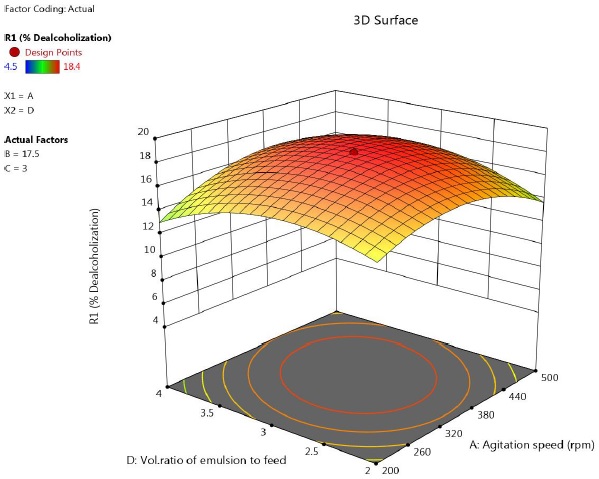
Figure 4 Response surface plot showing the effect of speed and feed to emulsion ratio on percentage of ethanol removal (time = 17.5 min, concentration of lecithin= 3 %).
Initially, as the amount of emulsion in the feed solution increases, the number of available globules and interfacial surface area per unit volume of the feed solution increases. But adding excessive emulsion leads to larger globule size due to increased hold up of emulsion. Swelling of emulsion droplets becomes significant because of coalescence of droplets, finally leading to emulsion breakage. This decreases the efficiency of process.
3.2.4. Mutual interactions of other parameters
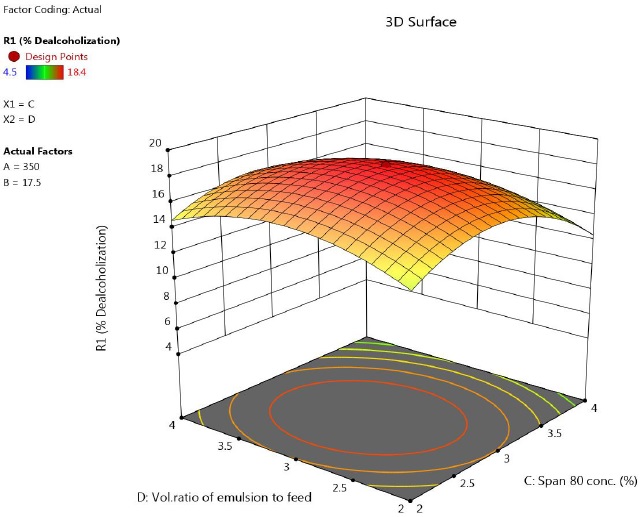
The mutual interactions of i) time of extraction- Span 80 concentration, ii) time of extraction- Vol ratio of emulsion to feed and iii) Span 80 concentration are depicted in Figure 5-7. The circular contour plots indicated that, significant interaction existed among these variables.
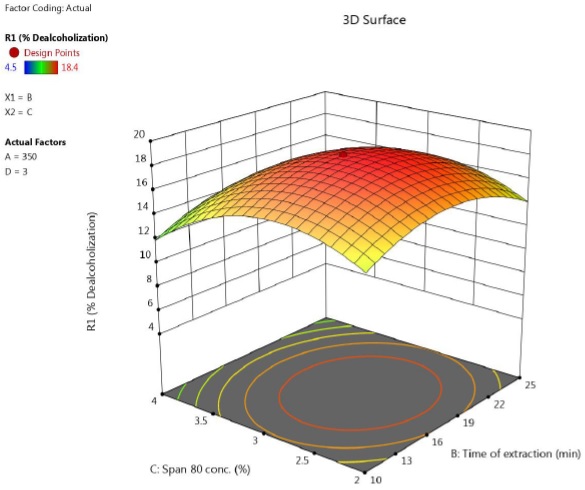
Figure 5 Response surface plot showing the effect of time and concentration of lecithin on percentage of ethanol removal (speed = 350 rpm, feed to emulsion ratio = 3).
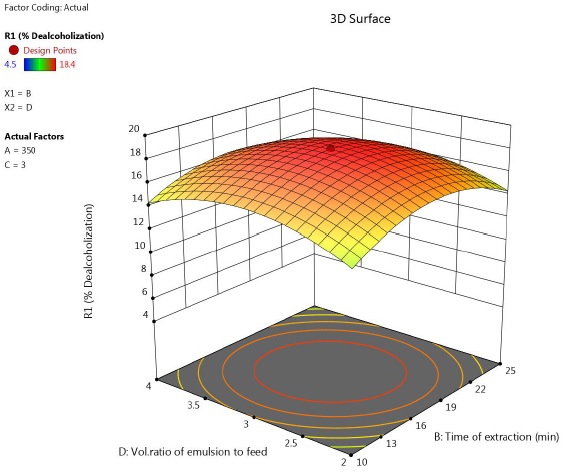
Figure 6 Response surface plot showing the effect of time and feed to emulsion ratio on percentage of ethanol removal (speed = 350 rpm, concentration of Span 80 = 3 %).
3.3. Optimization of environmental parameters affecting dealcoholization using desirability function
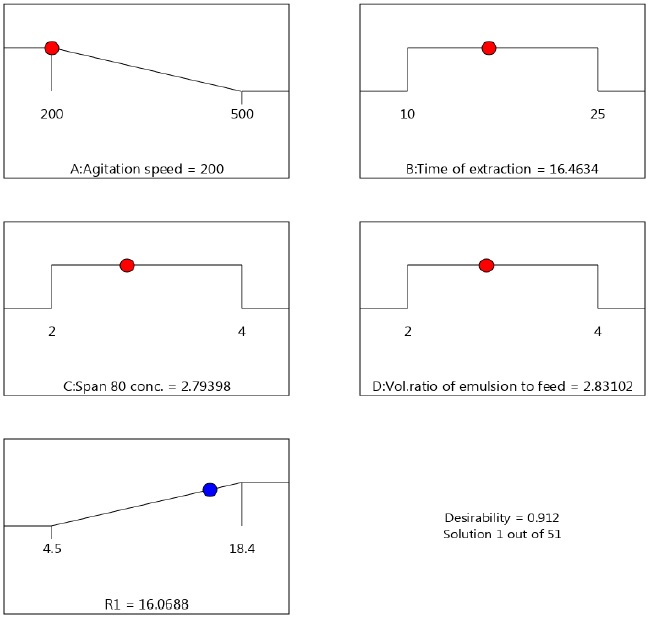
The parameters affecting the % dealcoholization were optimized using desirability function. Desirability function is a popular technique for the determination of optimum parameters affecting a response. It ranges from zero outside the limits, to one at the goal. In the Design-Expert 13 software, there is an option ‘Numerical optimization’, under which, the goal fields for response have five options: none, maximum, minimum, target and within range. In the present work, ‘Numerical optimization’ of the software has been chosen in order to find the specific point that maximizes the desirability function (% dealcoholization). For stirring speed, we selected ‘minimize’ in order to minimize power requirements.
The program seeks to maximize this function. The goal seeking begins at a random starting point and proceeds up the steepest slope to a maximum. Other variables were selected as ‘in the range’. The results of optimization are shown in Figure 8 which shows the ramp desirability of solution 1 that was generated via numerical optimization (Agitation speed =200 rm, Time of extraction =16.46 min, Concentration o Span 80=2.79 %, Volume ratio of emulsion to feed =2.83). 16.46 % dealcoholization was predicted at this point. For validation of this Solution 1, a confirmatory experiment was conducted at optimum results, which showed that 16.28 % was observed. Hence, although according to Table 2, Run.25 gave the optimum parameters as 350 rpm, 17.5 min, 3% concentration of Span 80 and feed to emulsion ratio of 3, the results obtained through numerical optimization were considered to be optimum due to lower agitation speed in the latter (350 rpm versus 200 rpm).
3.4. Multistage extraction
As explained in Section 2.5, multistage extraction was conducted. It was observed that, the % dealcoholization increased to 38.74 %, 69.17% , 81.36 %, 89.63% and 91.46 % after 2nd, 3rd, 4th, 5th and 6th stages of extraction. Since there was no significant difference between results of 5th and 6th stage of extraction, no more extraction stages were carried out.
3.5. Comparison of results obtained with previous work
In the work of (Chanukya & Rastogi, 2010) lecithin was used as surfactant, paraffin oil was used as diluent. In the present work, Span 80 and kerosene were used as surfactant and diluent, respectively. The optimum conditions membrane emulsion to feed volume 1:2, lecithin concentration 3%, contact time 20 min and stirring speed 250 rpm, which resulted in maximum alcohol extraction (∼25%). The alcohol was completely removed after seven stages of liquid membrane extraction. However, in the present work, single stage extraction was 16.28 % which was lower than earlier work. Further, after 6th stage extraction, the maximum extraction was 91.46 % was achieved. The differences in results obtained may be due to differences in diluents, surfactants. Also, the lower results obtained in our work might be due to low rpm used during preparation of emulsion (3000 rpm).
4. Conclusions
Anthocyanins were extracted from red cabbage using ethanol-water mixture and the residual alcohol was removed from anthocyanin extract using a liquid emulsion membrane. The response surface methodology was used in the present study to optimize the parameters affecting alcohol removal. The influence of independent variables on % dealcoholization was studied by analyzing 3D surface graphs and contour graphs. It was shown that the results predicted by the second-order polynomial model and experimental results closely agreed with each other. The suitability of the model was evaluated by a detailed statistical analysis which included an analysis of coefficients of regression, lack of fit, Fisher’s variance ratio, adequate precision and p-values of each parameter, square terms and mutual interaction terms. Among all parameters, the concentration of surfactant was most significant. A multistage extraction improved the results; however, after the six-stage extraction, there was no significant increase in the extent of alcohol removal.

