


 text new page (beta)
 English (pdf)
 Article in xml format
 Article references
 Send this article by e-mail
 Cited by SciELO
  Similars in
SciELO
Similars in
SciELO 
 Permalink
1.INTRODUCTION
Signal conditioning is an essential topic in the process of designing readout circuits, where the most important information of the sensors are the physical and electrical characteristics. Despite the fact that essential parameters are provided by sensors datasheet, there are some manufacturers which do not offer some or the whole technical information. Therefore, it is necessary to find the optimal valúes which describes them appropriately and adjust the electrical model to the real device responses. Also, it is important for testing purposes, to evalúate its behavior in the intended environment.
Electrical parameters are the most common measurements and among them, voltages and currents are the simplest to acquire. In case of semiconductor based devices, in special MOSFETs and derived ones such as ISFETs (Bergveld, 1981), they rely on those magnitudes to extract their fundamental parameters (Haddara, 1995).
To obtain these valúes it is nevertheless required a specialized equipment (Keithley, A Tektronix Company, 2016b). Taking the ISFET as an example, at least 3 SMUs and a parameter analyzer are needed (Martins & Rangel, 2012; Yusof et al, 2013). Although SMUs provide a plenty of features to an aecurate measurement (Keysight, 2016), in some cases, only a few of them are required to obtain the desired response.
For many applications such as device characterizations, SMUs combines capabilities from a precisión power supply and a digital multimeter, incorporating a great speed and resolution, four-quadrant operation and sweeps (Cejer. Tucker, & Weng, 2013). All of them are employed in a wide range of applications, for instance, nanomaterials, energy efficiency, material characterization, semiconductor structures and so on (Keithley, A Tektronix Company, 2016a, 2016c).
However, there are some which do not demand exhaustive precisión, high voltages or currents; moreover, considering that its cost makes this solution unaffordable when it is part of small projects. For example, in low power devices such as ISFETs, whose currents are up to 80(UA and voltages do not exceed 2.0V. Additionally, their resolution is not a critical issue when performing qualitative measurements.
ISFET characterizations are analyzed from the I D vs V D and I D vs V G curves. Previous work shows some techniques to acquire this data. For example, (Rani, Syono, & Ramli, 2008) got these curves using Agilent semiconductor device analyzer, (Mayorga, Aldana, & Rodriguez, 1997) have presented a system based in a microcontroller to obtain them, while (Villalpando, Miranda, Martinez, & Martinez, 2012) got the curves using a HACH Measurement instrument. All of the cited authors have presented different systems to obtain the current and voltage curves, and these results show the performance of the ISFET device for different conditions.
Acquiring data is usually not enough as storing it in some way is also important. For these approach it is demanding a PC communication to record and visualize such information. Solutions found employ LabVIEW and MatLab (Catelani & Ciani, 2013; Midili, 2012) to perform this function. However, being a proprietary software, limits its use to computers with an active license only.
Hence, the aims of this work are to provide a low-cost system which could acquire the current-voltage characteristic from MOSFET based sensors, transfers this data controlled via a PC and provide a platform to add different scripts for analysis without restrictions of licenses.
2. SYSTEM DESIGN AND DEVELOPMENT
The proposed system involves an electronic and computational approach to obtain the characteristic of the sensor based on MOSFET. This system is composed by a voltage generator to stimulate the sensor and a current measure to capture its response (Figure 1).

It is constituted by three main components: the hardware deployment, essentially conformed by a MCU, the firmware, which manages the hardware in first instance and the software environment, which interaets with the user.
Open source platform of hardware and software was used to develop the system, henee it is designed to perform two modes of operation: automatic and manual. The manual mode allows the user to change the voltage source valué either to the next or previous step, while the automatic mode changes this valué automatically, generating an escalator waveform.
In comparison with existing solutions, this design allows to choose different voltage source varying its waveform (ramp, escalator, constant and others). Moreover, it allows to add scripts to analyze and process data (FFT, filters, arithmetic operation).
An ISFET sensor was used to test the system and experiments were conducted to obtain current and voltages measures for different pH valúes. The results provides the curves V DS -I DS and VGS-IDS to extract the sensor characteristics.
3. HARDWARE DESCRIPTION
As the system is thought to be used as a characterization instrument, is precise to provide it the ability to interact with external signáis. This means, it must include some components such as ADCs and DACs to genérate and acquire analogue stimulus. Additionally, as current is an important magnitude to be measured, a transducer is attached to convert them to voltages.
The control of each component is performed remotely as well as the visualization, so it includes an UART module to communicate with the CPU. In addition to this, an external interruption is provided to control some basic functions manually.
As it is shown in Figure 2, there is a microcontroller which is responsible to perform the required functionality and an external board to measure the sensor current response.

The MCU owns two DACs, two ADCs and two timers, whose control is passed through the microprocessor to the external interruption and the UART module. Both ADCs are connected to the timer TIM8 which triggers and regulates the time between two successive conversions. The another timer, TIM6, is connected to the DAC in order to trigger it and establish the step period in the escalator waveform.
The auxiliary board is committed to perform analogue features as it is responsible to transform current into voltage levéis. It is essentially comprised by a transimpedance amplifier (TIA) which receives the current from the sensor and, via a resistance in feedback, converts this current into a voltage signal. As the current is positive the voltage output is higher than the voltage in the reference terminal attached to the DAC2 output.
4. FIRMWARE DESCRIPTION
As soon as the module is power on, all the components required are initialized and started in the MCU. The process starts with the main clock activation and the routine of initialization. Afterwards, the peripherals (DACs, ADCs, Timers and GPIOs) and communication modules (UART) are initialized.
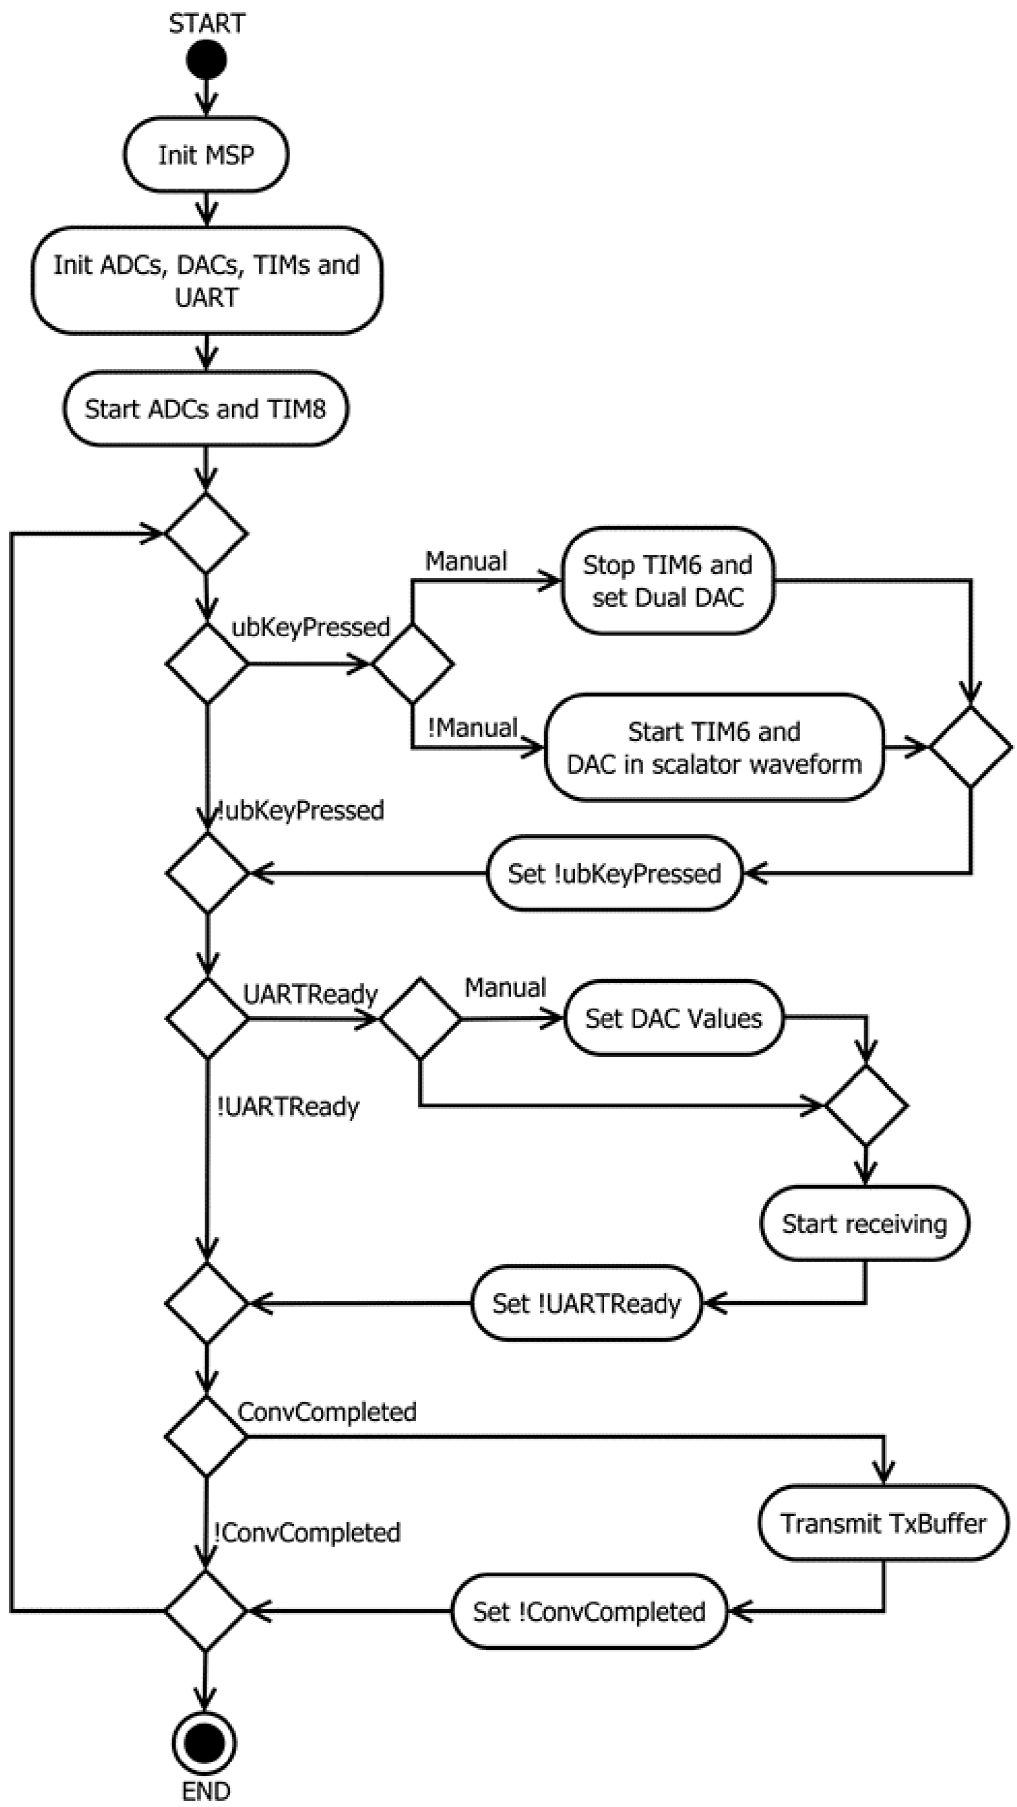
The Figure 3 shows the main process executed in the MCU. As soon as the components are initialized, the ADC and TIM8 start their activity enabling the acquisition process. Then, an infinite loop starts, where it is performed the MCU behavior change as well as the communication via UART, both for transmission and reception purposes. There are four flags used to control the process. Those are: ubKeyPressed, manual, UARTReady and ConvCompleted.

The ubKeyPressed flag which indicates an external interruption and used to change the operation mode.
The manual flag used to store the operation mode, manual or automatic, depending on its state.
The UARTReady, which sets the DAC valué, based in the instruction obtained from the UART, either to the next or previous one, depending if the manual flag is set. Then, it starts again the receiving process and disable the flag.
The ConvCompleted, which transmits the transmission buffer via UART with information about ADC, DAC, TIM and Control.
The flags mentioned before are disabled by default, and they are activated in the interruption processes. There are three considered in this firmware: the external interruption, the ADC conversión completed interruption and the UART reception completed interruption.
External interruption. This interruption allows the user to switch between the manual and automatic operation mode. It is done through toggling the ubKeyPressed flag.
-
ADC conversión completed. This interruption extract data from ADCs and store in the transmission buffer. Then when it reaches a certain number of times (10 in this case), the process appends the DAC value, TIM register and control flag. Finally, it sets the ConvCompleted flag. This is shown in Figure 4.
-
UART reception completed. Based on the valué received, it compares with strings to determine the functions to be performed. In this case, the strings used were: "nn" for the next instruction, "pp" for the previous instruction, "aa" for the automatic instruction and "mm" for the manual instruction. Manual or automatic instructions actívate ubKeyPressed and manual flags, simulating the external interruption and setting the corresponding mode. Next or previous instructions check the data to prevent overflow, and then sets the DAC to its corresponding valué. This is depicted in Figure 5.

Another important topic to highlight is the data sent by the UART. In this case, it has the ASCII format so it is easier to debug in any serial terminal. On the other hand, besides that UART operations demand larger CPU times, it is convenient to send more data in each message rather than only few bytes which could imply more information losses. The approach considered here is storing the data acquired in a temporary buffer while UART is being used, until it is sent in the next transmission process.
The data frame has the following structure:
 (1)
(1)
The "ADC1" and "ADC2" correspond to the conversions obtained from the ADC1 and ADC2 in the module. Then "DAC" represents the valué established in the DAC2, the "TIM" is the timer register and "Ctrl" corresponds to the manual flag used as a feedback for the software environment.
5. SOFTWARE DESCRIPTION
The software environment consist of two main modules which are the SerialModule and the GUI. The first one runs in background and performs the operation to communicate with the hardware while the second one, constitutes the foreground and serve as platform to interact with users. Figure 6 portraits these two components.

The GUI component is inherited from MeasureMainContents which is inherited also from MainWindow. The last one is used to provide the external tools (menubar, statusbar, toolbar, contextmenu), general for every application window while MeasureMainContents places the components required to communicate with serial module. These components are:
ConnectionModule. Provides functions to enter the serial parameters. This is presented to users as a dialogue via SettingsDialog.
ControlDACModule. Provides buttons to switch between operations modes. Also, it includes two more buttons: Next and Previous to change valúes in the DAC when is in manual mode, and shows the timer counter as a progress bar when is in automatic mode.
ControlButtons. Allows the user to start acquiring data from serial module and interacts with the hardware. For these functions, the module has two buttons, one to start the process and another to finish it.
LivePlotting. Render data acquired from serial. It also has a cursor to show current valúes at a certain position.
RecordingModule. Allows the user to record data acquired from serial and saves that in a plain text file.
On the other hand, the SerialModule is able to communicate with the hardware, providing some functions to receive information from the GUI and set variables to this one. The principal functions are:
Settings. Which receives information from the ConnectionModule and configures the parameters of the serial port.
ThreadRead. Which implements an independent thread to acquire data from the serial port. It sets internal variables of LivePlotting to render the waveforms and stores data acquired in a temporary file while the recording module is active. In addition to this, it sets the information regarding the current valué in the DAC and the timer counter.
ThreadWrite. Also implements an independent thread and sends commands to the hardware from the GUI. This receives information from the ControlDACModule, to send the manual ("mm") or automatic ("aa") mode controls, or the previous ("pp") or next ("nn") instruction controls.
The sequence of operation in the software is depicted in Figure 7. Here, when the user open the program it immediately creates the interface modules and the serial module.

Then, through the ConnectionModule, the user could open a Dialogue to set the serial port parameters and these valúes are returned to the main module and set in the serial one. The interaction process between the software and hardware starts once the user press the start button. This action creates two threads with the functions provided for the serial module to read and write in the serial port. Henee, the read and write processes are enabled.
The read process consists in continuous requests made from the thread to the serial port. This returns the read valué and based on the information provided, updates variables in LivePlotting and ControlDACModule. The writing process is a result of the user interaction, which changes a valué in the ControlDACModule. Then, this sends the message to the thread which, at the same time, writes to the serial port.
Finally, once stop button is pressed, the stop routine is triggered, destroying the threads created before and stopping the visualization, data acquisition and interaction process.
Data acquired from the software need to be processed later to obtain the characteristic curves. The processing steps are depicted in Figure 8. It comprises a series of filters to remove the noise introduced by external sources as well as the quantization process in ADCs. Those steps are:

Median filter. Which removes impulsive noise in the signal presented as discrete discontinuities with no correspondence with the curve tendency.
Moving average filter. Used to remove irregularities due to different noise sources including those occasioned by quantization process in ADCs.
Mask. Used to classify each segment in the signal which represents a particular point in the current-voltage curve, result of the characterization process.
Mean. Used to obtain the representative valué for each segment classified by the mask. The set of valúes obtained constitutes the full current-voltage curve.
The process mentioned before is applied to each curve obtained from the measurement system so a set of curves is obtained after the processing task corresponding to the curve family for a particular test.
6. IMPLEMENTATION
The hardware component is formed by the microcontroller STM32F407VGT6 (STMicroelectronics, 2016c, 2016b) which is part of the STM32 F4 Discovery board (STMicroelectronics, 2016d).
The toolchain used to program the main MCU was System Workbench for STM32 (AC6, 2016), from AC6. Additionally, the HAL drivers (STMicroelectronics, 2016e) and examples (STMicroelectronics, 2016a) provided in STM32CubeF4 (STMicroelectronics, 2015, 2016f) were used to manage the MCU configuration. Table 1 shows STM32 microcontroller characteristics.
An auxiliary board is designed to convert the current, produced by interaction between the test solution and ISFET, into a voltage signal. This circuit is based on a TIA, which is comprised by a LM324 operational amplifier and a resistance in feedback (R f ). Where R f valué is selected in function of the ISFET characteristics such as the máximum current tolerance of 80µA and the máximum voltage of 2.0V. Considering a battery operated system with 3.6V, the TIA voltage output must be under this valué. In the worst case, this voltage is 2.0 + 80µ A R f , then R f value is chosen approximately equal to 20kὨ.
Table 1 Microcontrollers characteristics
| Name | Characteritics |
|---|---|
| CPU | ARM 32-bit cortex-M4 |
| FREQUENCY | 168 MHz |
| ADCs | 3x12-bit, 2.4MSPS or 7.2 MSPS |
| DACs | 2x12-bit,2.4 MSPS |
| COMUNICATTIONS | 2xUARTs, 3Xspi, 3x12C, 2Xcan, SDIO |
The software implementation was made in python via the Python(x,y) distribution (Raybaut & Davar, 2015). It includes a range of librarles to do numerical calculations such as numpy (NumPy developers, 2016). The interface was implemented using PyQt librarles (Riverbank, 2016). In addition to this, the pyqtgraph module (Campagnola, 2016) was installed to implement the monitoring widget.
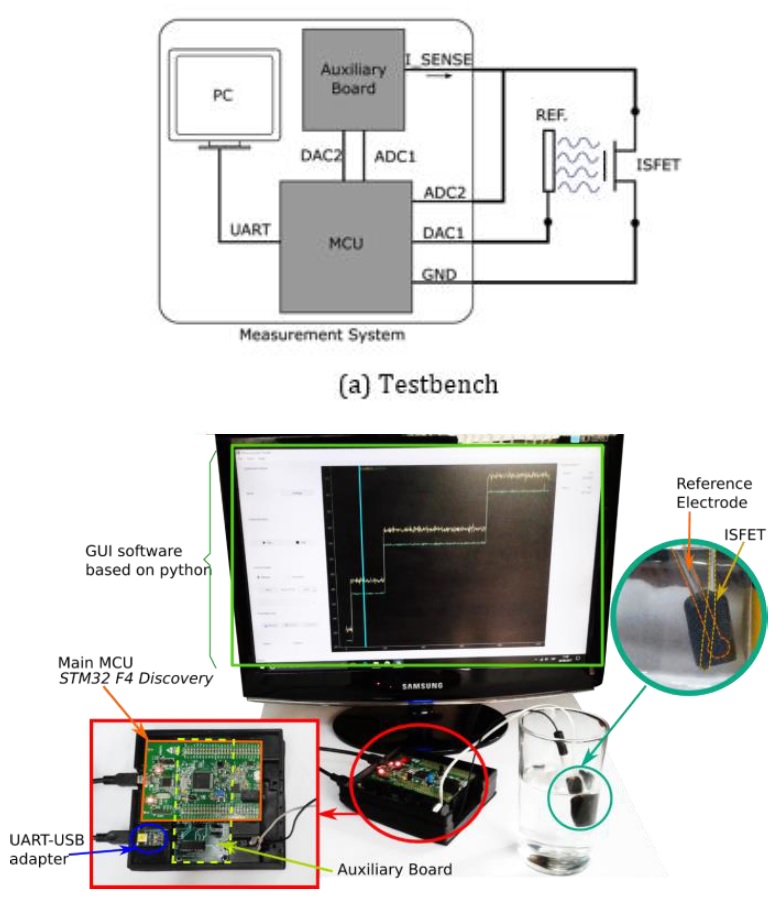
7. TESTBENCH CIRCUIT
In order to test the system functionality it was connected to probé an ISFET sensor (Bergveld, 1981). This device has the particularity to respond to pH changes with variations in its drain current. However, to characterize this sensor is required to obtain its characteristic curves, from which extract its parameters. The ISFET current equation is very similar to the MOSFET as it is presented in (2).
Where K is the transconductance coefficient characteristic of the ISFET material, W is the channel width, L is the channel length and V TH ISFET is the threshold voltage which has a dependence with has a dependence with respect to the pH of the test solution.
As the ISFET has a similar behavior as the MOSFET, the circuit to test this device not differ too much from the last one (Liou, Ortiz-Conde, & García-Sánchez, 1998; Martins & Rangel, 2012). In fact, the employed circuit consists in two sources which provide the V GS and V D s voltages. These sources are both DACs in the measurement system. Additionally, one ADC is connected to the TIA output from the auxiliary board and a second ADC to the V D terminal. This scheme is shown in Figure 9(a). The device used in this experiment was manufactured by WINSENSE which has a máximum current tolerance of 80µA, while V DS voltage should not exceed 2.0V (WINSENSE, 2016).
8. RESULTS
Once the system testbench was appropriately connected, an automatic measurement process was started to obtain the valúes of the gate-source voltage (V DS ), directly from the ADC attached to the drain terminal, and the drain current (I D ) from the difference between the first one and the ADC connected to the TIA output. The voltage range provided by the DAC in V DS (which performs the escalator waveform) is between 40mV to 1.93V accomplishing the device tolerance.
The implementation with the mentioned conditions is shown in Figure 9(b), where all devices are put together to perform the test and to extract the required data. The software GUI developed in python is presented in Figure 10, pointing out each of its components.

Data obtained from the measurement system is depicted in the Figure 11. An automatic test is executed where an increase of voltage is performed each 10 seconds. The generated waveform is an escalator where the voltage from TIA is above the voltage reference and the difference between them is proportional to the current in the sensor. As the total of steps per curve is 42 in a complete test, the time per test is approximately 420s=7min.

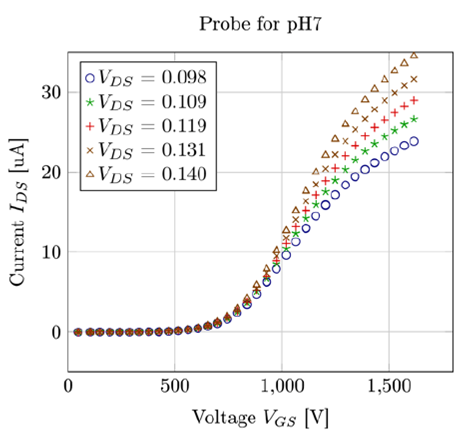
In the Figure 12 and Figure 13, results of two group of measurements are depicted after their processing. Those were taken in different times and processed later employing the algorithm presented in Figure 8 to obtain the voltage and current valúes required to characterize the device. The voltages used to stimulate the sensor were 750mV and 850mV at V GS , placed in a 7.0 pH buffer both.

As it is shown, there are some differences among those measurements, regarding the variation of temperature and hysteresis presented in the ISFET.
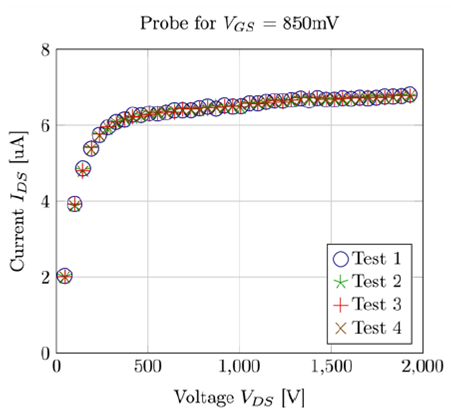
Figure 14 shows the curve I D s vs V DS for different valúes of V GS and a pH=7. These results show the ISFET sensor characteristics for different reference voltages V GS .

Figure 15 shows the variation of I D s for different V D s- The results of these curves allow to calcúlate the threshold voltage V TH and saturation current I s from which it is possible to extract the transconductance coefficient K = u e ffC e ff necessary to introduce in the device model presented in (2) (Martinoia & Massobrio, 2000: Tomaszewski, 2007).
9. CONCLUSION
To obtain electrical parameters of sensors is necessary to use SMUs and a parameter analyzer, which can represent a costly solution. In this paper, open source tools are employed to develop a low-cost measurement system based on embedded devices in order to characterize sensors and fit their electrical model to real devices. Thanks to the flexibility of being programmable and its ability to manage analogue components, the system provides a sufficient tool toanalyze sensors behavior and extract from measurements the main parameters which govern their responses.
The system was tested with an ISFET device and the V-I curves obtained show a great agreement with the theoretical parametric curves. Despite of noise introduced by connections, it is not significant as it could be removed easily with some processing tasks. However, it is only useful if currents are higher than 0.02fiA as it is the precisión for the given system. On the other hand, this is limited to DACs current constraints, which are up to 280fiA (STMicroelectronics, 2016c).
Future works will be oriented to extend its capability to other sensors incorporating more electrical parameters such as capacitance or resistance. Additionally, the feature to restrict current levéis will be implemented.
CONFLICT OF INTEREST
The authors have no confhcts of interest to declare.

