


 text new page (beta)
 English (pdf)
 Article in xml format
 Article references
 Send this article by e-mail
 Cited by SciELO
  Similars in
SciELO
Similars in
SciELO 
 Permalink
1. Introduction
Materials, which can replace a body part or function of the body part in a safe and reliable manner are called biomaterials. Biomaterials need to be inert and mechanically stable enough to bear the load of the human body. Every year approximately 250,000 knee replacements and 1 million hip replacements are carried out (Sculco, 1995). It is estimated that this number will double up to 2025 as a result of ageing populations and growing demand for a higher quality of life (Kurtz, Ong, Lau, Mowat, & Halpern, 2007; Rakhorst & Ploeg, 2008). Biomaterials are expected to work satisfactorily in body environment, where the pH value of body fluid varies from 1 to 9. Titanium alloys and stainless steel are frequently used in total hip replacement (THR), but the main risk with metal alloy implants is the release of metal ions due to wear and creating a negative effect like aseptic loosening caused by adverse biological reactions due to wear products. Therefore metal-on-UHMWPE bearing became advantages or preferable to the metal-on-metal system (McKellop, Shen, Lu, Cambell, & Salovey, 1999; Muratoglu et al., 1999).
Biocompatibility of Si3N4 has presented it an attractive alternative in the area of biomaterials (Howlett, McCartney, & Ching, 1989). Bearings made of ceramics have low wear properties that make them suitable for total hip arthroplasty (THA) and total knee arthroplasty (TKA). When compared to cobalt chrome (CoCr)-on-polyethylene (PE) articulations, ceramics offer drastic reductions in bearing wear rates. As the search for the ideal total joint bearing material continues, Si3N4 is applicable in thebiomedical field for various applications like bearing for spine disc surgery and prosthetic hip and knee joints also been developed with Si3N4 (Bal et al., 2008; Neumann et al., 2006). Bal and Rahaman (2012) covered scientific rationale for the use of Si3N4 in the orthopaedic application. Biomaterials with minimum wear rate are needed in the orthopaedic field; research in this area is trying to evaluate biomaterials with minimum wear rate and consequently extending the life of the body part replaced. Si3N4 shows excellent wear resistance and Si3N4 bearing for arthroplasty applications are investigated by Amedica Corporation (Salt Lake City, UT). Mode of failure in THR is related to the area of tribology, i.e., wear of cup and head. It is desirable to reduce the generation of wear particle in the implant to avoid aseptic loosening and failure of THR. Olofsson et al. (2012) did a sliding contact wear test using a pin-on-disc tribometer with Si3N4 and a CoCr disc against Si3N4 and Al2O3 ball in the presence of phosphate buffered saline (PBS) and bovine serum. Si3N4 sliding against Si3N4 showed the formation of tribofilm on Si3N4 controlling friction and wear in both PBS and bovine serum comparable to other pairs. Low wear rate and biocompatibility of Si3N4 presented it as a good candidate for hip joint replacement. Hexagonal boron nitride (hBN) is well known, biocompatible solid lubricating material (Gangopadhyay, Jahanmir, & Peterson, 1997; Saito, Imada, & Honda, 1999; Shah, Glavatskih, & Antzutkin, 2013). Incorporation solid lubricant in Si3N4 can be considered to improve the tribological performance of Si3N4. Carrapichano, Gomes, and Silva (2002) conducted sliding wear test on a pin-on-disc tribometer for Si3N4-BN composite in a self-mated pair, with 10, 18 and 25% vol. of BN in Si3N4. They concluded that the addition of boron up to 10% improved tribological properties of Si3N4 but further addition affects the mechanical properties of Si3N4. Chen, Gao, Wang, and Li (2010) investigated the sliding wear behaviour of the Si3N4-hBN composite with 0, 5, 10, 20 and 30% vol. of hBN in Si3N4 against Si3N4 using a pin-on-disc (PoD) tribometer. They reported that the friction coefficient reduces up to 0.19 for 20% vol. of hBN in Si3N4.
To understand and evaluate the performance of any process, experimentation is necessary. In the field of testing, the design of experiment (DoE) - Taguchi method is efficient to plan and analyze the results of the experiment (Antony, 2008). Patnaik, Satapathy, Mahapatra, and Dash (2009) implemented DoE-Taguchi design technique to study the tribo-performance of polyester hybrid composites. The result presented that glass-polyester composite without any filler suffers greater erosion loss than the hybrid composite with alumina filling. Lastly, the results were optimized using a genetic algorithm. Asiltürk and Nes¸eli (2012) optimized the turning parameters in a CNC turning using the Taguchi method, and the response surface analysis showed the applicability and effectiveness of the Taguchi method in the field of optimization. Sait, Oughali, and Al-Asli (2016) utilized Tabu search, and simulated annealing algorithm to tackle the problem of design 3D integrated circuits; comparison of results showed that both these techniques produce high-quality results. Rambabu, Balaji Naik, Venkata Rao, Srinivasa Rao, and Madhusudan Reddy (2015) implemented RSM for developing a mathematical model for corrosion resistance of friction stir welding as a function in terms of welding parameters and this mathematical model optimized using simulated annealing algorithm to maximize the corrosion resistance.
The aim of this study is to evaluate the wear behaviour of the Si3N4-hBN composite against steel under different loading conditions considering the application in the field of orthopaedics. In this work, we implemented the DoE-Taguchi method to plan and analyze results to find the optimal combination of load and proportion of % volume of hBN in Si3N4 for minimization of wear rate. Using experimental results the mathematical model proposed and processed with simulated annealing to find the optimum combination of load and % volume of hBN in Si3N4 for minimization of wear rate.
2. Materials and methods
2.1. Preparation of samples
Si3N4-hBN composites prepared with 0, 4, 8, 12 and 16% vol. of hBN mixed in Si3N4. The mixing of Si3N4 and hBN is performed with a ball mill. The pin samples were prepared at uniaxial hot-pressing at 30 MPa, 1600 ◦C and 60 min dwell time with polyvinyl alcohol as an additive. The pin dimensions were 10 mm diameter and 15 mm long. Tables 1 and 2 shows the properties of sintered specimens and a steel disc, respectively.
Table 1 Properties of sintered sample. a
| Sample | 1 (4% vol. of hBN) | 2 (8% vol. of hBN) | 3 (12% vol. of hBN) | 4 (16% vol. of hBN) | 5 (0% vol. of hBN) |
|---|---|---|---|---|---|
| Density (gm/cc) | 1.96 | 1.96 | 1.93 | 1.84 | 2.04 |
| Vickers hardness (MPa) | 2775.88 | 2318.17 | 1741.07 | 907.96 | 7484.51 |
a Testing at Central Glass and Ceramic Research Institute, Kolkata (India).
2.2. DoE-Taguchi methodology
The Taguchi method was developed by Genichi Taguchi for planning experiments and to investigate how different factors affect the mean and variance of a process characteristic. Orthogonal arrays, the experimental design proposed by Taguchi, helps to organize the factors influencing the process and the levels at which they should be varied; it contributes to collect the necessary data to determine which factors most affect product quality with a minimum amount of experimentation, thus saving time and resources. The proper orthogonal array can be selected with knowledge of the number of factors and their levels. The experiments were carried out to analyze the influence of testing parameters on the wear rate of composite made of Si3N4 and hBN. The factors and corresponding levels are illustrated in Table 3.
Table 3 Designed experimental factors and levels.
| Factors | Level 1 | Level 2 | Level 3 | Level 4 | Level 5 |
|---|---|---|---|---|---|
| Load (N) | 5 | 10 | 15 | 20 | 25 |
| % vol. of hBN | 4 | 8 | 12 | 16 | 0 |
Load and % volume hBN are two factors selected at five levels as shown in Table 3. Therefore L25 orthogonal array selected, in total 25 experiments were carried out; each experiment repeated twice to maintain consistency, with the aim of relating the influence of load and % volume of hBN on wear rate.
2.3. Wear test procedure
The wear tests were conducted on a Ducom TRLE-PMH400 pin-on-disc tribometer having a maximum normal load capacity of 200 N. Figure 1(a) shows a schematic arrangement of loading used for testing and Figure 1(b) shows the experimental setup used for testing. Tests were performed according to ASTM F732 standards (ASTM F732-00, 2011). During test composite used as pin specimen loaded through a vertical specimen holder against a flat steel disc as counterface rotating at a speed of 200 rpm for a 20-min duration. Before tests, the flat surface of the pin was abraded with grit paper. Tests were conducted in a dry environment without lubricant and at atmospheric condition. Table 4 shows the average value of wear rate for all 25 experiments.
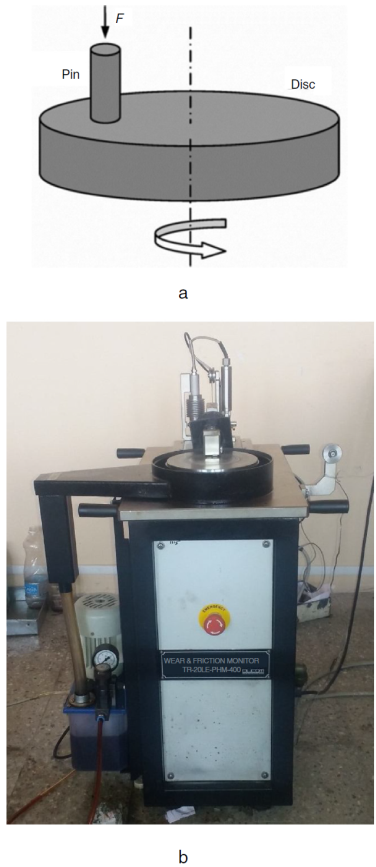
Table 4 Results for wear rate (WR) and S/N ratio.
| Expt. No. | Load (N) | % vol. of hBN | Avg. Vol. wear rate (mm3/m) | S/N ratio (dB) |
|---|---|---|---|---|
| 1 | 5 | 4 | 0.667 | 3.51659 |
| 2 | 5 | 8 | 0.065 | 23.71267 |
| 3 | 5 | 12 | 0.038 | 28.39201 |
| 4 | 5 | 16 | 0.421 | 7.51621 |
| 5 | 5 | 0 | 0.498 | 6.05037 |
| 6 | 10 | 4 | 0.221 | 13.09447 |
| 7 | 10 | 8 | 0.148 | 16.59237 |
| 8 | 10 | 12 | 0.065 | 23.67333 |
| 9 | 10 | 16 | 0.859 | 1.31969 |
| 10 | 10 | 0 | 1.529 | −3.69063 |
| 11 | 15 | 4 | 0.062 | 24.13223 |
| 12 | 15 | 8 | 0.187 | 14.56408 |
| 13 | 15 | 12 | 0.013 | 37.98933 |
| 14 | 15 | 16 | 0.484 | 6.31125 |
| 15 | 15 | 0 | 0.262 | 11.64904 |
| 16 | 20 | 4 | 0.549 | 5.19476 |
| 17 | 20 | 8 | 0.356 | 8.98075 |
| 18 | 20 | 12 | 0.212 | 13.48807 |
| 19 | 20 | 16 | 0.944 | 0.49931 |
| 20 | 20 | 0 | 0.206 | 13.71968 |
| 21 | 25 | 4 | 0.115 | 18.76422 |
| 22 | 25 | 8 | 0.519 | 5.68877 |
| 23 | 25 | 12 | 0.476 | 6.45051 |
| 24 | 25 | 16 | 0.787 | 2.08272 |
| 25 | 25 | 0 | 0.467 | 6.60922 |
2.4. Taguchi-SA approach for modelling and analysis of wear behaviour
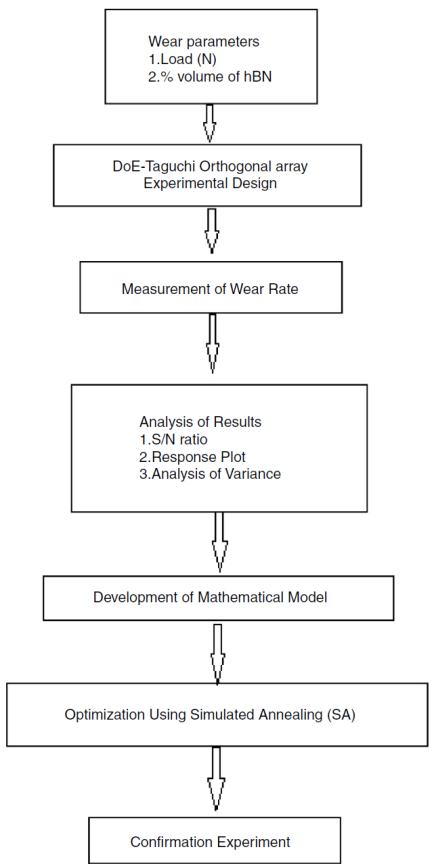
Integrated Taguchi-SA approach used for modelling, analysis, and optimization of wear behaviour of the Si3N4-hBN composite. Figure 2 presents the steps of the integrated Taguchi-SA approach applied for optimization.
3. Results and discussion
3.1. Signal-to-noise (S/N) ratio analysis
Experiments were performed on a pin-on-disc tribometer with two input parameters and wear rate of a specimen as output. Wear rate calculated for sliding distance covered by pin during 20 min duration and speed of disc 200 rpm at corresponding wear track diameter. Taguchi recommended the use of signal-to-noise (S/N) ratio measured by the deviations of characteristics from the target value. The experimental results are further transformed into signal-to-noise (S/N) ratio. The significance of the controllable factor is investigated using S/N ratio approach. A smaller of wear rate is expected to extend joint life. Therefore, in this study a S/N ratio with a smaller-the-better methodology was used for wear rate and calculated as follows:
where y 1, y 2 and so on = experimental results/observation, n = number of experiments (i . . . n).
Irrespective of the category of the performance characteristic, the higher value of S/N ratio corresponds to a better performance (Kamaruddin, Khan, & Foong, 2010). The maximization of S/N ratio signifies maximization of the desired effect (minimization of wear rate) against noise factor. Observation of the response table of the S/N ratio gives an optimal combination of input parameters for the required output characteristic. From Table 4, expt. 13 offers an optimal combination of 15 N load and 12% vol. of hBN for a minimum wear rate of 0.013 mm3/m with a maximum S/N ratio of 37.98933 dB.
3.2. Response plot
The interaction plot represents the interaction effect of control factors on performance characteristics, showing the minimum value of wear rate at the interaction of 15 N load and 12% vol. of hBN in Figure 3 and the maximum value of S/N ratio at the same combination in Figure 4 prepared with Minitab 17.

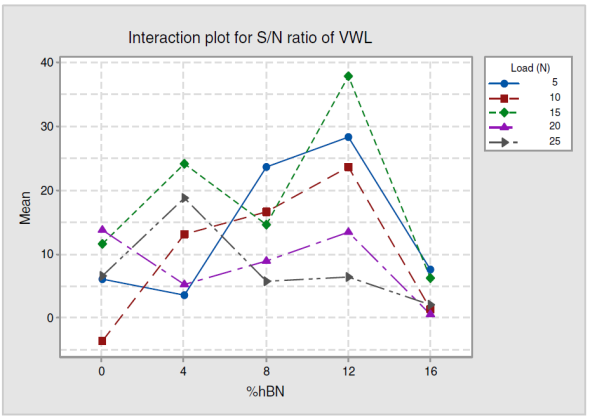
From the interaction plot, for wear rate and S/N ratio, it is clear that wear is affected by the interaction of load and % volume of hBN. The interaction plot also presents an optimal combination of 15 N load and 12% vol. of hBN for minimum wear rate of 0.013 mm3/m.
3.3. Analysis of variance (ANOVA)
ANOVA standard statistical technique used to interpret experimental results. The analysis of variance is used to study the parameter combinations which significantly influence the output response, i.e., wear rate. The study was conducted at 90% of confidence level. The results of the variance analysis are given in Table 5.
Table 5 Analysis of variance for wear rate.
| Source | DF | Seq. SS | Contribution | Adj. SS | Adj. MS | F value | P value |
|---|---|---|---|---|---|---|---|
| Load (N) | 4 | 0.3921 | 13.06% | 0.3921 | 0.09804 | - | - |
| % vol. of hBN | 4 | 1.0519 | 35.04% | 1.0519 | 0.26296 | - | - |
| Load * | 16 | 1.5578 | 51.89% | 1.5578 | 0.09736 | - | - |
| %Vol. of hBN | |||||||
| Error | 0 | - | - | - | |||
| Total | 24 | 3.0018 | 100% |
In the ANOVA table (Ghalme, Mankar, & Bhalerao, 2016):
● The degree of freedom (DF) is a measure of amount independent information available from the given set of data. DF for concerning factor is less than the number of levels.
● The sequential sum of squares (Seq SS) of factor measures the variability in data contributed by that factor. Total SS is the sum of SS of an individual factor and SS of error.
where y¯ i - is the mean of observation at ith factor level, y¯ - mean of all observation, y ij value of jth observation at theith factor level, n i - number of observation for ith factor level.
● Adjusted mean square (AdjMS) or variance is given by:
● Percentage contribution signifies individual contribution of a factor on the mean response. It is calculated by:
From the analysis of variance, it can be concluded that the interaction of load and % volume of hBN has the greatest contribution of 51.89% followed by 35.04% of % volume of hBN and 13.06% of the load on the wear rate of silicon nitride.
3.4. Morphology of worn surface
Worn surface of the composite material was examined using scanning electron microscope and energy dispersive spectroscopy (SEM-EDS) so as to understand the mechanism of wear. These micrographs were obtained after the tribological test at 200 rpm and a normal load of 15 N. SEM micrographs along with EDS are given in Figure 4. The mechanism of wear of the examined composite material is adhesive wear. In Figure 5, a consequence of adhesive wear can be observed because there was a pulling material from the contact area of the composite material. It was concluded by the visible traces in the form of cavities of irregular shapes and depth on the surface.

4. Optimization
4.1. Mathematical modelling
A second-order polynomial equation used to fit the experimental data using Minitab 17 statistical software. A quadratic model which includes the linear model can be described as:
where y is the response modelled as a function of constant, linear, interaction and quadratic terms formed from two predictor variables x 1 and x 2 , β 0 is the model intercept coefficient, β i (i = 1. . .5) are the coefficients of linear, interaction and quadratic terms, respectively, and ε is random error (MATLAB Stat Guide, 2010). From the experimental data obtained from Taguchi orthogonal array experimentation the final equations obtained in terms of coded factors-load and % volume of hBN for wear rate (WR) as follows:
ANOVA is used to evaluate the variability between predicted data by model and experimental data.
In ANOVA table:
● Variance ratio (F value): commonly called as F-statistics, is the ratio of variance due to the individual factor and variance due to the error term.
Table 6 presents ANOVA for model calculated at 90% confidence level.
Table 6 Analysis of variance for model.
| Source | DF | Seq. sum of square | Adj. mean sum of squares | F-Value |
|---|---|---|---|---|
| Model | 2 | 1.3927 | 0.6964 | 6.5582 |
| Error | 22 | 2.3360 | 0.1062 | |
| Total | 24 | 3.0017 | 0.1251 |
From F statistic table (Table 7) it is clear that the F-value calculated for the model is more than the F-value obtained from the design and analysis table (Ross, 2005) indicating that the model is significant.
4.2. Optimization using simulated annealing
Simulated annealing (SA), name and inspiration come from the annealing process in metallurgy, a technique involving heating and controlled cooling of the material to increase the size of its crystal and reduce their defects. Simulated annealing is a technique for finding an optimal (not necessarily perfect) solution to an optimization problem. If you are in a condition to find the maximum or minimum of something, your problem can likely be tackled with simulated annealing. The first use or idea of SA is derived from a paper by Metropolis, Rosenbluth, Rosenbluth, Teller, and Teller (1953) in 1953. The Metropolis algorithm simulates the cooling process for a system by gradually lowering the temperature of the system until the system converges to a steady, frozen state.
The algorithm for SA as follows (Kirkpatrick, Gellat, & Vechhi, 1983; Rao, 2009):
Start with an initial guess (X i ) and high temperature.
Generate a new design point (X i+1 ) in the vicinity of the current point randomly and find the difference in function values.
If Δf is positive, accept X i+1 as the next design point only with a probability e ΔE/kT . Otherwise reject point X i+1 . where k is a scaling factor, called Boltzmann’s constant.
When X i+1 is rejected, then repeat steps 2 and 3. To simulate the attainment of thermal equilibrium at every temperature, a predetermined number (n) of new points X i+1 are tested for any specific value of temperature T. If ‘Metropolis equilibrium’ is reached, go to step 5, else go to step 2.
If the current value of T is sufficiently small or even when the change in the function values (Δf) is to be sufficiently small, the solution has converged.
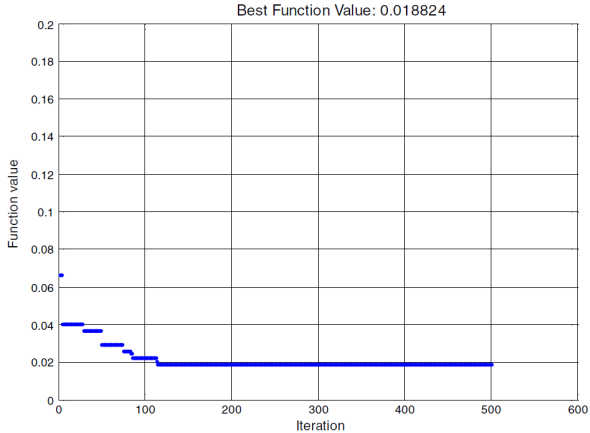
Using this algorithm code developed and simulated with MATLAB for Eq. (8), objective function wear rate to be minimized. The upper and lower bound of control factors are given in Eqs. (10) and (11). Results of the optimum value of the individual factors are shown in Table 8 with the best fitness plot illustrated in Figure 6.
Table 8 Optimum factor value and objective function value.
| Load (N) | % vol. of hBN | Objective function value - WR (mm3 /m) |
|---|---|---|
| 18.177 | 8.495 | 0.01882 |
5. Confirmation experiment
The optimal combination of control factors has been presented in the S/N ratio, response plot, and simulated annealing indicating that the interaction effect is significant for wear rate. The final step in any design of the experiment approach is to predict and verify improvements in the characteristic performance values through the use of the optimal combination level of control factors (Asiltürk and Nes¸eli, 2012). Table 9 shows the experimental conditions and results for the confirmation experiments conducted as per earlier conditions.
Table 9 Experimental factors and results.
| Expt. No. | Load (N) | % vol. of hBN | Expt. result - WR (mm3/m) |
|---|---|---|---|
| 1 | 50 | 12 | 9.7745 |
| 2 | 100 | 12 | 9.9641 |
| 3 | 150 | 12 | 9.2272 |
Confirmation experiments were conducted for 12% vol. of hBN sample for 50 N, 100 N, and 150 N load. The average value of wear rate found to be 9.6552 mm3 /m.
6. Conclusions
The application of Taguchi-SA optimization for wear rate minimization of the Si3N4-hBN composite is presented in this paper. Experiments were conducted using the DoE-Taguchi method at five levels of load and % volume of hBN in Si3N4. The objective function was to minimize wear rate. Table 10 shows optimum values for load and % volume of hBN obtained by Taguchi analysis and SA optimization for minimization of wear rate in Si3N4 against steel counterface.
Table 10 Results of Taguchi method and simulated annealing.
| Methodology | Load (N) | % vol. of hBN | Wear rate (mm3/m) |
|---|---|---|---|
| DoE-Taguchi method | 15 | 12 | 0.013 |
| Simulated annealing | 18.177 | 8.495 | 0.01882 |
Key findings drawn from the present investigations are:
Interaction of load and % volume of hBN has a significant contribution to the wear rate of Si3N4 , about 51.89%.
Both methods present different combination of load and % volume of hBN in Si3N4 , to minimize wear rate, which signifies that wear rate is a function of both control factors.
Silicon nitride-hexagonal boron nitride composite against steel is proposed combination for hip/knee joint replacement. Wear rate is a function of load and % volume of hBN, so while selecting the optimum proportion of hBN in Si3N4 for minimizing the wear loss corresponding load value must be considered.

