


 text new page (beta)
 English (pdf)
 Article in xml format
 Article references
 Send this article by e-mail
 Cited by SciELO
  Similars in
SciELO
Similars in
SciELO 
 Permalink
1. Introduction
The increase in complexity of machine tools, together with the increase in the cost of acquiring equipments and machine downtime, has attracted the attention of researchers toward the development of non contact structural health monitoring systems. The new developments in the global market have increased the competition by transforming modern manufacturing technology from mass production to lean manufacturing for enhancing SHM through sensor integration and online fault diagnosis. The purpose of SHM is to avoid wasteful activities to optimize profitability of products and services, to improve the information obtained about the condition of the machine tools being used, the status of the workpiece being processed, and in the manufacturing process itself. The monitoring of industrial operations and equipment is an essential component of a critical scheme that drives manufacturing industries toward being leaner and more competitive (Frankowiak, Grosvenor, & Prickett, 2005). Machining is the most widely used process in the manufacturing industry that removes unwanted material from a workpiece in the form of chips to achieve the desired product shape, size, accuracy, and surface quality. US industries spend US $100 billion annually to machine metals because the huge bulk of manufactured parts require machining at some phase in their production (De Garmo, Black, & Kohser, 1997). Monitoring machine health plays a really significant part in creating high-quality, low-cost components. In terms of the lean manufacturing concept, regularly scheduled machine maintenance and tooling replacement are vital in keeping the machine running at optimum conditions to avoid human and economic losses. As tooling is quite expensive, ideally, cutting tools should be maximally utilized to reduce manufacturing costs, so recent research focuses on the integration of online tool monitoring system method that can be performed automatically. Rotating machines are considered as the backbone of numerous industries, from gas turbines for producing electricity to turbo-machinery for generating power in the aerospace industry, and then it is important to run these machines safely over time to prevent any catastrophic failures.
1.1. Vibration as a diagnostic tool
Diagnosis is the process of determining machine condition from its signs or symptoms to detect what the fault is and which component of the system is affected. Various monitoring approaches like direct and indirect techniques can be put on to any application by adaptations and alterations, to accomplish an acceptable level of consequences. Direct techniques, such as vision and optical methods, measure the actual geometric changes in the cutting tool. These techniques are not widely used in real time operation due to permanent contact between the tool and workpiece, and also the presence of coolant and chips. Indirect techniques, such as force, vibration, temperature and acoustic emissions, are easy to implement to correlate the sensor signals with the machine health. Researchers have used measurements of spindle motor currents, feed, forces (Nouri, Fussell, Jerard, Gao, & Linder, 2012; Saglam & Unuvar, 2003), acoustic emission (Houshmand, Kannatey-Asibu, & Herrin, 1995; Niu, Wong, Hong, & Liu, 1998; Srinivasa Pai & Ramakrishna Rao, 2002), vibrations (Berger, Minis, Harley, Rokni, & Papadopoulos, 1998; Dilma & Lister, 2000; El-Wardany, Gao, & Elbestawi, 1996), to estimate the tool wear. In contrast to the aforementioned variables, vibration is one of the features of modern mechanical machinery that is now continuously monitored in many significant applications. The commonly monitored vibration signals are acceleration, velocity, and displacement for the purpose of determining machinery integrity. The vibration signatures of the machine apprise the operator to make a crucial decision for condition based maintenance. The amplitude of these signatures gives an indication of the acuteness of the fault, whilst the frequency can indicate the origin of the defect (Peng & Kessissoglou, 2003). Vibration monitoring is generally carried out by analyzing signals collected on the running machine. These measurements, which represent in fact some parts of the machine, are difficult to interpret due to the nature of the vibration signal and the interferences. It emerges a need to develop a monitoring and diagnosis system of high level data to provide precise extraction of data about the health of the machine.
The various vibration monitoring methods and signal processing techniques for structural health monitoring has been reviewed (Goyal & Pabla, 2015a, 2015b). Vibration analysis is most prevalent technique used for monitoring, detecting and analyzing the machine condition in an industry due to non-destructive in nature that allows sustainable monitoring without any interfering in the operation. The various condition monitoring indicators for fault diagnosis of dynamic machines have been discussed (Goyal, Pabla, & Dhami, 2016). A review of the utilization of soft computing techniques in condition-based maintenance has been introduced (Goyal, Pabla, Dhami, & Lachhwani, 2016).
1.2. Structural health monitoring
A SHM system is a continuous and an autonomous tool used for fault detection, breakdown anticipation and problem diagnostics in the machine. An effective SHM system can improve productivity and ensure work piece quality contributing to a major influence on machining economics. The effectiveness of the SHM system relies on the sensitivity of sensor used, position of sensor mounting, number of sensors to be used and types of sensors to be practiced. Current health monitoring approaches are much able to determine the (Rytter, 1993):
presence of damage in structure (level 1);
geometric location of damage (level 2);
type or extent/severity of damage (level 3);
anticipation of the remaining lifetime (level 4);
self healing structures (level 5).
Park, Muntges, and Inman (2001) suggests 'Level 5' in the context of smart structures with emergence of shape memory alloys i.e. Cu-Al-Ni and Ni-Ti (NiTi) alloys. The development toward a higher functional layer is taken as an important stride forward in the evolution of autonomous monitoring of the integrity of machine tools.
The accelerometer is the most widely used contact type instruments that use the piezoelectric effect to measure mechanical input such as force, torque, strain, pressure, acceleration, acoustic emission and vibration by converting them into electrical charge. Both accelerometers and velocity transducers measure the vibration of the non rotating part of a machine, but they cannot provide any direct information about the relative motion of the rotor and stator (Wei, Zhou, Huang, & Tan, 2013).
The present work develops a non contact structural health monitoring system using a low cost microcontroller based data acquisition system (DAS). The system used the light dependent resistors that work on the principle of photoconductivity to measure the vibration signal of the machine. The produced vibration signal is then analyzed using NI based LabVIEW software to determine the health of the machine. An experiment is carried out using the vibration rig for the machine to collect signal data for the analysis. By applying a microcontroller, the project proposes to develop a cost-effective data acquisition system for monitoring the machine condition. The objectives of this work include the following:
a) To develop an economical non contact vibration based instrument to monitor the current status of the machine for reliable structural health monitoring using microcontroller interfaced with LabVIEW.
b) To acquire, visualize and analyze the vibration signatures of a machine tool.
c) To correlate the vibration signatures with machine health.
d) To reduce regular periodic inspections, better quality control and scheduled maintenance.
e) Remote Monitoring.
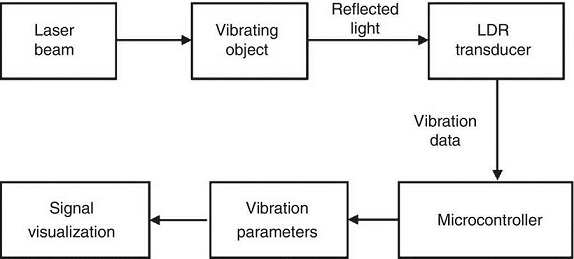
2. Structure of the proposed data acquisition system
The functional information flow of the proposed data acquisition system is shown in Figure 1. During machining operation, real-time vibration data in two directions has been collected through a light dependant resistor. The acquired data is then calibrated with the contact type signal transducer (accelerometer).
3. Structural health monitoring system through the microcontroller-based data acquisition system
Machine condition monitoring was implemented through the analysis of vibration data that was captured through the data acquisition system. The following four sections describe the development of the hardware system, software system, integration and testing of the data acquisition system, and calibration along with the vibration data analyses.
3.1. Hardware system development
The non contact data acquisition system employed off-the-shelf equipment in a novel integrated approach. During machining operation, real-time vibration data was collected through a light dependant resistor. The raw signal was processed to extract the characteristic features from the machining signals. The dynamic stream of the characteristic features can then be visualized in real time. The various equipment that is used for developing a system is described below:
3.1.1. Laser emitter
A laser diode produces a laser beam and an array of photodiode sensors receives the reflected beam, which is reflected from the reflector placed on the vibrating object for acquisition of vibration data. The angle between the incident ray and reflected ray has been found to be 7.5° as the sensor arrangement was positioned in front of mirror to prevent any loss of reflected light over the array of light dependant resistors. It is incorporated with power supply stand and laser beam positioning mechanism to reach the flexible changes in its coherence.
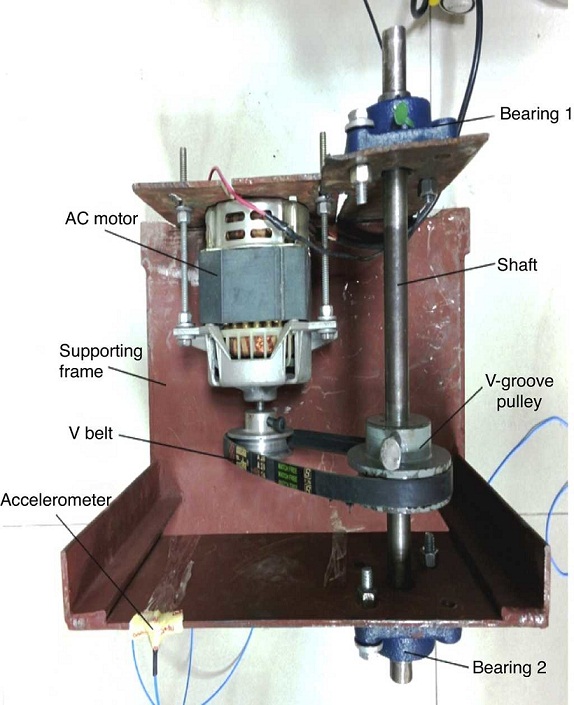
3.1.2 Vibration rig
An electric motor is fitted in a steel frame. An iron frame has been employed with two assemblies. Firstly, the rotor assembly has a pulley and a rotating shaft with an outer diameter, the pulley being mounted for rotation on the rotating shaft (Fig. 2). Secondly, the stator assembly has a bearing sleeve with a bottom opening, the rotating shaft being inserted into the bearing sleeve for rotation. A 20 mm diameter shaft is supported by another bearing placed at the other end. A belt is also added to rotate the shaft by applying an electric power to the motor (rotates at 1100 rpm).
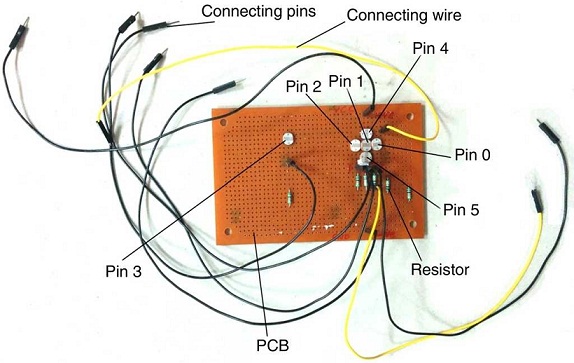
3.1.3 Machine vibration measurement sensor
Six light dependant resistors (LDR) sensors embedded in a printed circuited board are habituated to receive the vibration signal by studying the change in the intensity of the laser beam. The printed circuit board includes a sensing element and a resistor interface able to carry information from the sensing element and send an analog signal to the microcontroller. Figure 3 shows two-dimensional cross-shaped five sensors, i.e., PIN 0, PIN 1, PIN 2, PIN 4, and PIN 5 are placed together to receive the variation in intensity of laser light due to vibrations, whilst the sixth sensor, i.e., PIN 3 is placed at some distance to receive the surrounding light. The PIN 3 is positioned separately as to remove the noise (in the form of light) interferences that come from the surroundings during operation. PIN 1 acts as a reference pin, change in the intensity of light between PIN 0 and PIN 2 are used to measure the X -axis vibrations, while between PIN 4 and PIN 5 are used to measure Y -axis vibrations.
3.1.4. Microcontroller-based data acquisition device
A microcontroller (Arduino) data acquisition device has been used as a central data acquisition hub. This device helps to interface vibration signals with the computer program using LabVIEW installed on a PC via a USB port. Using a standard high speed USB port, this device enables low cost, PC based analog and digital input/output data acquisition. A microcontroller is associated with the sensor, and brings forth a digital output after burning the program for the photoresistor.
3.2. Software system development
Two computer programs have been written separately in different software developmental environments without using any anti-alisaing filter. The first is prepared for microcontroller and the other is based on VI (Virtual Instrumentation) for LDR sensor in LabVIEW to capture and display the vibration signals in the manner of real time. Both of them are successful in interfacing with the hardware system for real-time data acquisition. An amplification factor of 1000 is used to convert the mV into volts for an accelerometer.
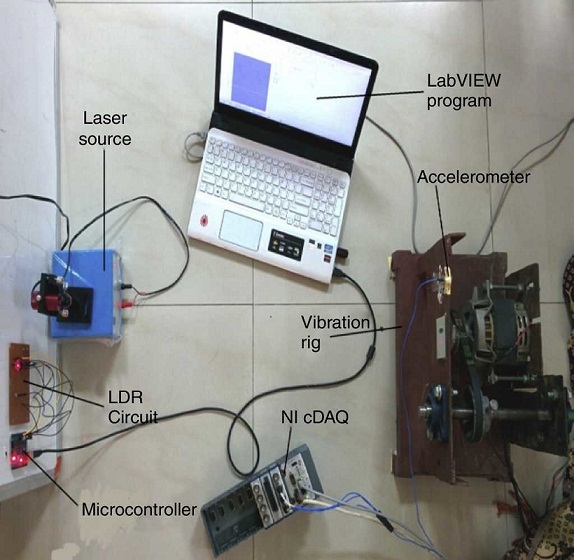
3.3. Integrating and testing of the data acquisition system
The schematic of the experimental setup is shown in Figure 4. During the operation, the sensor arrangement was positioned in front of a mirror to prevent any loss of reflected light over the array of light dependant resistors.

The installation of the sensor and the implementation of the data acquisition system for vibration measurements are displayed in Figure 5.
Three sets of experiments were conducted on the designed vibration rig for different conditions of bearings. One set included two healthy bearings on both ends of the shaft. The other set included two faulty bearings, and the third one included healthy and faulty bearings on both sides respectively. Three experiments were performed for each set to collect vibration data generated in the operation. For the first two experiments, 30k samples were collected, and for the next experiment 25k samples were taken to visualize and analyze the vibration data.
3.4. Calibration
A contact type instrument, i.e., ICP @ triaxial accelerometer embedded in a vibration rig has been used to calibrate the results acquired by the developed system using NI cDAQ-9178. Two dimensional data have been extracted from the tri-axial accelerometer by removing the Z -axis vibration data.
4. Results and discussion
Based on the analysis and the theoretical framework provided in the earlier sections, the experiment has been performed on the vibration rig, and results obtained from the analysis phase in the development of non contact SHM system for machine tools are discussed in this section. A number of experiments have been conducted to check the accuracy in the measurement of the developed system by calibrating it with an accelerometer. The points used for the analysis part are marked to distinguish the various experiments as shown in Table 1. Using this data, various graphs between vibration amplitude and number of samples have been plotted and analyzed for different condition of bearings in chronological order:

4.1. Experiment on healthy bearings
The first experiment was conducted on the healthy bearings to measure the vibrations using the photosensor and an accelerometer.
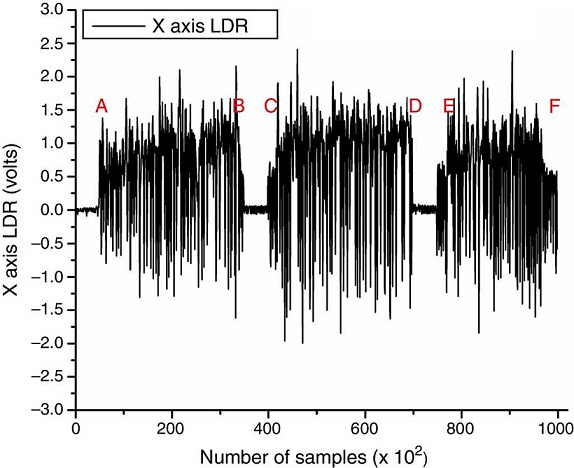
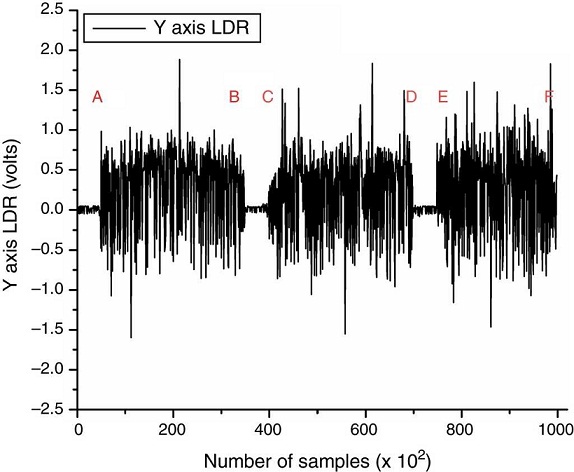
Figures 6 and 7 show the combined view of all experiments conducted to analyze the variation of the vibration amplitude with a number of samples in the X -axis and Y -axis for the photosensor.


Figures 8 and 9 show the combined view of all experiments conducted to analyze the variation of the vibration amplitude with a number of samples in the X -axis and Y -axis for an accelerometer.


Figure 10 shows the comparison of variation in vibration amplitude measured by both contact and non contact type instruments in the X-axis to monitor the health of the machine. It has been observed that the developed system gives almost the same values like the contact type instrument.
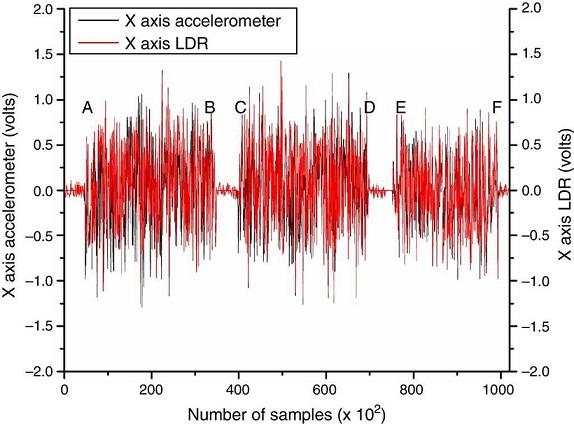
Fig. 10 Comparison of X-axis vibration signature for the LDR and the accelerometer vs. number of samples [0-100k].
For 0-35k range of samples, the value of both transducers, i.e., at non operating time (0-50), approaches to zero. The maximum value for LDR and the accelerometer were 1.13 and 1.32 V, whereas the minimum values were −1.25 and −1.29 V.
For 35-70k range of samples, the maximum and minimum values for LDR were observed to be 1.294 and −1.19 V. The maximum and minimum values for the accelerometer were observed to be 1.29 and −1.25 V.
For 70-100k range of samples, the maximum values for the photosensor and the accelerometer are 0.85 and 0.91 V, whereas the minimum values for both transducers were −0.981 and −0.983 V, respectively.
Figure 11 shows the comparison of variation in the vibration amplitude measured by both contact and non contact type instruments in the Y-axis to monitor the health of the machine.

Fig. 11 Comparison of Y-axis vibration signature for the LDR and the accelerometer vs. number of samples [0-100k].
For 0-35k range of samples, the maximum value for LDR and the accelerometer are 0.496 and 0.49 V, whereas the minimum values are −0.38 and −0.32 V.
For 35-70k range of samples, the maximum and minimum values for LDR were observed to be 0.496 and −0.497 V. The maximum and minimum values for the accelerometer were observed to be 0.45 and −0.498 V.
For 70-100k range of samples, the maximum values for the photosensor and the accelerometer were 0.33 and 0.34 V, whereas the minimum values for both transducers were −0.330 and −0.32 V.
4.2 Experiment on faulty bearings
Figures 12 and 13 show the combined view of all experiments conducted to analyze the variation of the vibration amplitude with a number of samples in the X -axis and Y -axis for the photosensor. It was found that the magnitude of vibration amplitude increases in comparison to the healthy bearing for both axis.

Figures 14 and 15 display the combined view of all experiments conducted to analyze the variation of the vibration amplitude with a number of samples in the X -axis and Y -axis for the accelerometer. Here, it was again observed that the magnitude of vibration in the Y -axis is less as compared to X -axis.

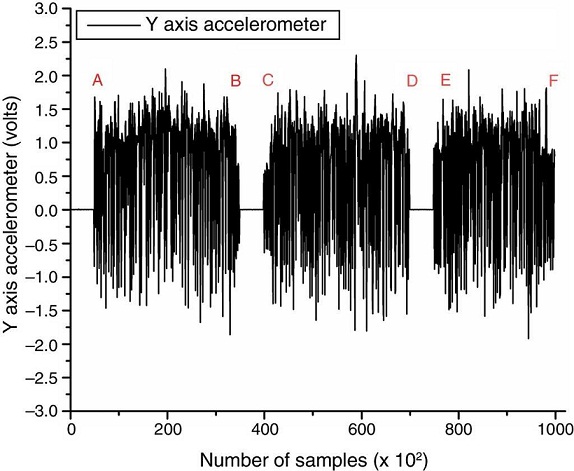
Figure 16 depicts the comparison of variation in the vibration amplitude measured by both contact and non contact type instrumentsin the X-axis to determine the condition of the machine.

Fig. 16 Comparison of X-axis vibration signature for the LDR and the accelerometer vs. number of samples [0-100k].
For 0-35k range of samples, the maximum and minimum values for LDR were observed to be 2.15 and −1.6 V. The maximum and minimum values for the accelerometer were observed to be 2.12 and −1.58 V.
For 35-70k range of samples, the maximum value for the LDR and the accelerometer were 2.41 and 2.37 V, whereas the minimum values were −1.99 and −1.98 V.
For 70-100k range of samples, the maximum values for the photosensor and the accelerometer were 2.38 and 2.37 V, whereas the minimum values for both transducers were −1.84 and −1.82 V.
Figure 17 shows the comparison of variation in the vibration amplitude measured by both contact and non contact type instruments in the Y-axis for monitoring the health of machine tools.
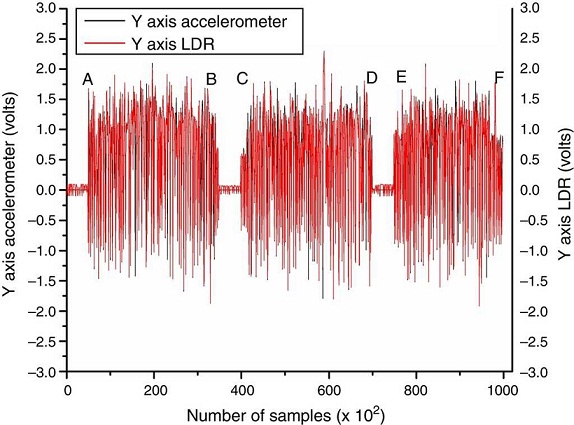
Fig. 17 Comparison of Y-axis vibration signature for the LDR and the accelerometer vs. number of samples [0-100k].
For 0-35k range of samples, the maximum values for the photosensor and the accelerometer are 2.018 and 2.09 V, whereas the minimum values for both transducers were −1.87 and −1.85 V.
For 35-70k range of samples, the maximum value for the LDR and the accelerometer were 2.301 and 2.310 V, whereas the minimum values were −1.79 and −1.80 V.
For 70-100k range of samples, the maximum and minimum values for the LDR were observed to be 2.03 and −1.91 V. The maximum and minimum values for the accelerometer were observed to be 2.08 and −1.92 V.
4.3. Experiment on healthy and faulty bearings
The combined view of all experiments conducted to analyze the variation of vibration amplitude with number of samples in X -axis and Y -axis for the photosensor is shown in Figures 18 and 19. It is found that this case has followed the characteristics of both previous cases.

Figures 20 and 21 display the combined view of all experiments conducted to analyze the variation of vibration amplitude with a number of samples in the X -axis and Y -axis for the accelerometer. The magnitude of vibrations measured by both transducers in the Y -axis has less value as compared to X -axis data.
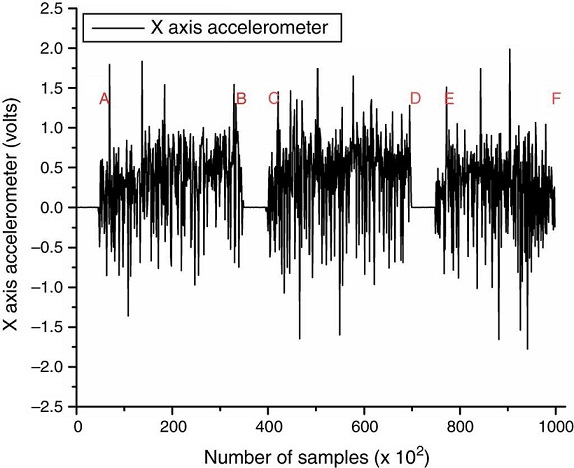

Figure 22 shows the comparison of variation in the vibration amplitude measured by both contact and non contact type instruments in the X-axis to correlate the vibration signatures with machine health.
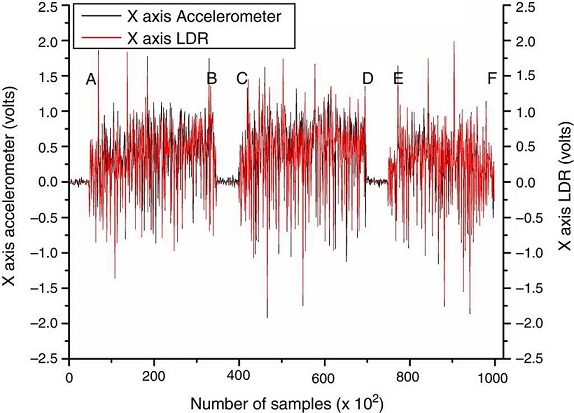
Fig. 22 Comparison of X-axis vibration signature for the LDR and the accelerometer vs. number of samples [0-100k].
For 0-35k range of samples, the maximum and minimum values for LDR were observed to be 1.86 and −1.17 V. The maximum and minimum values for the accelerometer were observed to be 1.83 and −1.36 V.
For 35-70k range of samples, the maximum value for the LDR and the accelerometer were 1.70 and 1.74 V, respectively, whereas the minimum values were −1.91 and −1.64 V.
For 70-100k range of samples, the maximum values for the photosensor and the accelerometer were 1.86 and 1.99 V, whereas the minimum values for both transducers were −1.86 and −1.77 V.
Figure 23 shows the comparison of variation in vibration amplitude measured by both contact and non contact type instruments in the Y-axis to validate the developed system for health monitoring.
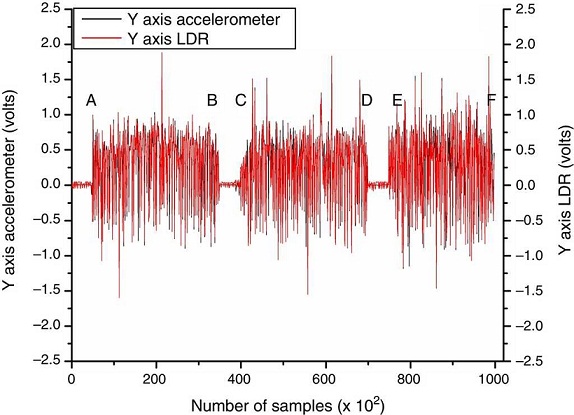
Fig. 23 Comparison of Y-axis Vibration signature for the LDR and the accelerometer vs. number of samples [0-100k].
For 0-35k range of samples, the maximum and minimum values for the LDR were observed to be 1.88 and −1.59 V. The maximum and minimum values for the accelerometer were observed to be 1.84 and −1.56 V.
For 35-70k range of samples, the maximum values for the photosensor and the accelerometer were 1.52 and 1.77 V, whereas the minimum values for both transducers were −1.55 and −1.01 V.
For 70-100k range of samples, the maximum value for the LDR and the accelerometer were 1.837 and 1.74 V, whereas the minimum values were −1.46 and −1.18 V.
5. Signal analysis
Most of the past research on the topic has been performed on the measurement and analysis of the machining signals in the time domain only. Recent studies have found the frequency domain analysis to be more useful in condition monitoring. For this work, the FFT and power spectrum were applied to extract the features from the vibration data as shown in Figures 24-41 (25 26, 27, 28, 29, 30, 31, 32, 33, 34, 35, 36, 37, 38, 39, 40). FFT was applied for converting the signals from time domain to frequency domain, whereas the power spectrum was used for spectral measurements. The parameter, power spectrum peak was extracted from real-time signal to check the accuracy in the measurement of both transducers.

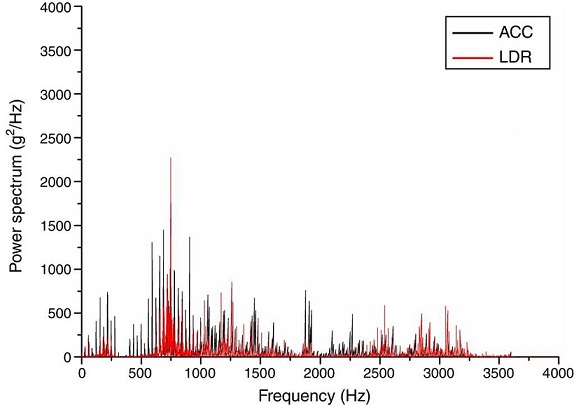
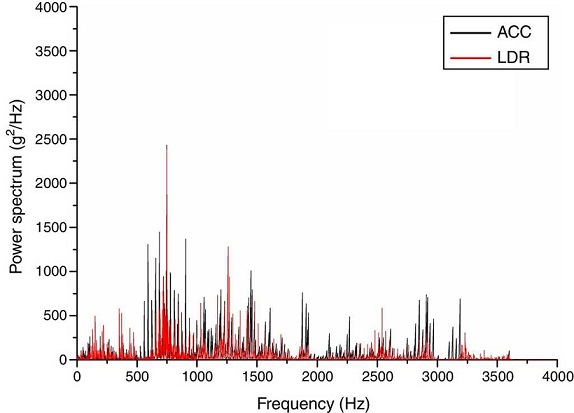
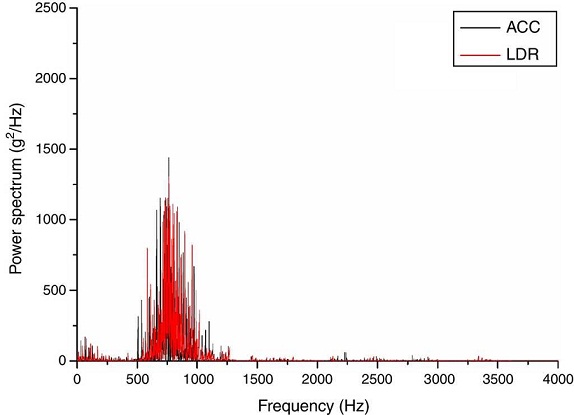

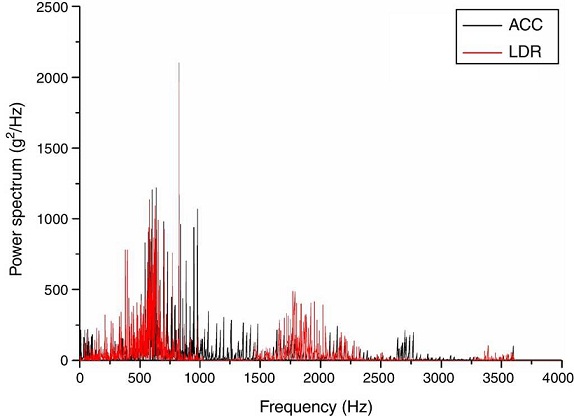


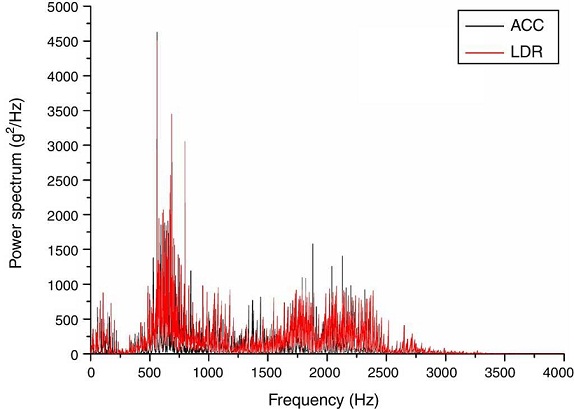


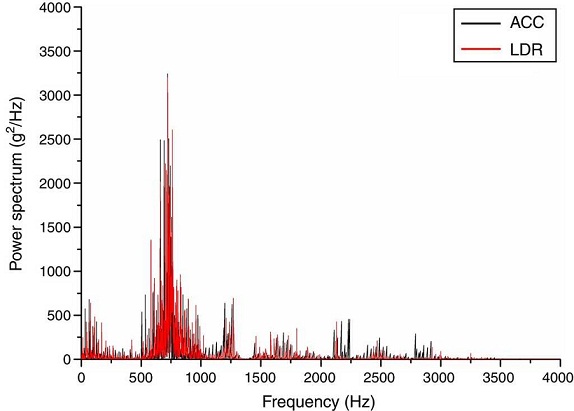
The power spectrum peak values at different frequencies in both the X -axis and the Y -axis were observed. It was observed that the peak amplitude of power spectrum in all three cases, i.e., healthy bearings, faulty bearings, healthy and faulty bearings for both the LDR and the accelerometer lie between the frequency range of 500-1100 Hz.
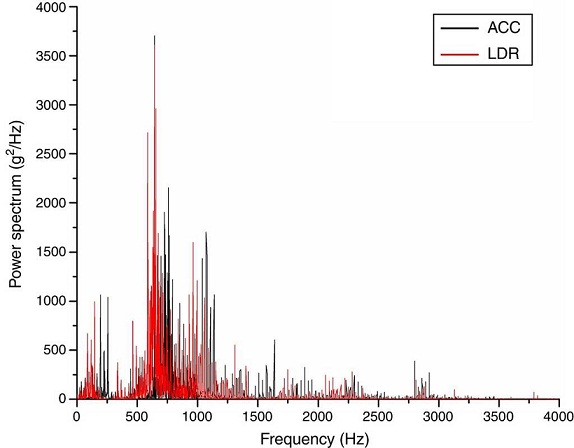
5.1. Healthy bearings
On performing the experiments using healthy bearings on both end of the shaft, the obtained power spectrum peak values at different frequencies in both the X -axis and the Y -axis has been tabulated in Table 2.
Table 2 Power spectrum peak amplitude for the LDR and the accelerometer in both axis.
| Points | Axis | Power spectrum peak amplitude (accelerometer) (g2/Hz) | Power spectrum peak amplitude (LDR) (g2/Hz) |
|---|---|---|---|
| A to B | X | 2095.11 | 2418.69 |
| C to D | X | 2190.29 | 2270.37 |
| E to F | X | 2432.55 | 2380.92 |
| A to B | Y | 1442.63 | 1308.57 |
| C to D | Y | 1680.81 | 1791.15 |
| E to F | Y | 2102.19 | 1965.74 |
The power spectrum graphs in both the X -axis and the Y -axis for the LDR and the accelerometer is shown in Figures 24-29 (25, 26, 27, 28).
5.2 Faulty bearings
The obtained power spectrum peak values at different frequencies in both the X -axis and the Y -axis while performing the experiments using faulty bearings on both ends of the shaft has been tabulated in Table 3.
Table 3 Power spectrum peak amplitude for the accelerometer and the LDR in both axis.
| Points | Axis | Power spectrum peak amplitude (accelerometer) (g2/Hz) | Power spectrum peak amplitude (LDR) (g2/Hz) |
|---|---|---|---|
| A to B | X | 3957.01 | 3891.37 |
| C to D | X | 4102.29 | 3978.31 |
| E to F | X | 4628.22 | 4502.14 |
| A to B | Y | 3399.01 | 3472.92 |
| C to D | Y | 3461.13 | 3503.21 |
| E to F | Y | 3718.08 | 3605.71 |
The power spectrum graphs in both X -axis and Y -axis for LDR and accelerometer has been shown in Figures 30-35 (31, 32, 33, 34).
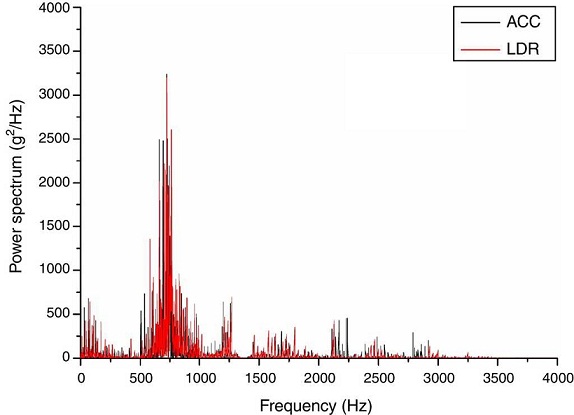
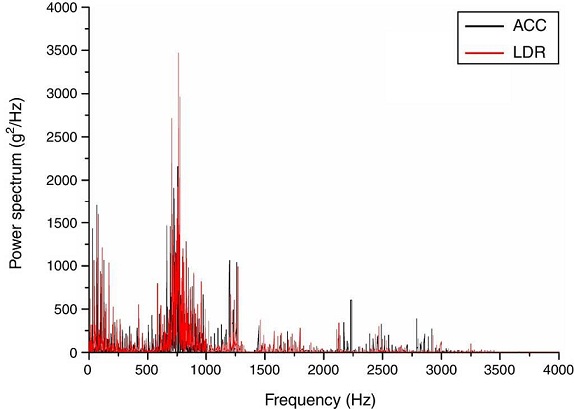
5.3. Healthy and faulty bearings
The obtained power spectrum peak values at different frequencies in both the X -axis and the Y -axis while performing the experiments using healthy and faulty bearings on both ends of the shaft has been tabulated in Table 4.
Table 4 Power spectrum peak amplitude for the accelerometer and the LDR in both axis.
| Points | Axis | Power spectrum peak amplitude (accelerometer) (g2/Hz) | Power spectrum peak amplitude (LDR) (g2/Hz) |
|---|---|---|---|
| A to B | X | 3242.75 | 3196.09 |
| C to D | X | 3399.73 | 3472.41 |
| E to F | X | 3741.20 | 3623.80 |
| A to B | Y | 2629.24 | 2451.31 |
| C to D | Y | 2904.51 | 3056.29 |
| E to F | Y | 3242.71 | 3196.19 |
The power spectrum graphs in both the X -axis and the Y -axis for the LDR and it is displayed in Figures 30-35 (31, 32, 33, 34).
6. Conclusions
With evolution in recent developments in sensors, signal processing and computing methods, structural health monitoring has become an important field of research. The present work has been aimed to develop a non contact structural health monitoring system for machine tools to monitor the health of machine for decision making about maintenance strategies. Following conclusions have been obtained from the experimentation and analysis of results:-
1) The developed system correlates the vibration signatures with machine health.
2) Real time condition monitoring can be carried out by using the developed system.
3) It has diminished the drawback of traditional sensors that have to be mounted on the machine.
4) The major objective of the present work to develop an economical non contact vibration based instrument to monitor the current status of the machine has been met.
5) The number of experiments were performed on the vibration rig under the different conditions of bearings i.e. both healthy bearings, both faulty bearings, and both healthy and faulty bearings to study the vibration behavior of the structure.
6) Results obtained from the machining tests performed on vibration rig showed that the system could be used reliably to measure vibration data.
7) The results were also compared with the accelerometer for the validation of results. It has been found that the developed system showed the same pattern of variation of vibration amplitude as an accelerometer does.
8) It has been noticed that there is a little difference in values of vibration amplitude measured by both contact and non contact type instrument due to difference in their sensitivity, but the same pattern of the developed system helps to monitor the health of the machine.
9) The power spectrum peak values at different frequencies in both X -axis and Y -axis were observed. It has been noticed that peak amplitude of power spectrum in all three cases i.e. healthy bearings, faulty bearings, healthy and faulty bearings for both LDR and accelerometer lie between the frequency range of 500-1100 Hz.
10) The non-contact nature of the developed system offers significant advantages over traditional contacting vibration transducers. This work has looked at the application of photosensor (LDR) to machinery diagnostics, concentrating primarily on vibration measurements directly from rotating structures.
Also, the research methodology was adopted in accordance with the project management strategies depicted in the research papers. The state of the art technique in the vibration analysis for structural health monitoring methodology has been exercised with practical measurements on vibration rig using data acquisition hardware/software and analysis done in LabVIEW.
7. Research Trends
1) Future research may focus on implementing decision making as an integral part of a monitoring and diagnosis system in real-time machinery health monitoring system with the utilization of emerging Information Communication Technologies.
2) It is expected that miniaturization of the machine health monitoring systems will enable the development of portable handheld devices. It will offer better means to assess the machine condition without any contact. In fact the machine health monitoring will be possible from remote locations without the need of visiting the site to collect data.
3) A comprehensive new theory can be built up that depicts the velocity sensed by a single laser beam incident on a rotating structure that takes into account the vibration engineer to determine the vibration component sensitivity of any measurement with any laser beam orientation. This theory will be then extended to cover measurements with multiple beams.
4) The developed system can be utilized to determine the machine health for water treatment plants, turbines in thermal power plants, wind turbine industries.

