


 nueva página del texto (beta)
 Inglés (pdf)
 Artículo en XML
 Referencias del artículo
 Enviar artículo por email
 Citado por SciELO
  Similares en
SciELO
Similares en
SciELO 
 Permalink
1. Introduction
Petroleum (literally, "rock oil") is a substance that has formed beneath the surface of the earth over years. The remains of ancient plants and animals have been buried and compressed beneath thousands of feet of sand, mud, and rock. The organic materials, under certain geological conditions, have been transformed by overburden pressure and subsurface heat into hydrocarbon compounds, such as crude oil and natural gas.
Huge quantities of crude oil and refined petroleum products are transported by ship between production sites, refineries and points of consumption. For many years, oil shipments have accounted for about 30% of global maritime trade. In 2011, they accounted for the bulk of traffic handled by French ports, representing more than 40% of total tonnage (Adam, 2006).
There are quite lot of procedures involved in the transportation of the oil or the petroleum products from the middle sea region to the shore region achieved effectively through the pipeline transportation. The pipelines are selected based on several criteria such as, long life cycle working, continual exposure in salt, sea water and sun rays, economical strategies and the implantation of the accessories across the overall transporting system. For transportation, the pipeline used is made of the concrete materials because of the high pressure and the flow tolerance parameter (Hou, Liu, & Li, 2003; Zhang, Wang, & Liang, 2006).
According to the United Nations Conference on Trade and Development (UNCTAD), shipments of crude oil totaled 1.78 billion tons in 2012, while shipments of refined products and liquefied gas amounted to 1.05 billion tons (of which approximately 230 million tons of LNG). In the long range transmission there are several problems identified by the transporters on the basis of constant pressure and flow rate maintenances (Hu, Starr, Zhou, & Leung, 2000; Venkatasubramanian, Rengaswamy, Yin, & Kavuri, 2003). Currently, there is a special linear structure deployed with sensors on pipelines to monitor and regulate flow and pressure. They demonstrated a multilayer communication schemes that ensure the effective routing of data among the sensors but there is no consideration of control valve among the sensor based remote communication networks which involves manual operation to achieve desired performance of pipeline transportation (Jawhar, Mohamed, & Agrawal, 2011). To overcome the practical difficulties, this paper subjects the implementation of the automatic control valves for the desired pressure and flow set ranges (Silva, Buiatti, Cruz, & Pereira, 1996).
2. Experimental setup
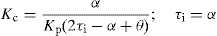
The replica of the industrial construction is built as the lab-scale experimental set up as shown in Figure 1. The setup includes the pump, to pump the oil from the underground level (below the sea level), the transmitting pipes for the efficient and long range transmission (up to 9 km long), analog pressure sensor, analog flow sensor and pressure gauges (Shijiu, Lining, & Jian, 1998). The control valves are implemented along the transport pipeline system in addition with analog flow sensor. For controlling purpose, the setup has been interfaced with the Micrologix 1400 PLC, which is programmed with PID controller.

Figure 2 shows the process flow diagram of oil transportation system. From the Figure 2, the set flow rate is initialized and the pump is started with the initial low pressure, since the liquid is inflammable it is pumped with the low pressure and then gradually increased at the regular intervals. At each point the pressure is increased by 10% and it is continuously measured with the pressure sensor till the desired flow rate is achieved. Then the signal is transmitted to the controller for the optimized control. Finally the liquid reaches the destination with the desired set range of pressure and flow rate.

2.1. System specification
The established lab scale experimental setup has been the representation of simplified industrial setup and the system specification is given in Table 1.
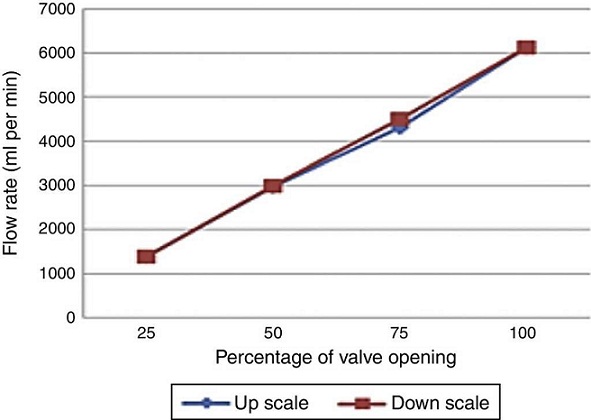
2.2. Calibration of control valve
Since the flow control is achieved by control valve, initial calibration test is required to ensure its performance for continuous running of experiment. As shown in Figure 3, the upscale curve is obtained when the percentage of opening is increased from 0% to 50%. Similarly the down scale curve is obtained when percentage of opening is reduced from 50% to 0%. This ensures the less hysteresis between upscale and downscale readings and this control valve can be used for flow control analysis.
3. Model development
3.1. Open loop response analysis
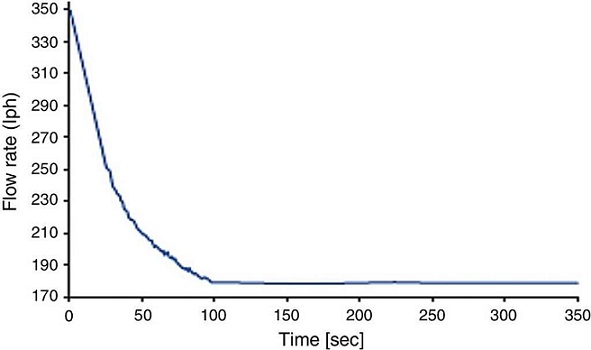
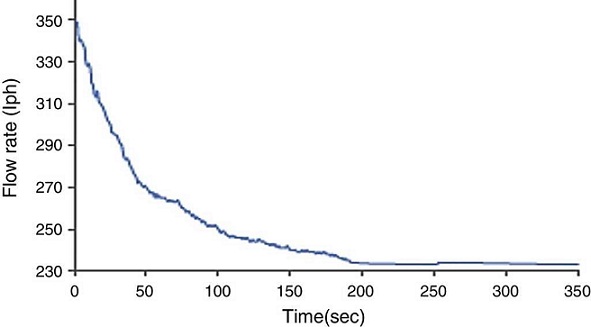
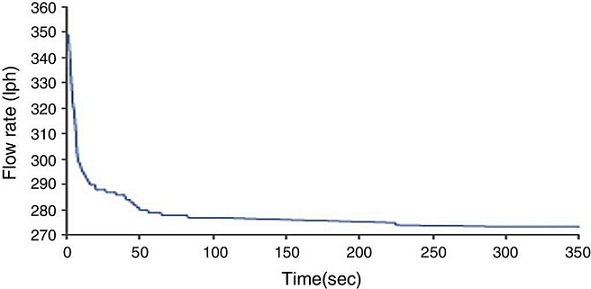
For modeling the process plant, open loop response is obtained by conducting experimental runs in the lab scale experimental setup. The flow rate of the petroleum is obtained by adjusting the speed of the pump. The speed of the centrifugal pump is controlled using the variable frequency drive. For this, the open loop response is carried out by regulating flow of petroleum by adjusting the speed of the pump.
Figures 4-7 (5, 6) show the corresponding flow rate for 20%, 40%, 60%, 80% speed of the pump. Experimental run starts with the initial flow rate of 349 lph and continuous readings were recorded until the flow rate reaches steady state. The result reveals that, for 20% of valve opening the final flow rate achieved is 178 lph. Similarly for 40%, 60%, 80% of pump speed, the final flow rate obtained are 233, 273, 311 lph respectively. The recorded data are plotted against time to get the reaction curve by which the first order model parameters (process gain K p and process time constant τ p ) are determined. The identified model parameters are tabulated in Table 2.

3.2. Model identification
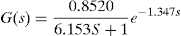
From Table 2, it is clear that the behavior of process is nonlinear and stable. Hence, First Order Plus Time Delay (FOPTD) transfer function (G (s ) = [K p /(τ pS + 1)]e − θs ) model is used to represent the flow maintenance of petroleum. The worst case model with the largest process gain and smallest time constant is selected to exemplify the process model. The identified FOPTD model of the flow control process is represented as,
 (1)
(1)
where, K p = process gain (0.8520), τ p = time constant (6.153) and θ = process delay (1.347) obtained from the experimental data.
3.3. Controller design
3.3.1. Conventional controllers
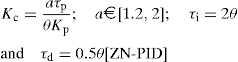
Many previous researchers have used the performance of a conventional controller as the benchmark to analyze the performance of a proposed controller. In this way, the conventional controller such as Ziegler-Nicholas PID controller and Internal Model Control based PID controller (Maâmar & Rachid, 2014a, 2014b) are considered for comparative purpose and the controller parameters are given as,
 (2)
(2)
 (3)
(3)
where K c is controller gain, τ i is integral time, τ d is derivative time and λ is the closed loop time constant.
3.3.2. Shams IMC-PID controller
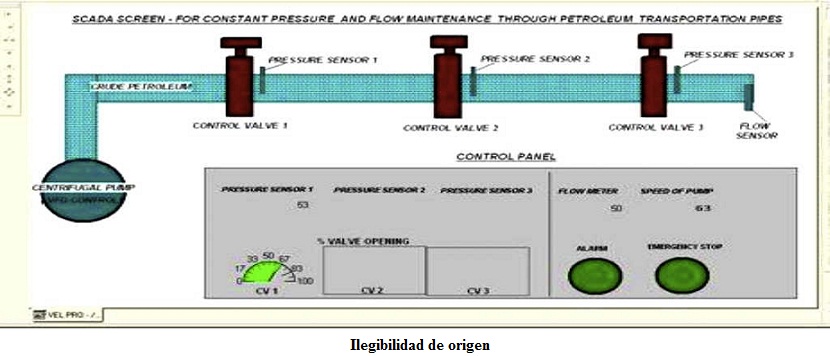
The Shams IMC based tuning is one of the closed loop tuning method which overcomes the shortcoming of the well-known Ziegler-Nicholas continuous cycling method and gives consistently better performance and robustness for the first order process. By using this tuning, it is possible to get the enhanced disturbance rejection performance by adjusting the single tuning parameter of the controller. The Shams IMC-PID controller parameters (Shamsuzzoha, 2015) are given by,
 (4)
(4)
where K c is controller gain and τ i is integral time. The value of α (non-minimum phase element) is selected so that it cancels out the pole at s = −1/τ and the value of α is obtained as
 (5)
(5)
The important feature of this controller is that it deals with nonlinear and stable process in a unified way. From the tuning rules, τ c controls the tradeoff between robustness and performance of the control system. The settings of the above said controllers are computed based on the FOPTD model given and the controller parameters are provided in Table 3.
3.4. Interfacing the real time system with SCADA
A SCADA model is developed to monitor the entire process and to view/vary the tuning values of the ZN, IMC and sham tuning PID controllers remotely. The developed SCADA screen using Factory talk view studio software is shown in Figure 8. Here the flow range is set for which the variable frequency drive is gets actuated, correspondingly the pressure for the same flow outcome is monitored and the required control valve opening is made by the controller automatically based on the control signals. All the parameters of the experimental setup are monitored and controlled through SCADA.
The control panel of the SCADA consists of numerical display of the pressure readings read by the pressure sensor 1, pressure sensor 2 and pressure sensor 3. It also displays the flow rate read by the flow sensor and the speed at which the pump operates and the percentage of the control valve opening. The alarm light blinks when the pressure of the petroleum or the flow rate of the petroleum crosses the safer limit. The emergency push button in control panel is used to shut the entire system in the case of any emergency (Yang, 2002, 2003).
4. Result and discussion
The simulation and experimental work has been carried out in flow and pressure control setup to analyze the performance of the ZN-PID, IMC-PID and Shams tuning IMC-PID controllers. To implement the closed loop control function, a PID block is developed in the ladder logic program in which control signal is given to the control valve to form closed loop system.
4.1. Simulation results
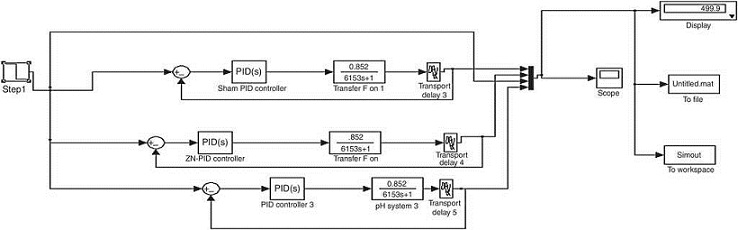
The controller structure of PID block in petroleum transportation is developed using SIMULINK in MATLAB platform. The performance of ZN, IMC and Shams tuning IMC-PID controller are analyzed at a set point at 150 lph. The closed loop simulated transient responses are recorded and displayed in Figures 9 and 10.

4.1.1. Performance analysis
In the simulation study, the performances of various controllers are compared by setting the peak of maximum uncertainty (M s ) value for comparison. It is better to have IAE, TV and M s (Integral Absolute Error, Total Variation of the input, uncertainty margin value) to be small, but for a well-tuned controller there is a trade-off, which means that a reduction in IAE implies an increase in TV and M s (and vice versa). (Shamsuzzoha & Skogestad, 2010).
From the performance analysis shown in Figure 10 and Table 4, the simulation results reveals that the shams IMC-PID controller is forced to follow the set point at short duration of time and to maintain the steady state without overshoot and with minimum error indices and good quality indices as compared with ZN and Simple IMC-PID controller (Li, Liu, Jin, & Hirasawa, 2015). It also gives faster disturbance rejection with the time duration of 8 sec and smaller overshoot of 22.57% as compared to ZN and Simple IMC-PID controllers which rejects the same disturbance with the time period of 11 and 18 s having overshoot of 39.24% and 26.12% respectively while maintaining the setpoint.
4.1.2. Disturbance rejection test
The disturbance rejection performance is investigated at the operating point of flow rate at 150 lph. A step disturbance is introduced into the process by way of increasing the flow rate to 180 lph after the time period of 50 s as shown in Figure 11 and it is ensured that, only Shams IMC-PID controller damp the disturbance in a shorter time period of 21 s with less undershoot of 14.28% as compared to the ZN-PID and Simple-IMC PID controllers. The error and quality indices of output signal are used to evaluate the disturbance rejection performance of the controllers and are given in Table 5.
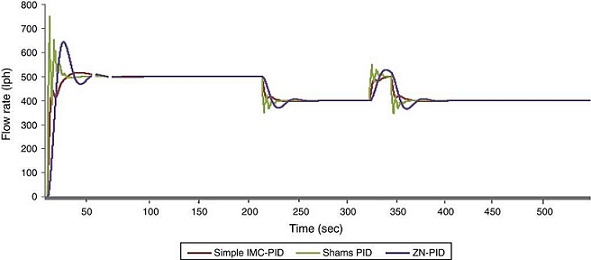
Fig. 11 Response for ZN, IMC-Shams-PID of first order process with setpoint change at t=0; load disturbance of magnitude 1 at t=100.
Table 5 Performance measures after disturbance at the operating point of 150lph.
| Performance measures | ZN-PID | IMC-PID | Shams-PID tuning |
|---|---|---|---|
| ISE | 3.698E+07 | 4.124E+06 | 75,817 |
| IAE | 913,225.2 | 936,591.1 | 248,521.8 |
| ITAE | 19,726,474 | 19,613,213 | 814,923.6 |
| T r (s) | 2.13 | 19.63 | 4.05 |
| T s (s) | 41.32 | 29.91 | 13.74 |
| %M p | 40.14 | 28.43 | 23.17 |
4.2. Experimental results
A PLC based PID block of the ladder logic program is created through which the values of K c , K i , K d are entered in the PID block which is shown in Figure 12.

Fig. 12 PID control block in which tuning values entered to create closed loop system by giving feedback to control valve.
The corresponding Step set point responses with various overshoots first order plus time delay process, G (s ) = 0.85/(6.15s + 1)e −1.34 s are shown in Figure 13 by changing the value of K c .

Fig. 13 Step setpoint responses with various overshoots first order plus time delay process, G(s)=0.85/(6.15s+1)e−1.34s.
An real time experimentation is carried in the lab scale setup to analyze the performance of ZN, IMC and Shams IMC-PID controllers in the closed loop system with an operating range of 180 lph at time duration of t = 0-90 s as shown in Figures 14-16 (15) and the corresponding performance indices are also calculated and listed in Table 6.
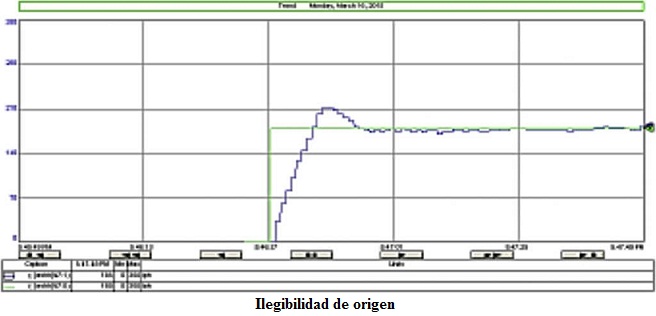
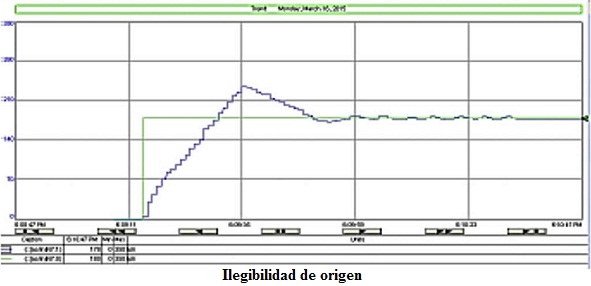

Table 6 Real time performance measures of IMC-PID, auto tuned, ZN-PID controller at 180lph.
| Error indices | IMC-PID | ZN-PID | Shams-tuning PID |
|---|---|---|---|
| ISE | 1.685E+07 | 2.33E+15 | 52,019 |
| IAE | 872,609.3 | 937,886.4 | 156,240.9 |
| ITAE | 29,656,496 | 17,856,590 | 825,786.3 |
| T s | 2522 | 4644 | 1426 |
From the real time results, it is clear that the response of the shams IMC-PID controller reaches the set point at 23 s and maintains steady state for the entire measuring period of upto t = 90 s. On the other hand, the ZN-PID controller reaches the set point at 46 s and maintained with slight oscillation up to t = 60 s. A simple IMC-PID controller reaches the set point at 29 s but it carries the minimal oscillation along the setpoint until it reaches the entire time duration of 90 s. Table 6 ensures that shams tuning PID controller furnishes minimum error indices of 16.54% as compared with conventional controllers and it gives the better performance for flow regulation in oil pipeline transportation.
5. Conclusion
In this paper, maintaining the constant flow rate is achieved when petroleum gets transmitted through the pressure line. A PLC based PID controller is developed along with the SCADA for the online monitoring and controlling and for the tuning of PLC based PID controller, ZN, Simple IMC and Shams IMC-PID controllers are considered. A complete experimental analysis in terms of system response is presented. The simulation and experimental results proves that the Shams IMC-PID controller provides fair transient as well as steady state behavior with minimum error indices and good quality indices as compared to the ZN, Simple IMC-PID controllers. Among the controller tuning rules, Shams IMC-PID controller provides 34% enhanced better performances and also tolerated the perturbations in the model parameters when the operating point changes. Also, it produces successful performance in disturbance rejection test. Finally, the problem of manually varying the speed of the pump and the control valve opening to achieve the desired flow rate is replaced by a PLC based shams tuning IMC PID controller.

