


 text new page (beta)
 English (pdf)
 Article in xml format
 Article references
 Send this article by e-mail
 Cited by SciELO
  Similars in
SciELO
Similars in
SciELO 
 Permalink
1. Introduction
The pattern classification is a significant research area because of wide range of applications. In literature, there are different types of classifiers such as fuzzy classifiers, support vector machines, artificial neural networks and k -nearest neighbor. In literature, there are different classification applications such as image classification (Shaker et al., 2012) or gender classification (Nazir et al., 2014).
This work presents an approach based on robust regression for classification applications using determination of optimal feature set.
Robust regression is a significant tool for data analysis (Chen, 2002). It can be used to detect outliers (Chen, 2002; Wang & Xiong, 2014) and to provide resistant results in the presence of outliers (Chen, 2002).
In literature, there are different applications based on robust regression (Naseem et al., 2012; Mitra et al., 2013; Rana et al., 2012). Naseem et al. proposed robust regression method for the face recognition in the illumination variation and random pixel corruption (Naseem et al., 2012). Mitra et al. (2013) suggested that analysis of sparse regularization based robust regression approaches. Rana et al. (2012) proposed a robust regression imputation for analyzing missing data.
In this study, a classification approach by using robust regression with determination of optimal feature set is presented for three different dataset from UCI dataset archives. The optimum values of the each of features in classification application are determined by using genetic algorithm (GA). In the robust regression process, the ordinary least squares method is used for all datasets. Next section gives a robust regression procedure. Optimization and determination of optimal feature set procedure are given in section 3. The simulation results are given in section 4.
2. Robust Regression Procedure for Classification
In robust regression stage, the ordinary least squares analysis used for tested all classification problems. The number of regression is equal to the number of attributes in classification problem. For example, there are four attributes for iris dataset, thus four regression calculations are done for this problem. Then, output values of these four are calculated to average of arithmetic, and this average value is rounded to nearest integers. The same procedure is applied to the other classification problems with having different number of attributes. The vector of regression coefficients is obtained by used linear regression function.
Consider a simple linear regression model:
 1
1
where the dependent variable y is related to the independent variable x , and e is an unobservable vector of errors (Chen, 2002; Naseem et al., 2012; Holcomb & Morari, 1993; Mitra et al., 2010). The ordinary least squares estimate of r is (Holcomb& Morari, 1993; Praga-Alejo et al., 2008)
 2
2
In this work, x values in proposed method are the values of each of attributes in classification problem. Then, output values (y ) are calculated to average of arithmetic. The following equation is the arithmetic mean of function outputs:
 3
3
where Y is the arithmetic mean of outputs, k is the number of attributes, y k is the value of each individual output for each of attributes. Y value is the arithmetic mean of obtained outputs for each of attributes. Then, this Y value is rounded to nearest integers.
3. Determination of Optimal Feature Set Using Genetic Algorithm
In optimization process, the optimum values of the each of features in classification problem are determined using GA. Genetic algorithms are robust optimization techniques based on principles from evolution theory (Goldberg, 1989). Thus, new optimal feature sets are obtained; 9, 10 and 12 optimal reference feature set values are determined for iris, heart and balance scale dataset, respectively.
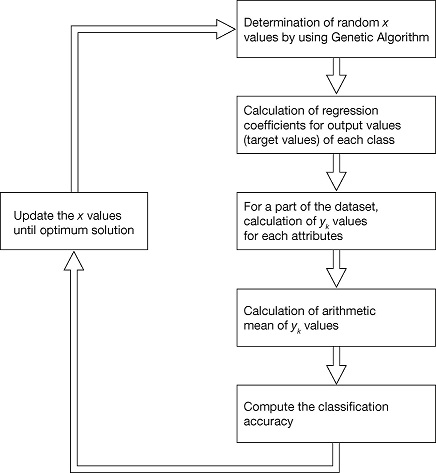
For all tested classification application, a part of the dataset is used in optimization process, and the optimized model is validated by the remaining part of the dataset. The fitness function is classification accuracy rate of the reference set for optimization algorithm. Figure 1 shows the outline of this study. Figure 2 shows the procedure of the determination of output values in classification problem for iris and balance scale dataset. For heart dataset, this procedure is same, but the number of optimal input values is equal to 13.

4. Simulation Results
The success of proposed classification method is examined by the iris, heart and balance scale dataset from UCI dataset archives (Machine Learning Repository, 2014). Firstly, three different types of iris plant are classified with according to its four attributes values for iris dataset. There are 150 instances divided into three classes. For iris plant dataset, 25 instances from each of class (totally, 75 instances) are used in optimization stage. The remaining 75 instances are used for validation to optimized model. For Statlog (heart) dataset, absence or presence of heart disease are classified with according to its 13 attributes values. There are 270 instances. For this dataset, 135 instances from dataset are used in optimization stage. The remaining 135 instances are used for validation to optimized model. The third dataset is balance scale dataset. There are to-tally 625 instances from three classes. This dataset are classified according to its four attributes values. 312 instances from dataset are used in optimization stage. The remaining 313 instances are used for validation to optimized model.
The fitness function of optimization algorithm is classification accuracy rate for reference data. Optimization variables are each of features in classification problems. For iris dataset, nine optimal reference feature set values are determined (three feature set for each class). For heart dataset, 10 optimal reference feature set values are determined (five feature set for each class). For balance scale dataset, 12 optimal reference feature set values are determined (four feature set for each class).
The aim of the proposed classification method is to obtain maximum classification accuracy with minimum optimal feature set data. The classification accuracy results for tested all dataset are presented in Table 1. As can be seen from Table 1, the accuracy rate is quite high for all dataset. The same datasets are classifi d using k -nearest neighbor (KNN). The obtained results showed that proposed method better than KNN algorithm for validation set. For KNN, training set is same with the data in optimization stage.
Table 1 The Average Classification Accuracy Rates by Using Proposed Method and KNN.
| Iris Dataset, % | Heart Dataset, % | Balance Scale Dataset, % | |
|---|---|---|---|
| For reference data set by using proposed method | 98.66 | 85.92 | 81.41 |
| For validation set by using proposed method | 97.33 | 83.7 | 86.58 |
| KNN (for validation set) | |||
| K =1 | 94.6 | 55.5 | 79.2 |
| K =2 | 94.6 | 55.5 | 79.2 |
| K =5 | 92.0 | 66.6 | 84.0 |
| K =15 | 93.3 | 67.4 | 87.8 |
For KNN, there are 75 reference instances for iris dataset, 135 reference instances for heart dataset (50% of the dataset is used as reference set for KNN) and 312 reference instances for balance scale dataset. However, 9, 10 and 12 optimal reference feature set values are used for iris, heart and balance scale dataset, respectively in proposed method. In this study, for different K values, classification accuracy rates are determined using KNN. The obtained results are given in Table 1. For KNN, the optimum K value can be determined. However, the number of reference data in proposed classification approach is very less than KNN.
Figure 3 shows the variation of each output (y 1...y 4) for each of attributes and the variation of the arithmetic mean of outputs for iris and balance scale dataset.

Fig. 3 The variation of each individual output for each of attributes and the variation of the arithmetic mean of outputs for iris dataset (A), and balance scale dataset (B).
Figure 4 shows the variation of the arithmetic mean of outputs for iris dataset, the rounded values of arithmetic mean of outputs and desired output values for validation set. As can be seen from Figure 4 for variation of rounded output, there are only two samples incorrectly classified from 75 validations set samples for iris dataset.
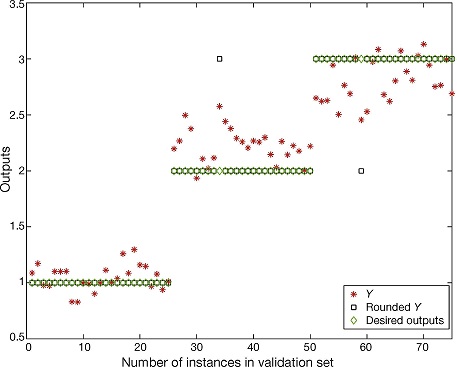
Fig. 4 The variation of the arithmetic mean of outputs, the rounded values of arithmetic mean of outputs and desired output values for iris dataset.
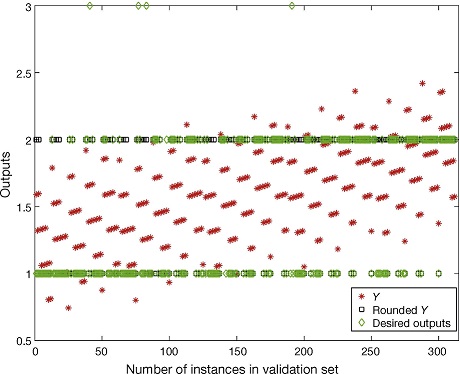
Figure 5 shows the variation of obtained outputs using proposed method and desired output values for heart dataset. As can be seen from Figure 5, there are only 22 samples incorrectly classified from 135 validations set samples for heart dataset. Figure 6 shows the variation of obtained outputs using proposed method and desired output values for balance scale dataset. There are only 42 samples incorrectly classified from 313 validation set samples for balance scale dataset.

Fig. 5 The variation of the arithmetic mean of outputs, the rounded values of arithmetic mean of outputs, and desired output values for heart dataset.
Conclusions
In this paper, a pattern classifier is designed based on robust regression with determination of optimal feature set values. The genetic algorithm is used in order to determine optimal reference set. The proposed classification method is carried out for different classification problems such as iris plant, heart and balance scale dataset and high classification accuracy is achieved for all applications. The proposed classifier can be used for different classification problems. The different weighting functions in regression process can be used in order to increase the accuracy. The ability of classification with low number of reference data is the valuable property of designed classification method.

