


 text new page (beta)
 English (pdf)
 Article in xml format
 Article references
 Send this article by e-mail
 Cited by SciELO
  Similars in
SciELO
Similars in
SciELO 
 Permalink
1. Introduction
Climate change has become a main concern in the academic, private and public policy sectors focusing on responses to mitigate changes due to use of fuel oils and the emission of carbon dioxide another greenhouse effects which among other things are leading to significative loses in biodiversity and dangerous increases of sea levels, droughts and dessertification around the globe. However, problems and response capacity are unequally among countries. Particularly, developing countries are most endangered because their limited resources to enhance their social, technological and economic and financial capabilities. Sustainable growth is practically beyond reach unless innovative policies and practices, now in their infancy, are strengthened.
In this respect, Environmental, Social and Governance (ESG) criteria are an increasingly important corporate contribution to favorable climate change and a sustainable development. Moreover, investors are increasingly applying eco-non-financial dimensions as part of their analysis process (specially environmental) in order to broaden their comprehension of the companies in which they invest. International agencies, multilateral institutions, policy makers and economic authorities are also highly concerned about ESG issues, and have been promoting joint efforts to encourage the dialogue, increase understanding and implement measures in relation to (i) the decision and operation of monetary policy in the context of climate change, and (ii) the impact of finance to climate change, including disclosure and communication, transition plans and financing green innovation. An example of such initiatives is the Green Swan conference co-organized by Bank for International Settlements (BIS), the European Central Bank (ECB), the Network for Greening the Financial System (NGFS) and the People's Bank of China (PBoC).
Sensitive to the challeges of climate change beyond a focal point, assuming its international role, Mexico is creating an institutional and legal context for the adoption and accomplishment of global policies and objectives. For example, the ratification of the General Law on Climate Change (LGCC), active participation in the creation of the National Climate Change System (SINACC) and the actions formulated in the National Development Plans (GRICCE, 2022). Additionally, in the Mexican Stock Market, both eco shares and bonds are traded.
Thus, to enhance green finance, it is of utmost importance for investors, company managers, monetary authorities, banking regulators and supervisory bodies to understand the dynamics and risk exposure of ESG investment instruments and how other key financial variables may impact their evolution. In this regard, we analyze the differential influence of Mexican oil price, exchange rate and S&P 500 Index on the indicators of the Mexican Stock Exchange: S&P/BMV IPC ESG Tilted Index (sustainable stock market index) and on S&P/BMV IPC (General stock market index) in two different regimes. To achieve that purpose, we first estimate the conditional volatility of the series using a univariate GARCH model under the t-Student distribution. Second, a Markov Switching Vector Autoregressive model is developed. The study period covers from March 21, 2014, to April 28, 2022.
Our research contributes in several ways. First, examining the ESG Index dynamics in an emerging economy, the case of Mexico. Secondly, proposing a non-linear approach to analyze the general and sustainable indexes response to key financial indices. Third, providing crucial evidence to design investment strategies including ESG assets. Finally, considering local institutional limitations, we suggest some advancements.
The research is structured in five sections. Section two discusses the literature review. The third part describes the data and methodology. Fourth section presents the empirical results and its analysis. The fifth section concludes.
2. Literature Review
Rising global concerns over environmental problems deteriorating sustainable development have led to significative research contributions from the academic world. A good number of recent works deal with corporate governance responsibility regarding a promotion of green investments supported similarly with green finance assets. In affinity with our empirical goals, this section reports recent research devoted ESG performance. Most studies deal with the case of developed countries. To close this gap, we stress studies on emerging economies. The latter case accentuates the unique conditions of these nations which are still a barrier to the advancement of ESG and its potential contributions to a sustainable development (Husted and Sousa-Fillo, 2019; Janah and SaSSI, 2021; Singhgania and Saine, 2021). For comparative purposes, this revision of related studies is complemented in the section discussing our results.
Concerning developed markets, several studies deal with the hedging and potential benefits of green assets and ESG practices. Recent works by Martinez-Oviedo and Medda (2019), Drei et al. (2019), Saeed et al (2020), Ruan and Liu (2021), and Chen (2022) represent this line of research. Martinez-Oviedo and Medda (2019) examine the performance of two categories of green investment: non-real green assets and real green assets (natural resources). They identify the green investments which offer best financial benefit and examine endogenous risks related to these types of assets. Their analyses focus on expected volatility, returns, diversification, downside risk, linkage with inflation, and sensitivity to liquidity disequilibria in capital markets. Their performance is contrasted with that of traditional assets such as equity, bonds, and real estate, as well as other non-conventional instruments, specifically infrastructure. Martinez-Oviedo and Medda results indicate that real green assets are an adequate option in the incorporation of green investments.
Drei et al. (2019) examine the influence of ESG investing on pricing determination in bourses. Their updated research confirms previous results. ESG investing tends to affect both passive and active ESG investors during 2010 and 2013. However, ESG investing became a source of improved performance from 2014 to 2019 in Europe and North America. Additionally, ESG might be considered as a risk determinant in the Eurozone, but in the North America, It is still one of the best strategies. Nonetheless, new interesting patterns appear during the last year and a half. First, findings for North America and the Eurozone are distinct during the latest period. Second, a partial alignment between ESG ratings and performance can be attributed by a switch from a passive to a dynamic method to ESG investing. Third, there are some discrepancies between active and passive management. Fourth, social considerations apparently gained importance during the last years, and is no longer a determining factor. Finally, A factor-based investment and ESG investing are becoming increasingly linked.
In turn, Saeed et al. (2020) compare green assets with dirty energy instruments in terms of their hedging efficiency from January, 2012- November, 2019. They apply corrected dynamic conditional correlation models to estimate the indicators of coverage and effectiveness, and the results reveal that both measures vary over time. Their evidence reveals that investors should employ a dynamic hedging strategy and that clean energy assets achieve greater efficiency than green bonds. Regression results indicate that implied volatilities of U.S. equities and crude oil, as well as the U.S. dollar index, negatively affect hedge portfolio returns, while gold prices and inflation affect positively.
Finally, Chen (2022) examines the impact of green strategy on the corporate green performance and green competitive advantage. Chen applies stepwise regression analysis for data analysis and comparison. Three main results are reported. First, Corporate green assets and corporate green technology are the main factors that can be used by firms to obtain the green competitive advantage. Second, the effect of corporate green strategy on corporate green assets, corporate green strategy, corporate green performance, and corporate green assets can be confirmed. Additionally, the mediating impact of corporate green assets and corporate green technology on the corporate green performance and corporate green assets are identified. Finally, companies should use the corporate environmental responsibility conceptual frameworks to enhance green corporate assets.
Further research regarding equity financing and ESG worth mentioning are the works by Chouabi, and Affes, (2021), Murata and Hamori (2021) employ data panel linear regressions employing the Thomson Reuters ASSET4 and Bloomberg database from seven countries. This includes data of 523 listed companies selected from the ESG index between 2005 and 2017. The evidence shows an increasing interest in corporate social responsibility (CSR) and ethical practices over the last ten years. Besides, companies with a strong social and ethical commitment achieve significantly higher environmental indicators. The GMM model results indicate dependence and permanence in environmental disclosure. The findings highlight that the institutional and/or cultural variables impact top management’s environmental reporting behavior relate to the quality of published information.
Murata and Hamori (2021) study the relationship between environmental, social and governance (ESG) disclosures and stock downside risk. Their study employs sets of major market index constituents from Europe, the United States and Japan to perform regression analysis, taking into account other possible determinants of stock price decline. The authors measure static two-way fixed effects models and dynamic GMM models. The results confirm that the coefficients of firm-level ESG disclosures are not statistically significant in the static model. The coefficients of ESG disclosure in the dynamic model are not statistically significant in the United States but are statistically significant and negative in the European and Japanese markets. These results mean that ESG disclosure decreases the risk of stock price decline in the future; however, the influence and predictive power of ESG disclosure is different in each market.
Now, regarding developing economies, although green finance and ESG are nascent in these countries, recent research is bridging the gap with that reported from developed nations. Although common environmental and sustainable growth issues are dealt with, data disclosure and sui generis institutional conditions impair findings and contributions of ESG to green finance and sustainability. At any rate, recent research is symptomatic of positive changes at hand. Research worth mentioning includes the works by Martinez-Ferraro and Lozano (2021), Ruan and Liu (2021), Masliza, and Wasiuzzaman (2021), Rojas Covarruvias (2021), Duque-Grisales and Aguilera-Caracuel (2021), Janah and Sassi (2021), Amosh and Khatib (2021).
Martinez-Ferrero and Lozano (2021) explore the relationship of institutional ownership and environmental, social, and governance (ESG) performance in emerging markets. Their study comprises an international sample of 17,318 firm-year observations from the period 2012-18 for 16 emerging countries. The empirical evidence shows that the ESG performance of firms located in developing countries relies on the level of influential institutional ownership, and displays a U-shaped relation, especially for environmental disclosure. Institutional investors with lower participation are less likely to drive higher ESG performance in emerging markets, but this effect is mitigated once institutional investor participation reaches a significant percentage, which represents a critical mass.
Ruan and Liu (2021) examine if ESG activities have enhanced or inhibit firm performance. Previous evidence has shown mixed results. In the case of China this is a very important issue because corporate ESG activities are still in their infancy and related systems and regulatory measures are insufficient not complete. Accordingly, Ruan and Liu (2021) examine ESG A-shares from both the Shanghai and Shenzhen markets. The sample includes data from 2015 to 2019. Their empirical evidence shows that corporate ESG activities have a significantly negative impact on firm performance. In addition, their evidence shows that, as opposed to state-owned and environmentally sensitive companies, non-state-owned and environmentally non-sensitive companies provide more evidence to support their conclusions.
Masliza, and Wasiuzzaman (2021) investigate the effect of firms’ ESG disclosures on corporate performance, moderated by firm competitive advantage. The sample of the data is 3966 firm-year observations from year 2012-2017 of 661 firms listed in the Bursa Malaysia. Clustering techniques are included in their regression analysis. Contrary to the case of China, the empirical evidence shows ESG disclosure increases corporate performance even after controlling for competitive advantage. In addition, increased ESG disclosure in one unit will increase the company's performance by an average of 4 percent in Malaysia. The study states that it is necessary examine the level of ESG disclosure and the financing incentive for firms with high ESG disclosure scores as high scores of ESG are associated with higher competitive advantage. Further, authorities can promote regulatory frameworks by incorporating ESG within various investment activities and value creation initiatives.
In the same line of research, Rojas Covarruvias (2021) examines the relationship between corporate sustainability and the financial performance of the companies with the largest market capitalization in Argentina, Brazil, Chile, Mexico and Peru. Panel data gathered from the Refinitiv Eikon platform for more than 190 companies for the period 2002-2019 for ESG indexes. Three variables are used to measure financial performance: return on assets, return on sales and Tobin's Q. The Q ratio enables to examine the impact of sustainability on investors' expectations of the company. The Mental Environ, Social & Governance (ESG) criterion is used. Findings reveal a positive relationship between ESG and performance. For the Latin American case the evidence reveals a positive and significant correlation between the Tobin-dependent variable Q and the added ESG. This is important because these relationships have not been analyzed in depth for the case of developing countries due their sui generis characteristics, particularly considering that findings of developed countries are not applicable to the Latin American case.
Duque-Grisales and Aguilera-Caracuel (2021) study if a firm’s financial performance is linked with superior environmental, social and governance (ESG) indicators in developing markets of multinationals in Latin America. They employ data from 104 multinationals stablished in Brazil, Chile, Colombia, Mexico and Peru. A panel linear regressions are applied. Their findings reveal that the relationship between the ESG indictors and financial performance is significantly statistically negative. Additionally, Duque-Grisales and Aguilera-Caracuel analyze environmental, social and governance independently conductive to establish each factor´s relationship to multilatinas’ financial performance. The results suggest a negative relationship. Finally, the empirical evidence states a moderating effect of financial slack and geographic international diversification on the relationship between ESG factors and firms’ financial performance.
Janah and Sassi (2021) review four crucial determinants of the ESG CFP relationship in emerging countries. Their inspection uncovers four research opportunities and increases understanding about two notable limitations of ESG research in emerging countries. The data used include empirical articles arguing for the ESG-CFP relationship obtained from the Web of Science database. Janah and Sassi's analyses make it evident that while most studies in developed countries indicate a positive relationship, in developing countries it remains inconclusive and further research is needed.
Amosh and Khatib (2021) contend that financial information per se is insufficient to satisfy the expectations of stakeholders. In Jordan, disclosure practices are still emerging and non-mandatory. Amosh and Katib examine the level of environmental, social, and governance (ESG) disclosure in the annual reports of industrial firms listed on the Amman Stock Exchange. The research analyzes the level of disclosure. Their findings confirm that the level of disclosure on ESG performance is still weak, albeit improving due to pressures from stakeholders. The outcome also identified a compelling impact of the board size and board meetings on ESG performance. However, the evidence was discouraging regarding non-executive directors, audit committee, auditor type, and board compensation; these factors did not contribute to disclose ESG practices.
Most recently, Linnenluecke (2022) investigates the state of research on environmental, social and governance (ESG) performance in the multinational business research context. He discusses research advances and various topics associated with applying ESG ratings in cross-country studies, mainly for evaluating the performance of multinational enterprises. This includes emerging market multinationals. Three emerging research streams are identified and analyzed: 1) research about the ESG-financial performance in emerging markets; 2) research following the ESG performance of multinationals in the different countries and regions they are operating; and 3) contexts for assessing ESG-related risks on a country level. Several unresolved issues become apparent. ESG frameworks have been constructed to assess the sustainability of companies in their host countries, mainly developed countries, with little relevance and transferability to emerging markets. The actions of international companies are often not observed in detail or perceived across company subsidiaries, so scores do not accurately integrate the views and voices of the various local stakeholders that are affected by company activities, especially indigenous communities.
Following a financial accounting approach, Gavira-Duron et al. (2020) study the effect of five financial ratios and the z-score on the environmental index, social responsibility index, corporate governance index, and sustainability index of companies listed in the Mexican Stock Exchange. The authors apply a panel data model using least squared, fixed effects in crossed sections and periods. The empirical evidence shows that total assets and the Z-Altman score are the most significative variables, signaling they are negatively correlated and with corporate sustainable performance, environmental index, social responsibility, and corporate governance. The evidence is limited due to the sample is small and it is employed a unique model. Findings also reveal that the firms listed have extra costs derived from belonging to the index.
Finally, it is worth mention the work by Prima and Ikbal (2021) directly related to sustainable economic growth. The authors examine ESG Sustainable Development Goals (SDG) derived from a more responsible management of natural resources and their contribution to economic development. Prima and Ikbal employ a path analysis model to understand the relationship between natural resource rent, ESG performance, and the quality of economic development at the country level. Their research utilizes an OECD countries data, covering from 2000 to 2017. The results reveal a negative relationship between ESG performance and natural resource rent, i.e., better human development inhibits corruption and promotes better ESG performance. The two-way Granger causality test between natural resource rent and ESG performance indicates that ESG performance may be influenced more by the quality of institutions than by the size of the economy. Good institutions allow the economy to achieve an optimal allocation of resources.
Summing up, regarding developed countries, although mixed evidence is reported in the literature, overall applications of green shares financing ESG mandates are positive. They have led to better competitive results and no doubt in mind are contributing to mitigate human caused damages to the environment. On the contrary, several studies acknowledge that green financing and ESG is nascent in developing countries, partly because corporate disclosure, and their institutional and legal framework to enforce sustainable development is weak.
In the case of Mexico, although is a middle-developed country, it still needs a detailed taxonomy to identify key concepts, measures and disclosure standards as part of a full body of laws and regulations. Many norms are dispersed along the legal Mexican system in what can be regarded as normative ESG (ILG.com, 2022). Additionally, it is worth noting that the Mexican Stock Market is surprisingly small (140 shares traded on average) and the general index tracks the performance of only 35 leading companies. Moreover, the ESG index measures price and returns performance of shares that fulfill stock market sustainability criteria. Considering all of this, the constituents of this year’s new S&P/BMV Total Mexico ESG Index are: ALFA A, ALSEA, AC, BSMX B, CEMEX CPO, KOF UBL, VESTA, CREAL, FUNO 11, FEMSA UBD, LAB B, GENTERA, OMA B, GAP B, ASUR B, BIMBO A, GFNORTE O, HERDEZ, AGUA, TLEVISA CPO, PE&OLES, IENOVA, KIMBER A, NEMAK A, ORBIA, FIBRAPL 14, Q, RA, WALMEX.
Rather than involved with environment friendly products or clean energy sources, these firms mainly control residuals, use of low contaminating fuels for their operations and sales distribution and similar schemes. However, it is worth noting a positive innovation. An older version of the ESG index2020 used ratings from institutions tasked specifically with grading if a company was considered sustainable or not (basically a yes or no flag); since 2020, the new index applies S&P ESG ratings and benchmarks which includes the SAM corporate sustainability assessment. A final consideration must be made: Due to long standing social inequities, financial inclusion is still low (68.0% of the population; 32,0% do not have access to financial services) (CNBV, 2022).
3. Data and Methodology
ESG investing has emerged from investment approaches such as Socially Responsible Investment (SRI), but there are important distinctions. Traditional models often use value judgments and negative selection to determine which companies to invest in. ESG investment and analysis, on the other hand, aims not only to support a set of values, but also to find value for the company. Underlying these decisions are factors intrinsic to economic, environmental, and social dimensions.
S&P Global (2022a) defines a financially significant factor as any variable that, now or in the future, may affect a company's driving force, earnings potential, competitive position or long-term shareholder value. These factors are either social or environmental. Significant ESG issues are those that may have a broader impact directly or through an organization's business operations, cash flow, legal or regulatory obligations, access to capital or reputation, and relationships with key stakeholders, the environment or society at large, either directly or through its value chain.
Hundreds of sustainability criteria can be applied, but typically only a few important ESG factors affect the future success of a company's business model. There is no consensus or comprehensive list of ESG categories. As shown in the Table 1, ESG factors are often interrelated and it can be difficult to classify ESG issues into environmental, social or governance.
These ESG factors are often measurable (e.g., level of turnover of company employees), but assigning a monetary value to them can be difficult (e.g., Company employees, Cost of turnover).
Table 1 ESG Dimensions
| Social Dimension Criteria Topics | Environmental Dimension Criteria Topics | Governance & Economic Criteria Topics |
|---|---|---|
| Addressing Cost Burden | Biodiversity | Anti-crime Policy & Measures |
| Asset Closure Management | Building Materials | Brand Management |
| Corporate Citizenship and Philatropy | Climate Strategy | Codes of Business Conduct |
| Financial Inclusion | Co-Processing | Compliance with Applicable Export Control Regimes |
| Health Outcome Contribution | Electricity Generation | Corporate Governance |
| Human Capital Development | Environmental Policy & Management Systems | Customer Relationship Management |
| Human Rights | Environmental Reporting | Efficiency |
| Labor Practice Indicators | Fuel Efficency | Energy Mix |
| Local Impact of Business Operations | Genetically Modified Organisms | Financial Stability and Systemic Risk |
| Occupational Health and Safety | Low Carbon Strategy | Fleet Management |
| Partnerships Towards Sustainable Healthcare | Mineral Waste Management | Health & Nutrition |
| Passenger Safety | Operational Eco-Efficiency | Information Security/Cybersecurity & System Availability |
| Responsibility of Content | Packaging | Innovation Management |
| Social Impacts on Communities | Product Stewardship | Market Opportunities |
| Social Integration & Regeneration | Raw Material Sourcing | Market Practices |
| Social Reporting | Recycling Strategy | Materiality |
| Stakeholder Engagement | Resource Conservation and Resource Efficiency | Network Reliability |
| Strategy to Improve Access to Drugs or Products | Sustainable Forestry Practices | Policy Influence |
| Talent Attraction & Retention | Transmission & Distribution | Principles for Sustainable Insurance |
| Water Operations | Privacy Protection | |
| Water Related Risks | Product Quality and Recall Management | |
| Reliability | ||
| Risk & Crisis Management | ||
| Strategy for Emmerging Markets | ||
| Supply Chain Management | ||
| Sustainable Construction | ||
| Sustainable Finance | ||
| Water Related Risks |
Source: S&P Global (2022)
In this respect, as previously stated, to capture those multiple dimensions and factors influencing ESG investment decisions, we resort to measure sustainable asset performance, risk, and interaction with other regular assets, employing the ESG Index, vis a vis other conventional “dirty” index.
ESG Mexican Bourse Index
The S&P/BMV IPC ESG Tilted Index was developed to gauge the performance of S&P/BMV IPC constituents that meet sustainability criteria, while enhancing the global S&P DJI, ESG score compared to the S&P/BMV IPC upweights or downweighs companies’ capitalization, based on S&P DJI ESG ratings. It was listed by the first time on March 21, 2014.
IPC Overall Index
The S&P/BMV IPC measures the performance of the main liquid stocks listed on the Mexican Stock Exchange. The index is intended to offer a broad, representative but easily replicable index covering the Mexican stock market. The constituents are capitalization-weighted to consider diversification requirements.
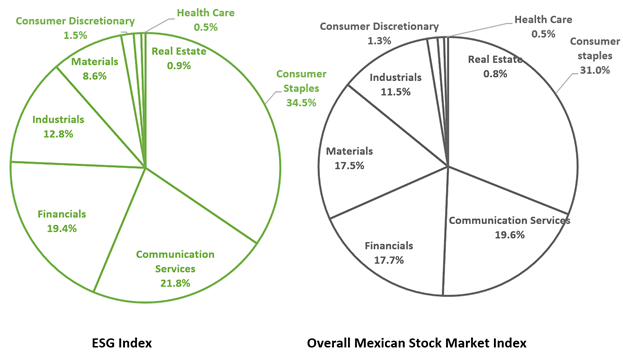
Figure 1 shows the sector breakdown of each index. Although there are differences in the weight of the sectors, the top three in common are: Consumer Goods, Communication Services, and Financials. The ESG index has a higher share in the industrial (12.8%), financial (19.4%), and communications services (21.8%) compared with Overall Stock Market Index: 11.5%, 17.7%, and 19.6%, respectively.
Series Graphical Analysis
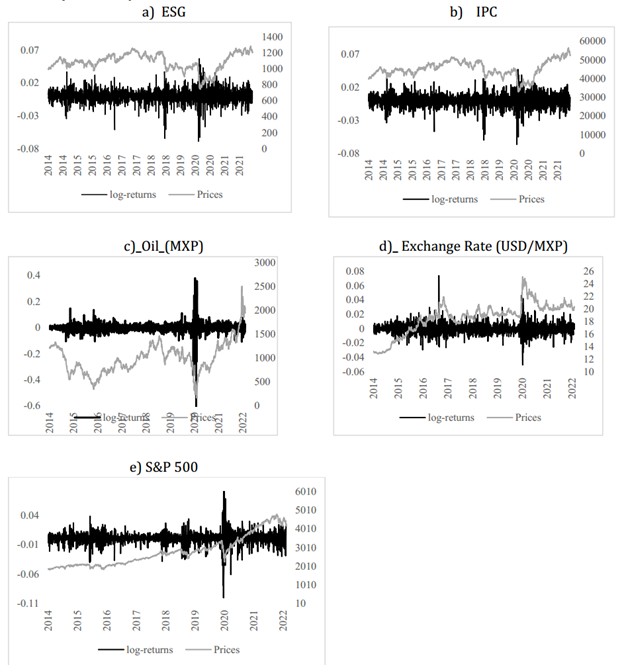
Figure 2 shows the prices and logarithmic returns of the series studied. As expected, the ESG and IPC indices evolve similarly. Although the ESG index shows greater variation and larger extreme values. Both series showed higher variations during periods related to BREXIT (2015), international benchmark interest rate cuts (2018) and the Covid-19 pandemic.
The graphical analysis of Mexican oil prices and returns shows that prices fall sharply when the pandemic was declared, at the end of January 2020, as all economic activities were paralyzed. In April 2022, when containment measures were relaxed, the oil price recovered and presented a positive trend. This slope was reinforced by the uncertainty created by the Russia-Ukraine conflict, especially from January to March 2022.
In terms of returns, the series experienced a period of high volatility from 2014 to 2016 due to oversupply and the slowdown in the Chinese economy, the world's largest oil consumer. From 2016 to 2019 oil returns experienced a period of relative calm. This state was interrupted with the Covid-19 lockdown, generating a period of extreme variation from December 2019 to April 2020.
In Figure 2 panel d), MXP/USD prices and returns are observed. From 2014 to 2017 Mexican Peso experienced a depreciation in terms of US dollar, due to the deterioration of the balance of trade, Brexit announcement and the triumph of Trump in the presidential elections and the uncertainty associated with NAFTA renegotiation. In 2017, Mexican peso was recovery due to the weakness of the dollar against euro. 2017-2020 seems to be a relative calm subperiod. In 2020 Mexican peso was sharply depreciated due to the Covid-19 crisis. At the end of 2020, Mexican currency recovered its price to September 2019 levels.
Panel e) presents the prices and returns of the S&P 500. Prices show a positive trend throughout the period. In 2020, the index fell sharply due to the Covid-19 pandemic and negative expectations about the international economy. In February 2022, there was a negative result derived of international imbalances related to the military conflict between Ukraine and Russia.
3.1 Methodology
As it was previously analyzed, financial series are characterized to present stylized facts: non-normality in the log-returns distribution, long memory in returns and volatility, volatility clusters, to mention some of them. In this regard, Generalized Autoregressive Conditional Heteroscedasticity (GARCH) model under t-Student distribution is proposed to capture the financial series performance.
Once, conditional volatility is modeled for each series, a Markov Switching Vector Autoregressive (MSVAR) is developed to analyze whether the ESG and IPC volatility indices is influenced by the oil, exchange rate and foreign stock market (S&P500) volatility.
GARCH model
Autoregressive conditional heteroscedasticity (ARCH) and its generalization (GARCH) models represent the main approaches to model and forecast stock market volatility in quantitative finance. In this research, we utilize a Generalized Autoregressive Conditional Heteroscedasticity (GARCH) model under t-Student distribution to measure conditional volatility in two indexes of the Mexican stock market: ESG and IPC, Mexican Oil Prices, MXP/USD currency price and the S&P500 index.
In the GARCH model, the conditional variance is denoted as a linear function of a long term mean of the variance, its own lags, and the previous realized variance. The simplest model specification is the GARCH (1,1) model, presented in the following equation (Brooks, 2008):
Mean equation
Variance equation
Where
Where
Markov Switching Vector Autoregressive
The MS-VAR is a multivariate extension of the univariate Markov switching autoregressive model (MS-AR) (Krolzig, 1997). The idea behind this approach is that the VAR parameters process are not static as linear models assume; it means, parameters are time-varying according to the regime (Pontines and Siregar, 2009).
The regime-generating process determining which regime
The process was applied to examine whether key financial factors volatility was transmitted to sustainable and overall Mexican Bourse Indexes. The MS-VAR model can be expressed as follows:
Where
The use of MS-VAR avoids the haphazard selection of the crisis episodes to one that endogenizes the process separating crisis from calm periods. Therefore, the debate about the sample selection bias is eluded which other analyses of contagion are subjected to (Pontines & Siregar, 2009).
4. Results
To identify the distributional properties of financial series and verify basic characteristics, Table 1 shows the Descriptive Statistics and the Stability Tests. As it can be observed, the IPC Overall index shows higher mean return, i. e., it has higher profitability during the period of study. The series with higher variations corresponds to the Mexican Oil Price, followed by the S&P 500 index. The three-stock market index are negative skew, while the oil price (OILP) and exchange rate (XR) are positive skew.
In terms of the stability tests, Jarque Bera (JB) statistics confirm the non-normality of the returns distribution, Q and Q2(20) Ljung allows to reject the autocorrelation in residuals and squared residuals and, ARCH-LM results reveal the existence of ARCH effects in the residuals series of the mean equation and therefore the variance of the returns series are non-constant. Hence, GARCH model is suitable to capture the volatility of financial series under study.
Table 1 Descriptive Statistics and Stability Tests
| IPC35 | ESG | OILP | S_P500 | XR | |
|---|---|---|---|---|---|
| Mean | 0.00016 | 0.00012 | 0.00069 | 0.00047 | 0.00022 |
| Maximum | 0.04744 | 0.05714 | 0.38039 | 0.08968 | 0.07372 |
| Minimum | -0.06638 | -0.06871 | -0.36671 | -0.09995 | -0.05056 |
| Std. Dev. | 0.01012 | 0.01083 | 0.03504 | 0.01112 | 0.00795 |
| Skewness | -0.51326 | -0.49020 | 0.74667 | -0.43330 | 0.79486 |
| Kurtosis | 7.03833 | 7.69830 | 35.49508 | 15.81097 | 11.05424 |
| JB | 1362.9*** | 1808.3*** | 83065.6*** | 12942.4*** | 5290.7*** |
| Q(20) | 61.69*** | 56.05*** | 160.21*** | 122.65*** | 43.44*** |
| Q2(20) Ljung | 61.53*** | 56.02*** | 167.64*** | 105.91*** | 41.44*** |
| ARCH-LM (1) | 9.636*** | 5.714** | 45.028*** | 4.694** | 11.995*** |
Source: Own elaboration with estimation results. ***, ** and * denote 1%, 5% and 10% of statistical significance
Table 2 Phillip-Perron Unit Root Test
| Intercept | Intercept and trend | None | ||||||||||
|---|---|---|---|---|---|---|---|---|---|---|---|---|
| Levels | FD | Levels | FD | Levels | FD | |||||||
| t-Stat | t-Stat | t-Stat | t-Stat | t-Stat | t-Stat | |||||||
| IPC35 | -40.352 | *** | -99.282 | *** | -40.353 | *** | -99.891 | *** | -40.347 | *** | -98.445 | *** |
| IPC_ESG | -40.903 | *** | -102.775 | *** | -40.918 | *** | -102.873 | *** | -40.910 | *** | -102.082 | *** |
| OILP | -37.219 | *** | -96.195 | *** | -37.219 | *** | -97.790 | *** | -37.154 | *** | -93.453 | *** |
| S_P500 | -45.194 | *** | -103.987 | *** | -45.180 | *** | -103.963 | *** | -45.423 | *** | -104.026 | *** |
| XR | -40.088 | *** | -144.579 | *** | -40.074 | *** | -153.565 | *** | -40.041 | *** | -136.687 | *** |
Source: Own elaboration with estimation results. *** denotes 1% of statistical significance
Table 3 GARCH t-Student (1,1) Results
| OILP | ||||
|---|---|---|---|---|
| Coef | St Error | t-value | ||
| α0 | 0.176348 | *** | 0.061798 | 2.854 |
| α1 | 0.122613 | *** | 0.02008 | 6.106 |
| β1 | 0.864321 | *** | 0.02069 | 41.77 |
| α1+β1 | 0.986934 | |||
| DF | 4.702878 | ** | 0.56126 | 8.379 |
| S_P500 | ||||
| α0 | 5.307568 | ** | 2.3916 | 2.219 |
| α1 | 0.217208 | *** | 0.054955 | 3.952 |
| β1 | 0.735507 | *** | 0.060697 | 12.12 |
| α1+β1 | 0.952715 | |||
| DF | 10.576399 | ** | 4.9498 | 2.137 |
| XR | ||||
| α0 | 1.396203 | ** | 0.65415 | 2.134 |
| α1 | 0.125726 | *** | 0.027362 | 4.595 |
| β1 | 0.859179 | *** | 0.031468 | 27.3 |
| α1+β1 | 0.984905 | |||
| DF | 6.285339 | *** | 0.87706 | 7.166 |
Source: Own Elaboration with estimation results. ***, ** and * denote 1%, 5% and 10% of statistical significance
Table 2 presents the Phillips-Perron unit root test. The results allow rejecting the null hypothesis of a unit root in levels and First Differences (FD). Therefore, we conclude that the returns series might be considered as stationary over the specified period.
Once, the stationarity condition, the ARCH-LM effect and non-normality in the returns distribution are confirmed, the univariate GARCH (1,1) t-Student model is applied, and the results are shown in Table 3.
All the coefficients are statistically significant, at least at 5%, the vast majority
at 1%. In all the cases,
Finally, to test the goodness of fit and the robustness of the univariate GARCH results, the ARCH-LM and the Ljung-box Q-statistic (Q2) tests are run to verify there is no ARCH effect in series and there is absence of autocorrelation in the GARCH residuals.
Table 4 and 5 show the MS-VAR models results. Table 4 presents the parameters which indicates if there is or not influence of oil price, exchange rate and foreign stock market (S&P 500) on the ESG index. Findings suggest the standard deviation of the financial variables are higher in regime one (high volatility regime) than in regime two (low volatility regime). It indicates the presence of two different volatility regimes.
The estimated coefficients capturing the impact of financial variables volatility on
the ESG volatility (
In terms of the average duration of each regime, as it was expected, the high volatility regime has a lower duration, than the low volatility regime, around 2 and 5 days, respectively. The probability that a day of high volatility will be followed by a day of high volatility (transition probability P11) is around 37% for all the models. In contrast, the probability that a day of low volatility will be followed by a day of low volatility (transition probability P22) is around 80%.
| Oil | MXP/USD | S&P 500 | ||||
|---|---|---|---|---|---|---|
| α1 | 1.80E-05 | *** | 1.77E-05 | *** | 2.07E-05 | *** |
| α21 | 1.0181 | *** | 0.997266 | *** | 0.962927 | *** |
| α22 | 0.877706 | *** | 0.87747 | *** | 0.877087 | *** |
| α31 | 0.000398 | 0.057902 | * | 0.024723 | *** | |
| α32 | -8.22E-08 | 0.000406 | 0.000416 | |||
| P11 | 0.373247 | 0.374128 | 0.378517 | |||
| P22 | 0.808219 | 0.810596 | 0.804733 | |||
| Average Duration | ||||||
| Regime 1 | 1.595526 | 1.597771 | 1.609055 | |||
| Regime 2 | 5.214284 | 5.279709 | 5.121187 | |||
| Standard Deviation | ||||||
| Regime 1 | -10.03147 | -10.03129 | -10.06222 | |||
| Regime 2 | -12.62698 | -12.6198 | >-12.64382 | |||
Source: Own elaboration with estimation results. Reported values are statistic significance levels of *1%,** 5% and 10% ***.
In Table 5 the MS-VAR model results are presented for the overall index: IPC. Empirical evidence indicates the presence of two different volatility regimes.
The estimated coefficients capturing the impact of financial variables volatility on the IPC volatility (β_31 and β_32) are not significant for the oil volatility and exchange rate, i.e., there is not a significant influence of oil price and exchange rate volatility on IPC index. Nevertheless, those parameters are statistically significant in the case of S&P 500 volatility, for both regimes. It means, the foreign stock market has a significant effect on IPC index during both regimes: high and low volatility.
Regarding to the average duration of each regime, as it was expected, the high volatility regime has a lower duration, than the low volatility regime, around 2 and 5 days, respectively. The probability that a day of high volatility will be followed by a day of high volatility (transition probability P11) is between 35% and 37% for all the models. In contrast, the probability that a day of low volatility will be followed by a day of low volatility (transition probability P22) is between 78% and 80%.
Discussion
Due to its recent inception, research on ESG assets is still ongoing and the empirical evidence found is diverse. The results vary according to the countries, periods and variables analyzed. Regarding the impact of exchange rate volatility on stock market volatility, the data are mixed. Andersson et al. (2020) found a statistically significant relationship between ESG international portfolio returns and currency market. This relationship is stronger in the short term and decreases over time. Singh, Makhija, and Chacko (2021) evidenced no effect of pandemic on the return and volatility of the S&P ESG 100 index, in contrast to the positive effect of pandemic on currency and FX volatility.
In terms of the differential performance of ESG and conventional indices, Jain, Sharma and Srisvastava (2019) found an informative flow between the two types of assets. However, they did not find a significant difference in terms of performance, i.e., both are good substitutes in investment strategies. The influence of the U.S. stock market on the Mexican market has been widely analyzed due to the economic, commercial, and financial proximity, especially since the signing of the North American Trade Agreement (NAFTA) (Chukwuogor & Kasibhatla, 2007; Álvarez-Ramírez, et al. 2008; López Herrera, Ortiz and Cabello, 2009; Cermeño Bazán & Solís Montes, 2012; Moreno et al., 2015).
Studies on the volatility relationship between Mexican and U.S. stock markets have evidenced that there is a time-varying interdependence and asymmetric volatility. Another important finding is that volatility increased during subperiods of turbulence such as the Global Financial Crisis (Sosa & Ortiz, 2017, and Nava, Di Matteo & Aste, 2018; Rodríguez Benavides, Martínez García & Hoyos Reyes, 2019). Our empirical findings are complementary and allow us to reinforce the statistically significant influence of the S&P 500 on the CPI, but not on the ESG index.
The higher sensitivity of IPC index foreign stock market could be explained due to the different composition of each index. In the conventional index, materials and industrial sectors have higher share. These sectors are recognized in the financial literature as highly sensitive to financial contagion with the U. S. stock markets (Lim, 2011; Lin, 2012; Jiranyakul, 2016). In this regard, Vasquez and Pacheco (2021) found the Mexican material sector has shown higher correlation with the S&P500. Brito (2020) also confirmed that during the subprime crisis the Mexican sectorial indexes with higher contagion effect from American sectorial index were industrial and materials.
The empirical evidence on the lack of impact of oil price volatility incidence on IPC and ESG stock indexes volatility differ from other studies, a result somewhat disconcerting. Jabeur, Khalfaoui & Arfi (2021) reported that higher values of ESG assets lead to lower crude oil prices. Maraka and Bein (2020) results show a significant spillover between sustainability stock returns and international oil prices. Büyükkara, Enginar & Temiz (2020) findings reveal bilateral volatility spillover between oil price and G7 stock markets returns, since the beginning of the 2014 oversupply period.
As mentioned, the difference in the results could be explained by the fact that different periods and economies are analyzed. Another important difference is that we analyze an emerging, oil-producing economy, which has been implementing an oil hedging program. This program could mitigate the impact of oil price volatility on stock market indices in comparison with other economies.
5. Conclusion
The global economy is undergoing an important transition to attain sustainable development. Given the evidence of the considerable growth of ESG financing worldwide, researchers tend to analyze whether ESG assets behave and react differently/similarly compared to conventional ones. Despite having an essential implication for portfolio management, the impact of key financial variables on the volatility of conventional and ESG Mexican indices has not been explored.
The main contribution of this research is to provide evidence of the differential risk exposure of the ESG and conventional indexes. Empirical findings suggest that the ESG Mexican index has a statistically significant influence of the FX market and the foreign stock market (S&P 500), during the high volatility subperiods, but not during the calm episodes. In terms of conventional index volatility, results suggest a strong relationship with the American stock market volatility, during distress and stability moments.
Our findings have important implications for investors in terms of investment decisions, hedging strategies, asset allocation, diversification strategies and sustainability. Considering the small size of the Mexican stock Market, and Mexican still embryonic institutions to promote corporate ESG, as well as investors’ activism in green financing and green investments, increased participation of public authorities must be considered to deepen the importance of the stock exchange, increase financial inclusion, and strengthen institutions and regulations devoted to sustainable development.
The agenda or further studies must include other green or sustainable indexes, other economic or financial variables (disclosure, interest rate and inflation), financial ratios related to ESG concepts, comparison among different economies and markets. Additionally, the role of the Mexican banking system promoting (local) green finance and ESG must be carefully assessed.

