


 text new page (beta)
 English (pdf)
 Article in xml format
 Article references
 Send this article by e-mail
 Cited by SciELO
  Similars in
SciELO
Similars in
SciELO 
 Permalink
Introduction
Amber interest is mostly originated in jewelry, due to its peculiar color hues, and in archeology, since it encapsulates paleontological remains [1]. Environment interaction during amber formation makes it an important source of fossilized species and geological evidence. Amber is formed from natural resins exudated from coniferous trees such as Succinifera Araucariacae, Hymenaea and Dipterocarpacea [2]. This resin is transformed to amber by a complex fossilization process called “amberization”, in which organic compounds are volatilized, and the crosslinking of labdane diterpene resin takes place [3]. Amber formation is a geological process taking place under specific pressure and temperature conditions. As consequence, amber deposits are found in few places: The Baltic Sea, Spain, France, Dominican Republic, and Mexico [4,5]. Mexican amber deposits are found in the state of Chiapas, specifically in the towns of “Totolapa”, “Huitiupán” and “Simojovel de Allende” [1].
It has been reported the use of several analytical techniques for the characterization of amber [6,7]. FTIR spectroscopy results showed that amber chemical structure, independently of its geographic origin, is related to C-O and C=O bonds characteristics of esters and other organic compounds [8,9]. Amber and copal samples have been analyzed by Raman spectroscopy establishing that the strength ratio of the C=H to C-H signals are correlated with the maturity of the resin [10]. Riquelme et al. analyzed the presence of sulfur in Chiapas amber and recently formed resins [11], reporting that the proportion of sulfur in amber is significantly higher. However, amber is characterized by less oxidized sulfur states. López-Morales et al. studied Chiapas amber [12], they reported that refractive index determination and fluorescence spectroscopy are valuable techniques to identify fake amber, recommending to use Raman spectroscopy as a direct method to identify amber counterfeit. Villani et al. characterized mexican amber [13] using gemological analysis, X-ray diffraction, FTIR and secondary ion mass spectrometry; XRD results shown an amorphous pattern accompanied by traces of refikite (C19H31COOH), hartite (C20H34) and calcite (CaCO3). Mass spectrometry results showed that mexican amber lacks succinic acid.
As amber optical properties are so valuable it is necessary to identify the origin of its color. It is expected that elemental impurities, incorporated to the polymeric matrix of amber during its formation process, determined the absorption mechanisms giving place to its chromatic characteristic.
In this work, we characterized a yellow Chiapas amber using X-ray photoemission (XPS) and optical spectroscopies. XPS sensitivity allows the detection of most of the chemical elements and their chemical interaction environment. The evidence of sulfur content in Mexican amber, obtained from XPS, makes plausible the hypothesis that its chemical environment plays a fundamental role on its characteristics color.
Materials and Methods
A certified Mexican amber piece, purchased from the "Museo del ámbar de Chiapas", is used in this study. The amber piece has a pale-yellow color and it is identified as yellow amber. Sample was polished to obtain a mirror like surface. The polishing process employed sandpaper with different grain sizes: 600, 1000, 1500, 2000 and 2500 grit. Finally, a polishing paste was used to reach a mirror-like finish. Sample dimensions were 1cm × 1cm × 0.22 cm. The thickness was measured using an absolute digimatic indicator Mitutoyo, model ID-S1012XB. The elemental concentration in the sample was obtained by energy dispersive spectroscopy (EDS), using a scanning electron microscope (SEM) Carl Zeiss Auriga.
The X-ray Photoelectron Spectroscopy studies were carried out employing a K alpha Thermo Scientific system. The general survey as well as the high-resolution spectra in the regions of the C1s and S2p were obtained after 30 s of etching employing Ar ions. The binding energy of the aliphatic component of C1s line was taken as the reference peak to calibrate the obtained spectra. XPS peaks were fitted employing asymmetric Gaussian-Lorentzian functions. A background subtraction was performed by using the mathematical model derived by Shirley.
The optical transmission of the sample was measured using a Perkin Elmer spectrophotometer, model Lambda 40.
Results and discussion
The EDS results shown that the sample is mainly composed by carbon (87.86 ± 9.19 at%), oxygen (12.01 ± 2.14 at%) and small amounts of sulfur (0.06 ± 0.02 at%). The presence of sulfur has been reported previously [11].
In Figure 1, we can see the XPS survey spectrum; the peaks are related with the C1s, O1s, S2p, S2s photoelectron emission and a CKVV Auger peak. The identification of the above-mentioned elements is in agreement with the EDS results.

The fact that XPS is very sensitive to the chemical environment of each element, reflected as a change in peak energy, is very useful to understand how atoms are incorporated within the material. The emission of electrons from the surface of an insulator during X-ray irradiation produces a positive surface potential, because the electrons ejected from the surface cannot be compensated by those from the bulk. Surface positive charging conveys to a decrease of the kinetic energy of the ejected photoelectrons, which is related with a decrease of the binding energy. For a correct sample characterization using XPS a good determination of the peak shift due to the charge effects is crucial. Briggs et al. [14] reported an extensive study of high resolution XPS of organic polymers, they determined the binding energy for different chemical environment of the elements present in the polymers. The analysis of all peaks present in the X-ray photoemission spectrum is very important to obtain the correct peak shift due to charge effect.
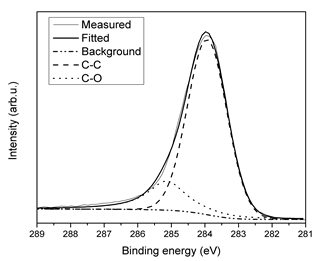
In the curve fitting procedure, we correlated the binding energy positions so that they maintain a constant separation; and the FWHM (full width at half maximum) of the peaks were equal; XPSPEAK4.1 was the software used. The C1s peak was fitted employing the binding energies of chemical states associated to C-C (284.8 eV) and C-O-C (286.0 eV) interactions [15]. In Figure 2, we can see the curve fitting to the C1s of the high-resolution spectrum, it is evident the good adjust to the experimental data. A shift of 0.80 eV was obtained and applied to the high-resolution spectrum of the S2p signal.
The high-resolution spectrum of the 2p sulfur peak is determined by its chemical environment and could elucidate the role that sulfur has on the optical properties of Mexican amber. Figure 3 shows the adjustment to the high resolution spectrum of 2p sulfur employing two peaks corresponding to: sulfur atoms bonded to carbon atoms (C60(S8)2) at 163.7 eV and sulfur molecules (S8) at 164.4 eV [16]. The reports of characterization of amber using the XPS technique are scarce, we only found one pair [6,17] corresponding to amber obtained from European countries in which the peak related to sulfur is assigned to sulfate species with a binding energy of 168.4 eV. Our results for Mexican amber are different and correspond to sulfur molecules and to sulfur incorporated within a carbon matrix. Our results are in agreement with the report by Riquelme et al. [11], where they found a K edge of sulfur in the characterization of amber from Chiapas by XANES spectroscopy. The fact that we do not find sulfur in reduced or intermediate states could be due to the low abundance of these species in the studied sample.

A composite may be described as particles randomly dispersed within a host material. Then, as a rough approximation we can considerate the Mexican amber as a composite material: a polymer matrix with sulfur inclusions.
Several model, employing different geometries for inclusions, have been considered to determinate the optical effective medium of a composite between them: Maxwell Garnett, Bruggeman, Layered and Fractal. The Maxwell Garnett model assumed that the inclusion radius is smaller than the optical wavelength. Using this consideration, we have simulated the optical transmission using the effective medium theory of Maxwell-Garnett. The value of 1.548 has been reported for the index of refraction (n) of Chiapas amber [12], then we can use a transparent polymer with a refraction index close to this value: we choose that of polyethylene. Then, our composite material for simulate the optical transmission was a polyethylene matrix with sulfur inclusions. The values for index of refraction and extinction coefficient of polyethylene were taken from the literature [18]. The simulation was done using the SCOUT software, in the interval of 300 nm to 900 nm, changing the amount of sulfur inclusions. In Figure 4 the simulated transmission spectra for different concentration of sulfur clusters in the polyethylene host material are included. The absorption edge presented a shift, as the amount of sulfur increases, associated to the variation of the extinction coefficient as predicted by the effective medium theory.

Figure 4 Optical transmission simulation for a composite material polyethylene-sulfur; with different concentration of sulfur.
Amber is an opaque polymer; the opacity is caused by bulk defects; then sulfur inclusions and bulk defects could be considered as dispersion centers. When dispersion centers have dimensions smaller than the wavelength, the dispersion could be described by the Rayleigh approximation; and when the dispersion centers are larger than one tenth of the wavelength, the dispersion could be described by the Mie approximation.
The transmission spectrum is calculated using Beer’s equation, we can considerate that the coefficient of the total absorption is the sum of the absorption due to the material and a contribution due to the sulfur inclusions. It is worth to emphasize that the effect of sulfur inclusions on the absorption spectrum is due to a scattering process. The intensity of the transmission is described by:
Where: I is the intensity; I0 is the initial intensity; µt is the total absorption coefficient; µs is the scattering absorption coefficient; µa is the absorption coefficient of the material: and z is the sample thickness. In the equation (1) we can see that the transmission of the material with scattering centers is approximated by a transmission without scattering multiplied by an exponential dependence with takes in account the scattering.
To the best of our knowledge, there are no reports of the optical constants and scattering coefficient for the amber. We considered that the process of light scattering taken place in amber is similar to that observed in biological tissues [19,20].
A first approximation to determine µs is to use the formula reported in [20], the scattering absorption is described by:
In equation (2), λ is normalized to a reference wavelength, to yield a dimensionless value; the reference wavelength is 500 nm. The absorption scattering is described in terms of the separate contributions of Rayleigh and Mie scattering. In the equation (2): a is a constant: f Ray is the fraction of Rayleigh scattering; (1- f Ray) is the fraction of Mie scattering and bMie is the exponent of Mie. Because subcutaneous fat have an opacity similar to amber we employ the reported values of a = 14.7 cm-1 and bMie= 0.25. The value of 0.006 for f Ray was employed because the sulfur concentration for yellow amber is 0.6 %, as determined with the EDS measurement.
The experimental transmission spectrum for amber is reported in Figure 5, curve (b). Curve (a) in Figure 5 corresponds to the calculated transmission spectrum obtained employing Beer’s model while curve (c) corresponds to the transmission spectrum calculated taking in account the scattering process due to sulfur. The trend observed in curve (c) support the interpretation that optical properties of amber are determined by the sulfur content.

Figure 5 (a) Optical transmission simulated for a concentration of 0.5 % of sulfur; (b) Normalized optical transmission of the sample; and (c) the optical transmission simulated for a concentration of 0.5 % of sulfur employing a correction due to scattering.
Further studies on different amber samples are under way to get a deeper insight in the scattering mechanism and obtain a better adjust with the experimental data.
Conclusions
The XPS results suggested that sulfur is incorporated in amber on two chemical environments, one related with the C-S and another to S-S interactions. The simulation of the optical transmission of the sample, considering the Mexican amber as a composite material are in good agreement with the experimental result.

