SciELO - Scientific Electronic Library Online

 
vol.31 issue1Photoacoustic spectroscopy applied to the juice and rind characterization of Citrus latifolia with different quality of samplesSensing parameters as a function of the chemical structure and thickness of two poly(styrene)-type based composites with carbon black author indexsubject indexsearch form
Home Pagealphabetic serial listing  

Services on Demand

Journal

Article

Indicators

Related links

  • Have no similar articlesSimilars in SciELO

Share


Superficies y vacío

Print version ISSN 1665-3521

Superf. vacío vol.31 n.1 Ciudad de México Jan./Mar. 2018


Research Papers

Thermal characterization of castor oil as additive in lubricant oil using photothermal techniques

G. Lara-Hernandez1  # 

J.C. Benavides-Parra1  & 

A. Cruz-Orea1 

E. Contreras-Gallegos2 

C. Hernández-Aguilar2 

J.J.A. Flores-Cuautle3  *  

1Departamento de Física, Centro de Investigación y de Estudios Avanzados del I.P.N Gustavo A. Madero, 07360, Cd. Méx., México.

2 Sección de Estudios de Posgrado en Investigación-ESIME-IPN, U.P.A.L.M. Gustavo A. Madero, 07730, Cd. Méx., México.

3 CONACyT / División de Estudios de Posgrado e Investigación, Instituto Tecnológico de Orizaba, Orizaba, 94320, Ver., México


Abstract

Over the last years extensively research has been carried out on full or partial substitution of supplies resources coming from renewable resources on traditionally non-renewable, in the case of the automobile sector there are progresses in bio-combustibles (biofuel) and synthetic oils coming from vegetable sources. There are strong efforts to find oil additives which can improve oils features in automobile industry, by adding vegetables oils to commercial lubricant oils, is expected to improve oil thermal stability. In the present research, different ratios of castor oil (ricinus comunis)-motor oil blends were obtained and their thermal properties were characterized by using the so-called Back and Front Photopyroelectric (BPPE/FPPE) techniques. Several oil-additives concentrations were measured and thermal diffusivities and effusivities as well as densities are reported, getting full thermal characterization for every concentration.

Palabras clave: castor oil; photothermal techniques; thermal characterization; oil additive

Introduction

The awareness of pollution, scarce of fossil fuels and the environmental footprint, are rising and they are subject of important research around the world, regarding fuels there is an important concern about the development of ecological friendly combustibles and two main research lines have been developed, the first one is the introduction of the so-called biodiesel, and the second one is the improvement of the existing fuels [1-5].

Regarding fuels, vegetable oils had appeared as the option of choice, not only as biodiesel source but also as additives in the fossil fuels. Among different varieties of seeds, available as biodiesel source and additive [1,3,4,6-10], Castor oil (ricinus comunis) is well known as renewable source of chemical industry [11-13] as well as biodiesel starting material [14-16]. Additionally, results from rheological behaviour of castor oil biodiesel suggest that pure castor oil increase viscosity when is used as oil additive and its chemical structure had been already studied [17], even though there is scarce information about its thermal behaviour of this oil as lubricant when it is used as oil additive.

As a way to give more insight about thermal properties of castor oil -synthetic oil blends SAE40W, which is a highly refined mineral oil, the present work deals with the thermal characterization of those mixes, using two well-known photopyroelectric methods: BPPE and FPPE techniques [18-20].

Experimental details

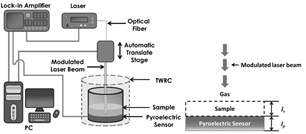
Photopyroelectric techniques are non-destructive methods used in thermal and optical characterization of many materials including liquid samples these techniques are characterized by using information carried on thermal waves generated over the pyroelectric detector as well as sample under study. BPPE is used to analyze thermal diffusivity of liquids and, it is based on the variation of the sample thickness by means of a setup showed in Figure 1.

Figure 1 Left: BPPE experimental setup, right: PE-sample arrange detail.  

In this experimental setup, the sample is enclosed in a chamber of variable length which is formed by a metal foil (Cu 100 μm thick) and PZT (500 μm thick) pyroelectric temperature sensor. A laser diode beam, impinges on the surface of the metallic foil, which acts as light absorber as well as thermal wave generator, laser beam is modulated by the internal oscillator of a lock-in amplifier, this arrange is known as thermal wave resonator cavity (TWRC).

Absorbed light at the metal foil induces thermal waves at sample metal interface those thermal waves travel through the sample and, have the same modulation frequency that the incident beam (f). The temperature oscillations at x = l can be measured using the pyroelectric (PE) sensor as a function of the sample thickness l s . For a thermally thin copper foil (aculcu ≪ 1), thermally thick sample (asls ≫ 1) and, thermally thick PE detector (aplp ≫ 1) (where aj=(πf/αj) ) is the thermal diffusion coefficient, l j and α j are the thickness and the thermal diffusivity of the j-th element in the PE cell), the output voltage can be expressed as [21, 22]:

V=Aηsapκp1+bspω0exp-aslsexp-iπ2+asls () 1

where A is an instrumental factor, η s is the nonradiative conversion efficiency for the absorbing sample, κ p is the thermal conductivity of the pyroelectric sensor, b sp = e s /e p , with ej the thermal effusivity of the j-th element in the PE cell and ω 0 the angular frequency of the laser beam (ω 0 = 2πf). When the light modulation frequency is fixed, the constant A and all the terms before the first exponential in Equation 1 remains constant and can be joined in a second constant (B), therefore the output voltage can be reduced as:

V=B exp-aslsexp-iπ2+asls ()2

From Equation 2 is possible to see that the measured voltage over the PE depends only on the sample thermal diffusivity (αs) and thickness. By performing a sample thickness scan, it is possible to get the sample thermal diffusivity from the slope of the logarithm of the photopyroelectric (PPE) signal amplitude as function of l s or from the slope of the linear PPE signal phase as a function of l s .

The light modulation frequency used in the present study was chosen at 0.5 Hz, in order to guarantee that sample and pyroelectric sensor were thermally thick; the light source was a diode laser beam, 40 mW power, at 785 nm wavelength.

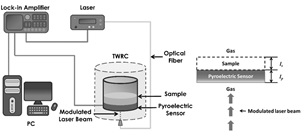
Thermal effusivity of oil blends were obtained by using the so-called Front Photopyroelectric Technique (FPPE),the experimental setup of this technique is shown in Figure 2, in this configuration the sample is placed on an intimate thermal contact with the PE detector and on the opposite site a modulated laser beam is applied, under the assumption that the sample is thermally thick, i.e. sample thermal diffusion length, μs=αsπf12 ,is shorter than sample thickness, then PE signal can be expressed as [19, 23]:

Figure 2 Left: FPPE technique setup, right PE-sample detail  

hw=C1-eσplp1+b+e-σplp-11-bg+1e-σplp1-b+1+geσplp1+b ()3

where C is a fitting parameter depending on every pyroelectric sensor, σ p is the PE complex thermal diffusion coefficient σ p = (1+i)/µ p , where: i=(-1) 1/2 and µ p = (α p /(πf)) 1/2 , with α p the PE sensor thermal diffusivity, l p is the PE thickness, b = e s /e p , g = e g /e p , with es, eg and ep, thermal effusivities for sample, air and pyroelectric sensor respectively, using Equation 3 and suitable frequency scan, sample thermal effusivity can be extracted by fitting the theoretical expression to the experimental data. All measurements were performed at room temperature.

Results and discussion

Thermal effusivity as function of castor oil concentration was obtained using the IPPE setup, PE thermal properties were determined a priori by using reference samples with well-known thermal properties. For castor oil- SAE40W oil blends in the 0 to 20 % range castor oil content, thermal effusivity behavior is showed in Figure 3, black squares represent the obtained experimental values, with the respectively confidence interval (± 15 Ws12m-2k-1 ), the solid curve is a fit with an exponential function, representing the exponential like behavior of the thermal effusivity as function of castor oil concentration. As expected thermal effusivity increases its value when castor oil content increases, due to castor oil thermal effusivity is about 60% higher than base oil [24].
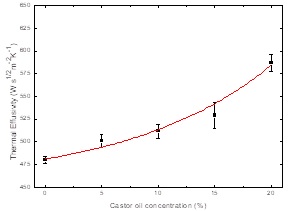
Figure 3 SAE 40W-castor oil blends thermal effusivity behavior as function of castor oil, solid line is a fit of thermal effusivity with an exponential function.  

Figure 4 shows the sample thermal diffusivities obtained by BPPE setup, using the sample thermal diffusivity as fitting parameter in Equation 2, confidence interval for each value was calculated by means of least squares method with a value of ± 3 x10⁻⁹ m2s-1 . As it can be seen between 10% and 15% of castor oil content, the SAE 40W thermal diffusivity values decreased from 8.9 m2s-1 , value close to the sesame oil or grape seed oil [25, 26], to 8.2 m2s-1 this is a reduction of around 8% of the initial value.
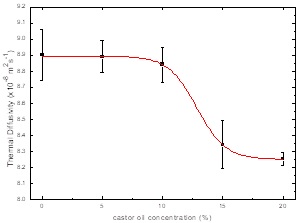
Figure 4 SAE 40W-castor oil blends thermal diffusivity behavior as function of castor oil, solid line is a fit of the thermal diffusivity with a sigmoidal function.  

Since the thermal diffusivity ( α s = κs /(ρscs) ) is inversely proportional to the sample density (ρs) and specific heat (cs), then if ρs or cs increases more than thermal conductivity ( κs) in the oil blends, as a function of the castor oil concentration, then the thermal diffusivity will tend to decrease. In this research it was also measured the density of the oil blends and these results are reported at the final of this section, then it will be possible to justify the behavior of the thermal diffusivity in the oil blends.

By using the relation κ=eα thermal conductivity was calculated from thermal diffusivity and effusivity measured, when compared thermal conductivities castor oil presents higher thermal conductivity (0.18 Wm-1K-1) than SAE 40W (0.159 Wm-1K-1) [26, 27] then, it is expected an increment in thermal conductivity when castor oil percentage rises.

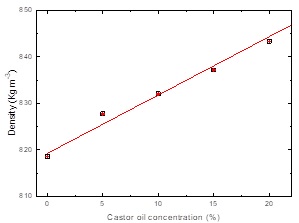
It was also measured the densities of the castor oil blends as a function of their concentration which are showed in Figure 5. Densities were measure using a pycnometer method at room temperature results show that castor oil blends present linear increment when castor oil content increase.

Figure 5 SAE 40W-castor oil blends density.  

Conclusions

Depending on castor oil percentage, thermal effusivity increases as Figure 3 shows, this can be due to pure castor oil thermal effusivity is higher than pure oil.

Blend densities increases as castor oil content increase; SAE 40W density is similar that Sperm whale and castor oil presents higher value [28-30], therefore it is expected and increase in density as function of castor oil content.

Castor oil content provokes that thermal diffusivity diminishes as sigmoidal function, this could be due to the increment in the oil blend densities, by using the relationship κ=eα thermal conductivity was obtained, from calculated values it is possible to see an increment in thermal conductivity as castor oil content rises, as expected due to castor oil thermal conductivity is higher compared with SAE 40W thermal conductivity, then it is possible to increase thermal conductivity by means of adding the adequate content of castor oil.

Acknowledgements

Authors want to thank to CONACYT through project 241330.

References

1 []. A. Balafoutis, S. Fountas, A. Natsis, G. Papadakis, ISRN Renewable Energy 2011, 1 (2011). http://dx.doi.org/10.5402/2011/531510 [ Links ]

2 []. E. Bedi, G.B. Olesen, R. Myles, Biodisel at Alternative fuels for transportation, DIERET (International Network for Sustainable Energy; retrieved on March 2018). http://www.inforse.org/europe/dieret/altfuels/biodiesel.htmLinks ]

3 []. Editorial “Vegetable oil as diesel fuel?” J. Am. Oil Chem. Soc. 57, A805 (1980). http://dx.doi.org/10.1007/bf02687667 [ Links ]

4 []. A. Campanella, E. Rustoy, A. Baldessari, M.A. Baltanás, Bioresour. Technol. 101, 245 (2010). http://dx.doi.org/10.1016/j.biortech.2009.08.035 [ Links ]

5 []. A. Adhvaryu, S.Z. Erhan, J.M. Perez, Wear 257, 359 (2004). http://dx.doi.org/10.1016/j.wear.2004.01.005 [ Links ]

6 []. N. Martini, J.S. Schell (Editors), Plant Oils as Fuels: Present State of Science and Future Developments. (Springer Berlin Heidelberg, 2012). http://dx.doi.org/10.1007/978-3-642-72269-1 [ Links ]

7 []. A. Demirbas, Fuel 87, 1743 (2008). http://dx.doi.org/10.1016/j.fuel.2007.08.007 [ Links ]

8 []. H.J. Berchmans, S. Hirata, Bioresour. Technol. 99, 1716 (2008). http://dx.doi.org/10.1016/j.biortech.2007.03.051 [ Links ]

9 []. L. Canoira, R. Alcántara, M. Jesús García-Martínez, J. Carrasco, Biomass Bioenergy 30, 76 (2006). http://dx.doi.org/10.1016/j.biombioe.2005.07.002 [ Links ]

10 []. R.P.S. Bisht, G.A. Sivasankaran, V.K. Bhatia, Wear 161, 193 (1993). http://dx.doi.org/10.1016/0043-1648(93)90469-3 [ Links ]

11 []. F. Naughton, J. Am. Oil Chem. Soc. 51, 65 (1974). http://dx.doi.org/10.1007/bf00000015 [ Links ]

12 []. H. Mutlu, M.A.R. Meier, Eur. J. Lipid. Sci. Technol. 112, 10 (2010). http://dx.doi.org/10.1002/ejlt.200900138 [ Links ]

13 []. D.S. Ogunniyi, Bioresour. Technol. 97, 1086 (2006). http://dx.doi.org/10.1016/j.biortech.2005.03.028 [ Links ]

14 []. M.M. Conceição, R.A. Candeia, F.C. Silva, A.F. Bezerra, V.J. Fernandes Jr, A.G. Souza, Renew. Sust. Energ. Rev. 11, 964 (2007). http://dx.doi.org/10.1016/j.rser.2005.10.001 [ Links ]

15 []. S.M.P. Meneghetti, M.R. Meneghetti, C.R. Wolf, E.C. Silva, G.E.S. Lima, L. de Lira Silva, T.M. Serra, F. Cauduro, L.G. de Oliveira, Energy & Fuels 20, 2262 (2006). http://dx.doi.org/10.1021/ef060118m [ Links ]

16 []. M.M. Conceição, R.A. Candeia, H.J. Dantas, L.E.B. Soledade, V.J. Fernandes, A.G. Souza, Energy & Fuels 19, 2185 (2005). http://dx.doi.org/10.1021/ef050016g [ Links ]

17 []. E.E. Gilbert, J. Chem. Educ. 18, 338 (1941). http://dx.doi.org/10.1021/ed018p338 [ Links ]

18 []. J.A. Balderas-Lopez, Rev. Mex. Fis. 49, 353 (2003). https://rmf.smf.mx/pdf/rmf/49/4/49_4_353.pdfLinks ]

19 []. J. Caerels, C. Glorieux, J. Thoen, Rev. Sci. Instrum. 69, 2452 (1998). http://dx.doi.org/10.1063/1.1148973 [ Links ]

20 []. M. Chirtoc, G. Mihilescu, Phys. Rev. B 40, 9606 (1989). https://doi.org/10.1103/PhysRevB.40.9606 [ Links ]

21 []. J.A. Balderas-Lopez, A. Mandelis, J.A. Garcia, Rev. Sci. Instrum. 71, 2933 (2000). http://dx.doi.org/10.1063/1.1150713 [ Links ]

22 []. J. Shen, A. Mandelis, Rev. Sci. Instrum. 66, 4999 (1995). http://dx.doi.org/10.1063/1.1146123 [ Links ]

23 []. J.J.A. Flores-Cuautle, A. Cruz-Orea, E. Suaste-Gomez, Ferroelectrics. 386, 36 (2009). http://dx.doi.org/10.1080/00150190902961264 [ Links ]

24 []. K.G. Ramawat (Editor), Desert Plants: Biology and Biotechnology (Springer Berlin Heidelberg, 2009). http://dx.doi.org/10.1007/978-3-642-02550-1 [ Links ]

25 []. L.M. Cervantes-Espinosa, F.L. Castillo-Alvarado, G. Lara-Hernández, A. Cruz-Orea, C. Hernández-Aguilar, A. Domínguez-Pacheco, Int. J. Thermophys. 35, 1940 (2013). http://dx.doi.org/10.1007/s10765-012-1347-1 [ Links ]

26 []. L.M. Cervantes-Espinosa, F.L. Castillo-Alvarado, G. Lara-Hernández, A. Cruz-Orea, J.G. Mendoza-Alvarez, J.P. Valcárcel, A. García-Quiroz, Int. J. Thermophys. 33, 1916 (2012). http://dx.doi.org/10.1007/s10765-012-1317-7 [ Links ]

27 []. Y.S. Touloukian, in: Thermophysical properties of matter. (Springer, 1995). ISBN: 0306670208; https://books.google.com.mx/books?id=31sqAAAAYAAJ&hl=es&output=html_text&source=gbs_book_other_versions_r&cad=4Links ]

28 []. M. Werner, A. Baars, C. Eder, A. Delgado, J. Chem. Educ. 53, 1444 (2008). http://dx.doi.org/10.1021/je700685q [ Links ]

29 []. J.N. Coupland, D.J. McClements, J. Am. Chem. Soc. 74, 1559 (1997). http://dx.doi.org/10.1007/s11746-997-0077-1 [ Links ]

30 []. M.K. Ustra, J.R.F. Silva, M. Ansolin, M. Balen, K. Cantelli, I.P. Alkimim, M.A. Mazutti, F.A.P. Voll, V.F. Cabral, L. Cardozo-Filho, M.L. Corazza, J.V. Oliveira, J. Chem. Thermodyn. 58, 460 (2013). [ Links ]

© 2018 by the authors; licensee SMCTSM, Mexico. This article is an open access article distributed under the terms and conditions of the Creative Commons Attribution license (https://creativecommons.org/licenses/by/4.0/).

Received: November 17, 2016; Accepted: March 04, 2018

* jflores_cuautle@hotmail.com

# Sección de Estudios de Posgrado e Investigación-ESIME-IPN, México.

& Escuela de ciencias de la educación, UNAD, Colombia.

Creative Commons License This is an open-access article distributed under the terms of the Creative Commons Attribution License