


Services on Demand
Journal
Article
 English (pdf)
 Article in xml format
 Article references
 Send this article by e-mail
Indicators
-
 Cited by SciELO
 -
 Access statistics
Related links
-
 Similars in
SciELO
Similars in
SciELO
Share

 Permalink
Superficies y vacío
Print version ISSN 1665-3521
Superf. vacío vol.27 n.2 Ciudad de México Jun. 2014
Effect of sintering temperature on the structure and mean crystallite size of Zn1-xCoxO (x = 0.01 – 0.05) samples
Acosta-Humánez F.1, Almanza O.1, Vargas-Hernández C.2
1 Department of Physics. Applied Physics Group. Universidad Nacional de Colombia. Sede Bogotá. oaalmanzam@unal.edu.co
2 Optical Properties of Materials (POM). Universidad Nacional de Colombia, Sede Manizales. cvargash@unal.edu.co
Recibido: 1 de octubre de 2013
Aceptado: 28 de marzo de 2014
Abstract
In this work, powders were prepared Zn1-xCoxO (0.00 ≤ x ≤ 0.05) at temperatures of calcination of 773, 823, and 873 K by sol gel methods (citrate route). In the XRD patterns, all the observed diffraction peaks could be indexed to ZnO wurtzite structure, and no other impurity phase was found, leading to the conclusion that the Co ions in fact entered into ZnO crystal. Rietveld analysis shows that all samples have a hexagonal wurtzite structure with mean lattice constants a = 3.2507 A˚ and c = 5.2073 A˚, and that no important changes of the lattice parameters were observed as a consequence of Co doping or temperature of calcination. The average crystallite size was measured using Scherrer's method, and the results show that when Co concentration increased from 0 to 5%, crystallite size varied depending on the sample calcination temperature (Tc). In general, the lower the Tc, the higher the crystallite size, and at a particular Tc, the higher the Co concentration, the higher the crystallite size. The last one suggests the promotion of crystal growth as a result of Co doping in ZnO at least for the synthesis method used here. Raman spectroscopy results showed an increase of the defect concentration as a consequence of an increase in Co contents.
Keywords: ZnO; Sol-gel method; X ray diffraction; Raman spectroscopy.
1. Introduction
Diluted Magnetic Semiconductors (DMS) have received considerable attention due to their potential applications, including their use as information storage materials, fluorescent lamps, control panel displays, plasma display panels, field effect transistors, antireflection coatings, transparent electrodes in solar cells, ultraviolet (UV) light emitters, diode lasers, varistors, piezoelectric devices, surface acoustic wave propagators [1,2], antibacterial agents [3], photonic materials [4], detection of DNA [5] and for gas sensing [6].
DMS have been prepared by various techniques, chemical and physical, among them the solid state method [3], sintering by sputtering [1], Pulsed Laser Deposition [2], sol–gel method (citrate route) [7], solution combustion synthesis [8,9], spray pyrolysis, precipitation, and others [8, 10]. The sol-gel method allows the mixing of the chemicals at an atomic level, thus reducing the possibility of undetectable impurity. Additional advantages are the good reproducibility, and the simple experimental procedure [11]. Although it is thought that defect concentration created by the different production methods of ZnO, are responsible for the differences found in its magnetic and electrical properties [1-4], e.g. while many groups report room temperature ferromagnetism for Co-doped ZnO [12,13] there are many other groups reporting the absence of ferromagnetism [3,14], and yet other groups have reported the existence of antiferromagnetism [15] for ZnO growing with different methods, we must not forget that some of these properties are crystallite size – dependent, as the surface/volume ratio increases as the material dimension decreases to nano-order.
Zinc oxide (ZnO) is a direct wide-band gap (3.37eV) II–VI semiconductor, and has stable wurtzite structure with lattice spacing a = 0.325 nm, and c = 0.521 nm [8]. The three strongest XRD peaks for ZnO have been detected with Miller indices (1 0 0), (0 0 2), and (1 0 1), corresponding to Bragg angles 31.8, 34.5, and 36.4° respectively [9]. The two main properties extracted from DRX peak width analysis, are the crystallite size and lattice strain. Crystallite size is a measure of the size of coherently diffracting domain. The crystallite size of the particles is not generally the same as the particle size, due to the presence of polycrystalline aggregates [16].
Jagannatha Reddy et al. [9] reported an increase in the crystallinity, crystallite size, and number of unit cells present in Spherical shaped ZnO nanopowders, as a consequence of an increase in heat treatment. Those particles were synthesized by a low temperature solution combustion method. Mohd Arshad et al. [17] observed a disminishment in crystallite size, with the increase in Co concentration from 0 to 5%, for Zn1-xCoxO powder nanoparticles synthesized by sol–gel method and calcinated at the single temperature of 400 °C. It suggests the prevention of crystal growth as a result of Co doping in ZnO. A decrease in the average crystallite size with an increase in the cobalt content has also been reported by other authors, [18, 19] even though the sample has been obtained by different methods. Other investigators have reported an increase in the crystallite size for Cobalt doping in ZnO, when they are compared with pure ZnO [20-22].
Zinc oxide semiconductor has a hexagonal wurtzite structure with four atoms per unit cell. The wurtzite crystal structure belongs to  space group, and by group theory has been obtained one A1, one E1, two E2, and two B1 optical phonon modes (A1+2B1+E1+2E2) [23]. The selection rules indicate that modes: A1+E1+2E2 are Raman active, A1+E1 are infrared active, and B1 mode is silent (forbidden for both Raman and IR excitations). The ionic character of the Zn–O bonds is responsible for the large splitting of the polar modes (A1 and E1) into longitudinal optical (LO) and transverse optical (TO), this is due to the macroscopic electric field that is associated with such transverse vibration modes. The band associated with E1(LO) mode is due to the occurrence of defects such as oxygen vacancies and Zinc interstitials .
The present investigation deals with Zn1-xCoxO (0.00 ≤ x ≤ 0.05) samples calcinated at different temperatures (773, 823, and 873 K) in order to study the effect of Co on the crystalline structure, and the crystallite size of these materials. Furthermore, we have studied by Raman the consequence of Co on the defect concentration.
2. Material and methods
Powders of Co2+ -doped ZnO, with 0.0 ≤ x ≤ 0.05 were prepared through the sol–gel method, citrate route, using zinc nitrate hexahydrate Zn(NO3)2∙6H2O, cobalt nitrate hexahydrate Co(NO3)2∙6H2O, and citric acid monohydrate C6H8O7∙H2O, as starting materials in stoichiometric amounts.The first two materials were dissolved in deionized water at 343 K, and stirred until a homogeneous solution was obtained, before mixing it slowly in citric acid monohydrate, dissolved in deionized water. The mixture was stirred until a gel was obtained. The ratio of citrate/nitrate used was 1. This gel was dried at 403 K for 12 h, and ground using an agate mortar. The materials so far obtained were named starting or precursor materials, and were labeled as CitZCoX403, where x represents the Co concentration in the material, and 403 the drying temperature. Then, each starting powder was separated into three portions, and calcinated at temperatures of 773, 823, and 873 K for 12 h each. All samples are named ZCOxTc, where Tc is the temperature of calcination. In order to identify and measure the crystal size in the samples studied, X-ray diffraction pattern was measured. The pattern was obtained by using a Panalytical X'Pert PRO diffractometer with Kα Cu radiation (λ = 1.540598 Å), and Bragg–Brentano geometry. It was operated in a continuous mode between 2θ=10º and 2θ=90º, and angle variation of 0.02º with detector data acquisition total time of 9.46 min The Raman spectra were acquired using a high-resolution confocal microscope (LabRAM HR Raman microscope, Horiba Jobin Yvon) with a monochromatic radiation source of 473 nm and a 22 mW Laser power. The microscope operating characteristics were as follows: D06 filter, holder 300, slit 200, objective X10, in the range 200-1200 cm-1 at room temperature, using silicon as (520 cm-1) calibration standard.
3. Results and Discussion
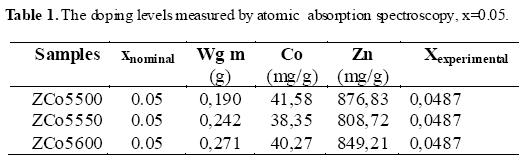
The real doping levels were measured by atomic absorption spectroscopy. The experimental values had a good linear correlation with the nominal values (theoretical values, see Table 1). Hereafter, we use nominal dopant levels to identify the sample in the text.
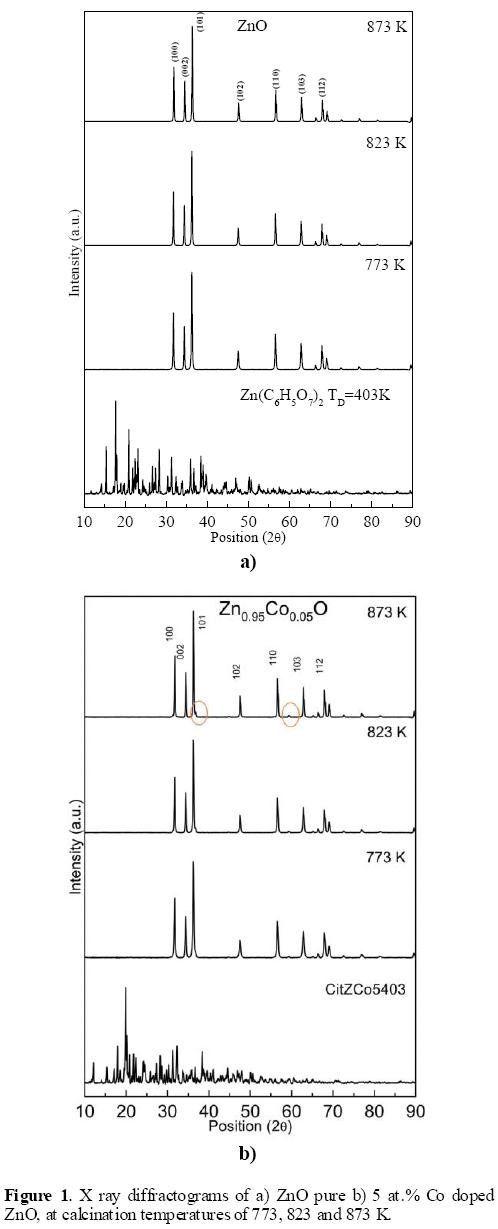
Figures 1a and 1b show the X - ray diffraction patterns (XRD) obtained in pure ZnO, and 5 at.% Co doped ZnO, calcinated at 773 K, 823 K, and 873 K, respectively. For the other Zn1-xCoxO (0.01 ≤ x ≤ 0.04) samples, the XRD exhibited exactly the same peaks, though the intensities were different when compared to each other at the same temperature of calcination. All nanoparticles showed several diffraction peaks, which can be indexed as hexagonal wurtzite ZnO, when they are contrasted with the card JCPDS 36-1451. Also shown is the XRD pattern of the precursor material from which the materials were obtained. The characteristic peaks (Miller indices) (1 0 0), (0 0 2), and (1 0 1)) are higher in intensity, for all temperatures of calcination, which indicates that the products are of good crystalline nature. For samples annealed, no peaks corresponding to impurities were detected, showing that the final product is merely ZnO, which also indicates that the Co ions effectively penetrated into ZnO crystal, and occupied the regular lattice site of Zn2+ or interstitial sites. It is also because the doped Co concentration is far below the solubility limit of Co in ZnO matrix, which can effectively diminish the possibility of secondary impurity phases, as has been said by other authors [24, 25]. It is observed that intensity of the peaks increases with thermal treatment, which means that the crystallinity has been improved. Temperature of calcination eliminates all possible peaks corresponding to Zn, Zn(OH)2 or other Zn phases coming from the starting material, such as is observed in the XRD pattern of it (Figures 1a and 1b). In Figure 1b, the peaks enclosed in circle, and which are of low intensity are not derived of the zinc oxide phases. These peaks are assigned to related compounds cobalt, probably Co3O4, and that can be associated to the high loading of cobalt, which has been introduced. The peak intensities are weak causing difficulty in proper identification of these.
The nano crystalline mean size (DS) was evaluated from the Scherrer equation [26]:
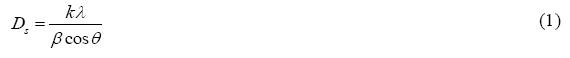
Where β is the integral breadth of intrinsic profile, λ is the wavelength of X_rays, k is the Scherrer constant, whose value is 0.94 and θ is the Bragg angle of each diffraction peak. β can be written as

In these equations βinstr and βm are the contributions to β due to the instrument and samples, respectively [27, 28]. A mean value for DS was obtained from 1/β Vs cosθ line slope. Table 2 registers the results for DS. At Tc = 873 K it is observed that DS increases slightly when the Co concentration increases. The same does not occur for the other two temperatures. So, for Tc = 773 K DS decreases when X changes from 0 up to 4%, and only increases at 5 at.% Co doped ZnO . At temperature of calcination of 823 K, DS increases when x passes from 0 to 1%, but then remains almost contant when Co outdoes this value. It can be seen that the mean crystallite size is higher at a lower temperature of calcination. It suggests the prevention of crystal growth as a result of an increase of the temperature of calcination. So, the higher temperature of calcination in a particular Zn1-xCoxO, not only lowers the particle size, but also improves the crystallanity of the nanoparticles.
Rietveld [29] analysis allowed us to obtain lattice parameters for all samples studied. a and c parameters corresponding to a hexagonal wurtzite ZnO are recorded in Table 2. A regular relationship between doping concentration and these parameters is not observed. So, it is clear that Co doping has only a small effect on the lattice parameters of ZnO, and this result can be attributed to the small difference in radius between Zn2+ (0.60 Å) and Co2+ (0,58 Å) [30]. The fit between observed and calculated profiles was very good for all the compositions. A great fit between both profiles by considering Co occupying Zn site, confirms that Co is in fact substituting Zn in the formation of Zn1-xCoxO solid solution.
Raman scattering has often been employed to confirm the structures of materials, since it is very sensitive to the microstructure of nanocrystalline materials [31, 32].
Figures 2a-c (b) show the room-temperature Raman spectra of all Co - doped samples and pure ZnO powders, ranging from 200 to 1200 cm-1, calcinated at 873, 823, and 773 K respectively. The Raman spectra of Zn1-xCoxO samples show all the expected ZnO phonon modes for x = 0, and they are clearly identified in the Raman scattering spectra of ZnO [31, 32]. When Co concentration increases, the main peak E2(High) (437 cm-1) disappears, indicating that the incorporation of Co causes some structural disarray in the crystalline ZnO lattice, such as oxygen vacancies and Zn interstitials, but crystal structure is not destroyed, in view of the fact that we have X- ray pattern with high intensity. A visible Raman vibration mode at around 538 cm-1 is noted as well. It is an indicator for the inclusion of Co2+ ions into the ZnO. It also has been observed by other authors [31-32]. All the aforementioned is valid independent of the temperature of calcination. The difference is the quality of the samples, which is better at higher Tc.
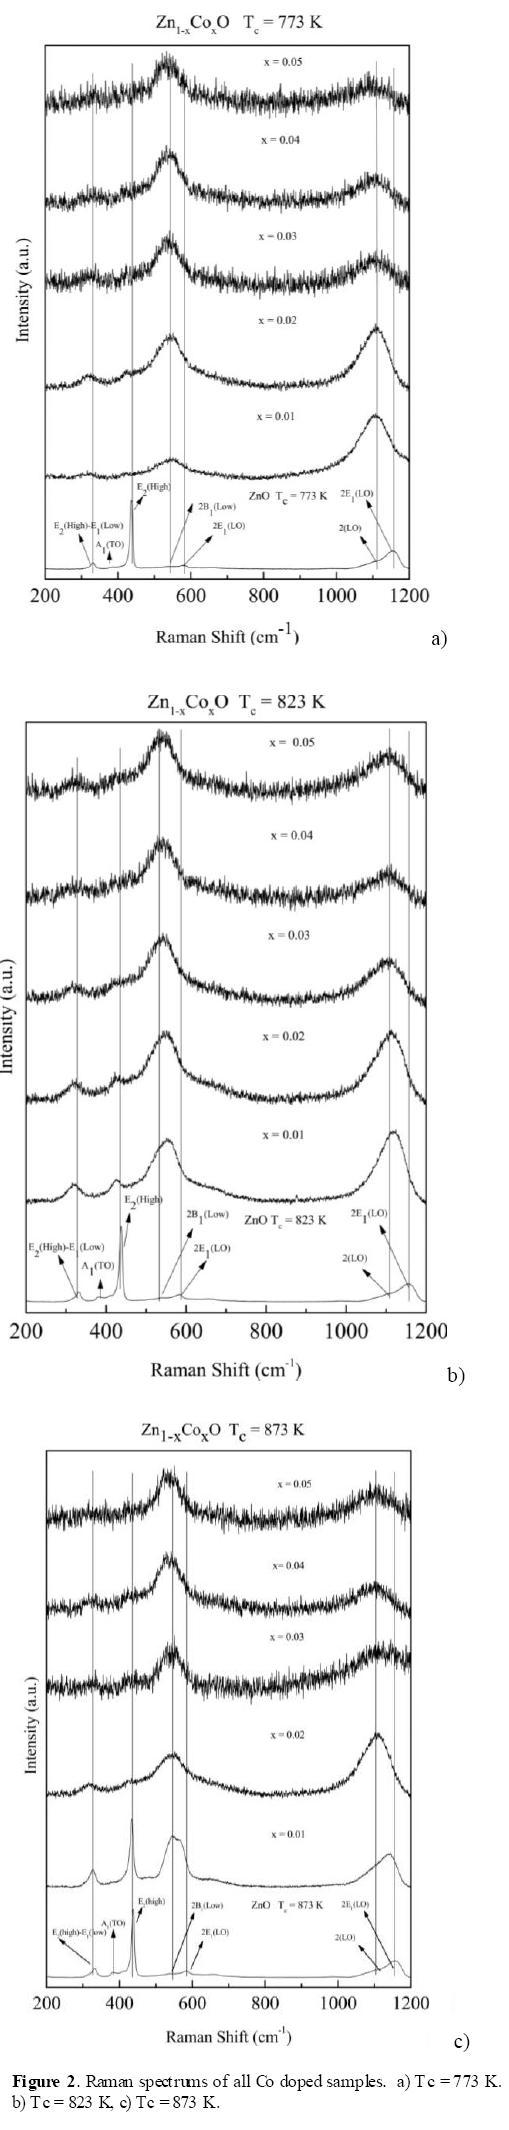
From figures 2a-c (b), when signals with the same temperature of calcination and Co concentration are compared, it is also possible to highlight that at a temperature of approximately 873 K and 1 at.% Co doped ZnO, Co ions were substituted in the structure with the lowest structural disorder, since the figures are better defined, with the best signal to noise ratio.
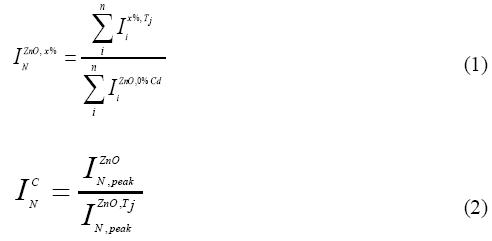
The relative Raman peak intensity ( ), is defined as a figure of merit, when C and N are the concentration and normalized intensities.
 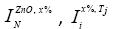 and
and  are the Raman peaks intesities of: normalized peak for concetration x%, Tj synthesis temperature and normalizaed with respect 0% concentration Co, respectively. The significative peaks are around 437, 578, and 1156 cm-1. Results are obtenained by equations:
The Raman bands from 300 to 500 cm-1 disappear due to the disorder induced by the Co Doping. These changes may be related to the different size of Co+2 and Zn+2. When Co+2 ions substituted Zn+2 ions, new defects are created in intrinsic host lattice of ZnO structure.
Other authors have reported that by Raman technique could be obtained the low concentration of the secondary phase due to the substituted ions that produce additional vibrational modes, although these secondary phases were not detected by XRD due to the detection limit measurement [33, 34]. In the Figures 2a-c (b), there are no any additional mode attributed to secondary phase, which indicates that the substitution of Co introduced structural disorder and strain, when they have been placed in the center tetrehedron which is formed by the oxygen ions ZnO in the structure. In another word, the Raman results indicate that the ZnO structure has been doped with Co into the lattice position of Zn ions.
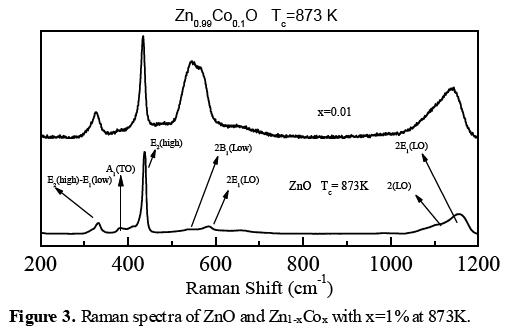
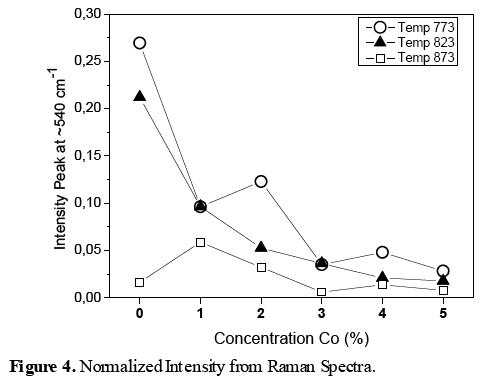
Figure 3 shows the Raman spectra of ZnO and Zn1-xCoxO, these results indicate that at the temperature of approximately 873K and x=1% concentration, Co ions were substituted in the structure with the lowest structural disorder. Figure 4 shows the normalized intensity obtained from the Raman spectra, in these graphs have been used the equations (1-2). These results indicate that the temperature around 873 K, the structural disorder has been generated by the substitution of Co in tetrahedral sites and most of these sites are occupied, whereas at temperatures below 873 K the structural disorder is increased, possibly due to the octahedral sites and some interstitial sites have been occupied by Co ions, and the crystalline quality of ZnO is poorer. For x = 0.01 and Tc = 873 K, the structural disorder is the smallest because it has the approximate solubility limit.
4. Conclusion
The study from XRD for zinc oxide samples doped with cobalt (Zn1-xCoxO; 0.01 ≤ x ≤ 0.05), established that the substitution of Co2+ for Zn2+ ions leads to a decrease in the crystal quality, but it does not change the wurtzite ZnO structure. The higher temperature of calcination in a particular Zn1-xCoxO, not only lowers the particle size, but also improves the crystallinity of the nanoparticles. Raman spectroscopy established that when Co increases, the defect concentration increase too.
Acknowledgment
We thank to the DIB of the National University of Colombia for the financial support through the project with code 15848. Additionally we thank to the professor Mario Barrera for facilitating the equipment and laboratories used in the materials synthesis. C.V-H. acknowledges financial support provided by DIMA, Dirección de Investigación Sede Manizales, Universidad Nacional de Colombia.
References
[1] Y. P. Zhang, S.-S. Yan, Y. Liu, M.-J. Ren, Y. Fang, Y. X. Chen, G. L. Liu, L. M. Mei, J. P. Liu, J. H. Qiu, S. Y. Wang, L. Y. Chen, Appl. Phys. Lett. 89, 045101 (2006). [ Links ]
[2] Y. Z. Liu, Q. Y. Xu, H. Schmidt, L. Hartmann, H. Hochmuth, M. Lorenz, M. Grundmann, X. D. Han, and Z. Zhang, Appl. Phys. Lett. 90, 154101 (2007). [ Links ]
[3] G. Lawes, A. S. Risbud, A. P. Ramirez, R. Seshadri, Phys. Rev. B71, 045201 (2005). [ Links ]
[4] J. M. D. Coey, M. Venkatesan, C. B. Fitzgerald, Donor impurity band exchange in dilute ferromagnetic oxides, Nature Mater. 4, 173 (2005). [ Links ]
[5] D. A. Guzmán-Embús, M. Orrego Cardozo, and C. Vargas-Hernández, Journal of Applied Physics 114, 194704 (2013). [ Links ]
[6] S. Maensiri, J. Sreesongmuang, C. Thomas, J. Klinkaewnarong, Journal of Magnetism and Magnetic Materials 301, 422 (2006). [ Links ]
[7] F. Acosta-Humánez, R. Cogollo Pitalúa, O. Almanza, Journal of Magnetism and Magnetic Materials 329, 39 (2013). [ Links ]
[8] A. J. Reddy, M. K. Kokila, H. Nagabhushana, R.P.S. Chakradhar, C. Shivakumara, J. L. Rao, B. M. Nagabhushana, Journal of Alloys and Compounds 509, 5349 (2011). [ Links ]
[9] A. J. Reddy, M.K. Kokila, H. Nagabhushana, J.L. Rao, C. Shivakumara, B.M. Nagabhushana, R.P.S. Chakradhar Spectrochimica Acta Part A 81, 53 (2011). [ Links ]
[10] M. F. Melendrez, C. Vargas-Hernández, Superficies y Vacío 26, 100 (2013). [ Links ]
[11] J.H. Yang, L.Y. Zhao, X. Ding, L.L. Yang, Y.J. Zhang, Y.X. Wang, H.L. Liu, Materials Science and Engineering B 162, 143 (2009). [ Links ]
[12] C. Song, K.W. Geng, F. Zeng, X.B. Wang, Y.X. Shen, F. Pan, Y.N. Xie, T. Liu, H.T. Zhou, Z. Fan, Phys. Rev. B 73, 024405 (2006). [ Links ]
[13] P. Sati, R. Hayn, R. Kuzian, S. Régnier, S. Schäfer, A. Stepanov, C. Morhain, C. Deparis, M. Läugt, M. Goiran, Z. Golacki, Physical Review Letters 96, 017203 (2006). [ Links ]
[14] M. Bouloudenine, N. Viart, S. Colis, J. Kortus, A. Dinia, Applied Physics Letters 87, 052501 (2005). [ Links ]
[15] M. M. Can, T. Firat, Şadan Özcan, J Mater Sci 46, 1830 (2011). [ Links ]
[16] K. Ramakanth, Basics of X-ray Diffraction and its Application, I.K. International Publishing House Pvt. Ltd., (New Delhi, 2007). [ Links ]
[17] M. Arshad, A. Azam, A. S. Ahmed, S. Mollah, A. H. Naqvi, Journal of alloys and Compounds 509, 8378 (2011). [ Links ]
18] Y. Zou, Z. Huang, Y. Wang, X. Liao, G. Yin, J. Gu, Colloids and Surfaces B 102, 29 (2013). [ Links ]
[19] Y. Caglar, Journal of alloys and Compounds 560, 181 (2013). [ Links ]
[20] M. G. Nair, M. Nirmala, K. Rekha, A. Anukaliani, Materials Letters 65, 1797 (2011). [ Links ]
[21] M. Nirmala, A. Anukaliani, Physica B 406, 911 (2011). [ Links ]
[22] Y. Huaming, N. Sha, Preparation and characterization of Co-doped ZnO nanomaterials, Mater. Chem. Phys. 114, 279 (2009). [ Links ]
[23] T.C. Damen, S.P.S. Porto, B. Tell, Raman Effect in Zinc Oxide, Phys. Rev. 142, 570 (1966). [ Links ]
[24] A. S. Risbud, N. A. Spaldin, Z. Q. Chen, S. Stemme, R. Seshadri, Phys. Rev. 68, 205202 (2003). [ Links ]
[25] L. B. Duan, G. H. Rao, J. Yu, Y. C. Wang, Solid State Commun. 145, 525 (2008). [ Links ]
[26] Z. Zhang, F. Zhou, E.J. Lavernia, Metallurgical and Materials Transactions A 34A, 1349 (2003). [ Links ]
[27] R. Yogamalar, R. Srinivasan, A. Vinu, K. Ariga, Solid State Communications 149, 1919 (2009). [ Links ]
[28] A. K. Zak, R. Yousefi, W. H. Abd Majid, M. R. Muhamad, Ceramics International 38, 2059 (2012). [ Links ]
[29] J. Rodríguez-Carvajal, Fullprof Suite software: Crystallographic tools for Rietveld, profile matching and integrated intensity refinements for X-ray and/or neutron data. 2012. [ Links ]
[30] A. J. Reddy, M.K. Kokila, H. Nagabhushana, J.L. Rao, C. Shivakumara, B.M. Nagabhushana, R.P.S. Chakradhar, Spectrochimica Acta Part A 81, 53 (2011). [ Links ]
[31] X. Xu, C. Cao, Journal of Magnetism and Magnetic Materials 321, 2216 (2009). [ Links ]
[32] Y.Q. Chang, P.W. Wang, S.L. Ni, Y. Long, X.D. Li, J. Mater. Sci. Technol., 28, 313 (2012). [ Links ]
[33] K. Samanta, P. Bhattacharya, R. S. Katiyar, W. Iwamoto, P. G. Pagliuso, C. Rettori. Phys. Rev. B 73, 245213 (2006). [ Links ]
[34] C. Sudakar, P. Kharel, G. Lawes, R. Suryanarayanan, R. Naik, V. M. Naik, Condens. Matter 19, 026212 (2007). [ Links ]

