


Services on Demand
Journal
Article
 English (pdf)
 Article in xml format
 Article references
 Send this article by e-mail
Indicators
-
 Cited by SciELO
 -
 Access statistics
Related links
-
 Similars in
SciELO
Similars in
SciELO
Share

 Permalink
Superficies y vacío
Print version ISSN 1665-3521
Superf. vacío vol.26 n.2 Ciudad de México Jun. 2013
Characterization of the roundness degree of graphite nodules in ductile iron: A new discrete measure independent to resolution
Herrera Navarro A.M.1*, Jiménez Hernández H.2, Peregrina-Barreto H.3, Manríquez-Guerrero F.4, Terol Villalobos I.R.4
1 Facultad de Ingeniería, Universidad Autónoma de Querétaro Av. de las Ciencias S/N, Juriquilla, 76230, Querétaro, México. * anaherreranavarro@gmail.com
2 Centro de Ingeniería y Desarrollo Industrial Av. Playa Pie de la Cuesta No. 702, Desarrollo San Pablo, 76000, Querétaro, México.
3 Laboratorio de Investigación en control Reconfigurable Av. Hércules Oriente No. 4, 76209, Querétaro, México.
4 Centro de Investigación y Desarrollo Tecnológico en Electroquímica Parque Tecnológico Querétaro S/N, SanFandila-Pedro Escobedo, 76703, Querétaro, México.
Recibido: 17 de noviembre de 2012
Aceptado: 13 de mayo de 2013
Abstract
The morphology of graphite nodules in ductile iron, currently controlled by means of chemical inoculants and solidification process, is strongly related to mechanical properties of this material. In fact, the quality of the ductile iron is better when the shape of the graphite particles is rounded. In this article, a new discrete method to measure and to characterize the roundness degree of graphite particles is proposed. This measure takes into consideration the dominant geometry of the nodules and avoids the use of parameters such as area, perimeter and Ferret's diameter which differs among the systems. In order to show the performance of this measure, it is compared with three measures: Roundness factor, the mean roundness and radius ratio. After comparing with these measures, it was observed that the proposed measure is not affected by the abrupt changes in the contours nor by the shape resolution.
Keywords: Nodules; Roundness; Shape; Probability density function; Mode.
1. Introduction
Due to the low manufacturing cost, mechanical properties and easy fabrication cast irons have been widely used in industry. The microstructure of ductile cast iron is characterized by the presence of spherical graphite particles or nodules throughout the material that grow during the solidification [1]. Most of published articles deal with ductile cast iron and were devoted to studying the microstructure, principally graphite nodules. There are different measures to characterize the graphite microstructure such as, the graphite nodule count, nodularity, volume fraction and mean nodule size. Among these measures, nodularity plays an important role in the characterization of the microstructure of ductile cast iron. For instance, Iacoviello and Di Cocco [2] studied the graphite particles as crack arresteis. In the same manner, Xin et al. [3] have shown the effects of nodules shape relating with the crack initiation and crack propagation rate. In [4], the authors have investigated how to get a 100% nodular and the relationship between hardness and tensile strength. Finally, in [5] the authors have demonstrated that the main factors affecting the mechanical properties of cast iron are related primarily with the microstructure of the matrix and the morphology or shape and size of the nodules. On the other hand, because of the importance of improving mechanical properties in cast iron, by controlling the morphology of nodules, it is possible to obtain a good quality of ductile cast irons to satisfy industrial requirements, and therefore, it is of vital importance to define robust measures. Currently, the nodules evaluation process is performed using a subjective comparison between the chart and graphite particles. This chart pattern is defined by international standards [6]. The results of these comparisons only give descriptive information on the type and size of graphite nodules. According to standard ISO 9451 the graphite particles are classified into six types depending on their irregularities. This standard establishes the type 6 as the ideal graphite nodule. Similarly, the standard ASTM A 247 characterizes the graphite particles into categories (I-VII). Nevertheless, even though the chart patterns are useful to classify the morphology of nodules, this process can cause inaccuracies due to its dependence on a visual assessment by the operator. In this sense several procedures based on image analysis have been proposed to quantitatively determine the morphology of graphite nodules. For instance, Li et al. [7] used the fractal geometry foundations to describe the irregularity of graphite nodules in different dimensional spaces. At the same time, Pudale et al. [8] used a finite element model to represent the effect of roundness of nodules under different ratios. Next, Ohser et al. [9] introduced a method to classify different flake graphite configurations based on morphological transformations. Afterwards, Imasogie and Wendt [10] established a set of numerical indices to evaluate the degree of spheroidization in compacted graphite iron (CGI) using an area-area shape factor. More recently, De Santis et al. [11] proposed a quantitative analysis to compute the nodularity by estimating parameters such as area, centroid, diameter and eccentricity. Recently Morales-Hernández et al. [12] have introduced the notion of conditional bisector to determine the skeleton in order to represent the shape of nodules.
The current paper aims is to introduce a new discrete measure to estimate the roundness degree of the nodules. This measure is a generalized measure. Thus, it is robust e.g., with respect to noise, resolution, shape variations, as well as it can easily be compared to human observations. Consequently, the measure that is being introduced can be adopted to successfully estimate nodules shape.
This paper is organized as follows: In Section 2, a brief description of three measures: Radius Ratio (RR), Mean Roundness (MR) and Roundness Factor (RF) is presented including their performance and limitations. In Section 3, a new discrete measure based on the distribution of the radius is proposed. Some illustrative examples demonstrating that the distribution of the distances from the border points to the center of nodules can be modeled as a multimodal probabilistic distribution function (pdf) are also featured in this section. In Section 4, an experimental study is made to compare the proposed measure with the methods that were commented on above and described in Section 2. Comments and conclusions can be found in the last section.
2. Review of roundness measures
One measure recommended by the ASTM committee E04 to compute the degree of nodularity is ASTM nodularity [13]. Since this measure has been applied using different names, in this work it will be called Roundness Factor (RF). This measure is based on the area of a circumscribed circle with the same maximum diameter of an object and it is defined as:
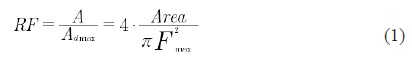
Where Fmax is the maximum Ferret's diameter (the longest distance between two points along the boundary of an object). The main disadvantage in using this measure is the fact that small variations in the shape, sometimes seen as a fine peak, strongly affect the results of roundness, even when the object being evaluated has a well-defined circular shape. In such cases, the maximum Ferret's diameter is larger than the diameter of the inscribed circle. In [13] demonstrated that parameters such as Ferret's diameter differ up to 30 percent within image analysis tests of different image processing systems.
On the other hand, Ritter and Cooper [14] reviewed and compared several measures of circularity in terms of resolution, order of complexity, ease of calculation, and how well they match human observations. In their work the authors show that the most of circularity measures are derivations of the Form Factor. The main problem associated with this measure is its dependence on the resolution and the perimeter inaccuracy. As well, it requires the identification of both the border and the interior points to the object. To overcome this problem, the authors proposed two measures of roundness: the mean roundness (MR) and radius ratio (RR), which are described in the following paragraphs.
Radius Ratio measure is based on the definition of a circle. It computes the proportion of the minimum and the maximum radii of the object, which is defined as follows:
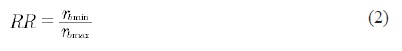
where rbmin is the minimum radius from a border point to the center of the border, and rbmax is the maximum radius. The main disadvantage of this measure is that the proportions of the shortest and longest radius do not provide sufficient information to measure the roundness and it could be affected by pixel aberrations.
Mean Roundness measure is based on the theory of mean deviation (MD). It calculates the sum of the absolute differences between the radius of each border pixel and the average radius. This measure is defined as:
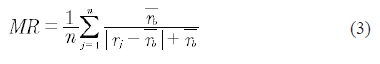
Where  is the average radius from the border points to the center of the object, and r_j is the radius of border point j to the center of the border. The center of the border b is expressed as
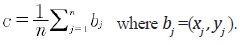 where b =(xj,yj). This expression is valid only if the expected value is equal to the mean. Therefore, the average is highly correlated for close to round objects. Consequently, this measure is not reliable to measure the roundness of irregular and partial shapes, for instance: an arc.
3. A New Roundness Measure
In this section, a roundness measure is defined. Throughout this work it will be assumed that the distribution of the distances from the border points to the center of nodules can be modeled as a probabilistic distribution function (pdf).
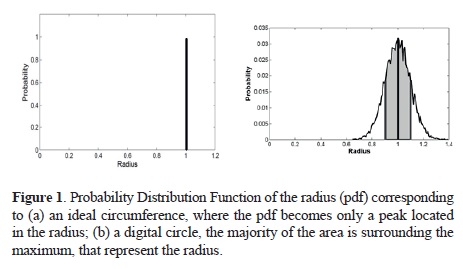
3.1 Probability distribution function
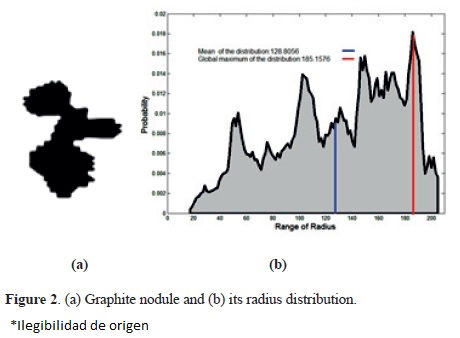
For practice purposes the pdf can be interpreted as the probability of occurrence of the length of radii. If an ideal circle is considered, where the magnitude of all the radii is the same, then the pdf of the radius is composed of a single line (see Fig. 1(a)). In contrast, when the circle is affected by noise (which may include the discretization process), and small shape variations, the majority of the area of the distribution of the radi tends to cluster around a single value. This can be observed in Fig. 1(b) where the neighborhood around the peaks becomes sparse. In this case, it was taken into consideration that the radius can be modeled as a Gaussian distribution around the radius r with a σ dispersion; i.e. r ≈ G(r,σ). However in general, when the shape is affected by strong shape variations, the pdf becomes more complex than for a single Gaussian. To illustrate this, Fig. 2 shows the pdf of the radius of a irregular graphite nodule, where it is evident that the pdf of the radius is composed of distinct peaks or modes; therefore, the radii distribution can be modeled as mixed distributions. This model could become complicated because there is insufficient data to estimate the set of parameters for each density function. Nevertheless, a good criterion to estimate the most significant distribution consists of locating the most significant mode contained in the mixture. Then, the objective of this article consists of determining a better radius estimator than the single average to calculate the roundness of graphite nodules that have a multi-modal probability density function (mpdf).
3.2 A new roundness measure based on the probability density function
Based on the assumption than the pdf, of the radius of nodules, does not necessary follow a Gaussian distribution (see Fig.2 (b)) a new measure is proposed, which is based on the most probable value for the radius. Consider that the borders of the particles have been determined, and then the center c = (x,y) of the particles is calculated from the border information by means of:
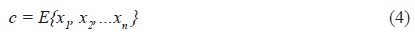
where {x1, x2,...xn} represents the set of pixels in the border and E corresponds to the expected value. Subsequently, the distances of each element of the border and the estimated center are computed as follows:
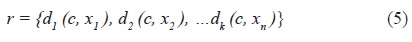
where r is the set of distances between each one element of the border di and the estimated center c. After determining the set of distances, its pdf expressed as f(r) is computed.
Then the expected value E[f(r)] for f(r) corresponds to the most probable value for the radius. In general, it represents the global maximum of f(r), whereas the area surrounding it corresponds to the majority of the area of the distribution. Summarizing, this is expressed as:
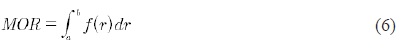
The a and b values are defined as E[f(r)] - g1(r) and E[f(r)] + g2(r) respectively, such that functions g1 and g2 denote the maximum sparse criterion.
4. Discussion and Results
4.1 Image acquisition and segmentation
Microstructural images were captured with a Nikon epiphot 200 optical metallographic microscope, which includes an integrated video system. The dimensions of the images are 656x494 pixels. Quantitative metallographic measurements were carried out using a magnification of 200x, (pixel dimension of 1.095 μm). In order to get a reasonable resolution of the shape of the graphite nodules, particles having a diameter of less than 5 μm were neglected [15].
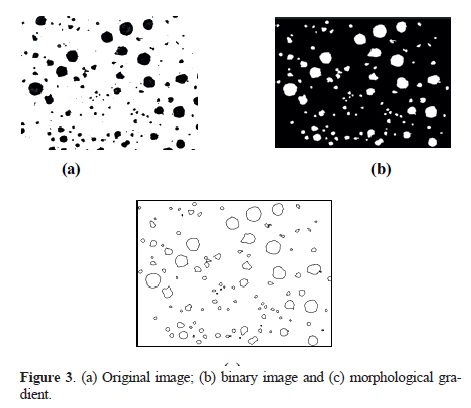
The first step to characterize the roundness of graphite nodules consists of an efficient separation of the graphite particles from the background. Since, the images to be used are well contrasted, a simple threshold between 0 and 180 gray-levels enable us to segment them (Fig. 3(b)). However, to carry out this task for more complex images, a segmentation process as proposed in [12] can be made. Afterwards, the borders of the nodules were extracted using a derivate operator particularly, a morphological gradient (Fig 3(c).
4.2 Quantitative analysis of different graphite nodules shapes
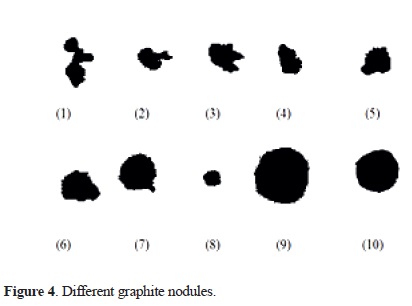
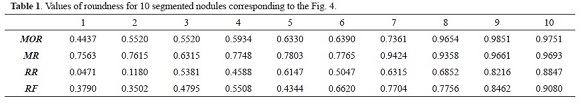
In the first experiment, the order of each measure described in the Section 2 and the proposed one was defined and analyzed utilizing 10 distinctive typical shapes of the graphite specimen. The image in Fig. 4 shows the graphite nodules. Table 1 displays the results for each measure. Note that all measures have a distinguishable difference; especially when the shape of the nodules is irregular. To illustrate this, observe the first element of the table, where the minimum value of the roundness measure MOR is 0.4437, whereas those computed by RF, MR and RR are 0.75632, 0.3790 and 0.0471, respectively. On the other hand, when nodules shape tends to be circular MOR and MR have similar values; this can be seen in the 9th and 10th samples of Table 1. Analyzing these results with MR the interval between the least roundness and the most roundness is small, approximately 0.2130; consequently it cannot distinguish the effects of roundness. Contrarily, with the proposed measure (MOR) and RF the interval is about 0.5314 and 0.5290, respectively which means it is possible to discriminate between the least circular nodule and the most circular one. By visually comparing it is evident that not all the selected graphite particles are close to a circle, that is, some nodules could not be considered as circular nodules. Consequently, the MR measure is less accurate to characterize the nodularity of a graphite sample, especially when the shape the nodule is very irregular. The only measures that maintain a relative order of the shapes are the proposed measure MOR and RF.
4.3 Analysis of the irregularity of boundaries of grapite nodules
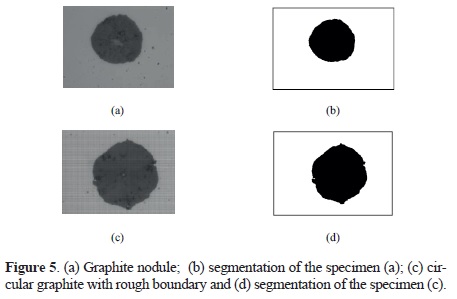
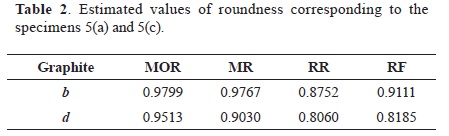
In the next experiment we show how the measures are affected by the irregularities in the contours. To illustrate this, consider the nodules in Figs. 5(a) and 5(c) which are typical samples in a routine analysis in ductile cast iron production. Notice that both specimens are close to circular in shape. However, the nodules in Figs. 5(b) and 5(d) have small ragged contours. Note in Table 2 that MR, RR and RF showed considerable variations in results; this means that these are more sensitive to irregularities in the boundaries. Therefore, the study of the dominant geometry of the nodules, as it is the case of the MOR measure, will provide a more accurate parameter to study the graphite shape. This makes it possible to efficiently measure the roundness of the nodules even when the borders have small distortions.
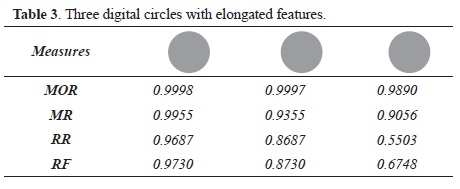
To demonstrate how the presence of elongated features affects in the resulting measurements, a perfect circle was drawn digitally (see Table 3). This comparison demonstrates that the Roundness Factor (RF) is strongly affected by the presence of thin and elongated features such as lines. Then the maximum Ferret's diameter is much larger than the diameter of the inscribed circle, consequently when a graphite particle has a shape close to a circle, the presence of small and elongated features could render false results. To illustrate this, notice the first and the last element of the Table 3, where the inaccuracy of RF dropped from 97% to 67 %. In the same manner as with RR this dropped from 96 % to 0.55%. Notice that, contrary to the values obtained by the RR and RF, those computed by MR and MOR remain approximately the same; therefore, they are not affected by the accuracy of the border.
4.4 Analysis of the nodularity of ductile cast iron
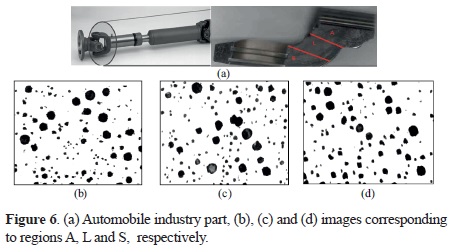
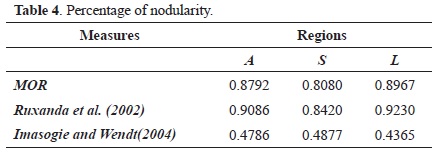
To show the reliability of the proposal we analyzed the microstructure of a ductile cast iron. To carry out this task, a set of images of three regions of the mechanical part (20 samples were analyzed by each region) shown in Fig. 6, were analyzed. The study is focused on the computation of nodularity which is based on how approximated the nodules shape to a circle are. For instance, a sample of graphite is less nodular when the shape of the graphite nodules does not tend to be a circle. The percentage of the nodularity is computed by %Nodularity =  where CountN is the number of nodular graphite particles and CountT is the total number of graphite particles. The proposed measure is compared with the measures reported by Ruxanda et al. [15] and Imasogie and Wendt [10]. Table 5 displays the values of nodularity. It is interesting to note that there is a variation in the measurement results. The percentage of nodularity computed by Imasogie and Wendt [10] is practically small, 0.4 for the three regions; consequently, it cannot distinguish the effects of roundness. Contrarily with Ruxanda et al. (2002) and the proposed measure the percentage of nodularity is greater than 80%.
4.5 Independent of resolution
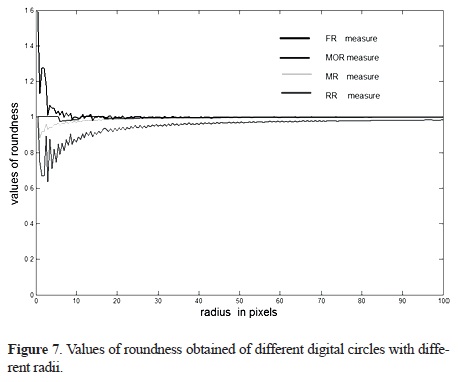
Finally, the next experiment was carried out to explain the differences between the measures in terms of the resolution. To carry out this task, perfect circles were digitally drawn with radii varying from 1 to 100 with increments of 0.5. For the sake of simplicity, the calibration was set at 1 pixel equal to μm. The results are illustrated in the Fig. 7. From this graphs it can be seen the RF measure does not maintain the basic requirements that a roundness measure should have. It must range over [0,1] where 1 is scored only by a perfect circle. As it is appreciated, the proposed roundness measure (MOR) in red, converges faster to values near to one.
It is noteworthy that the introduced measure (MOR) is a generalized measure. Therefore, it satisfies the following properties: (1) It ranges over
[0,1] where 1 is scored only by a perfect circle. (2) It is invariant with respect to resolution, so the measure becomes independent of the equipment. (3) It is tolerant with shape variations. (4) It is tolerant with respect to noise or narrow intrusions. And (5) it can be easily compared to human perception. In such a way, the introduced measure can therefore be adopted as an alternative to measure the roundness of graphite nodules.
5. Conclusions
In this article a new quantitative method to estimate the degree of roundness of graphite particles was introduced. The proposed measure takes into consideration the dominant geometry of the nodules. The performance of this measure was compared with three measures: the Roundness Factor (RF), the Mean Roundness (MR) and the Radius Ratio (RR). The first of these, the RF proposed by ASTM committee was demonstrated to be strongly affected by irregularities in the contours. Consequently, it may easily fail, particularly, when the maximum Ferrets diameter is larger than the diameter of the inscribed circle. In the same manner, RR is affected by the abrupt changes in the contours and by the shape resolution. It is reasonable to expect that even when a graphite particle has a shape close to a circle the presence of small and elongated features could render false results. On the other hand, the MR measure is less appropriate to characterize the nodularity of a graphite sample. The main reason is, it cannot discriminate between different shapes. Another reason is, it is based on the average radius which not represents a good estimator for characterizing the roundness of irregular particles.
In summary, the proposed measure is more robust to compute the roundness of the graphite particles because it is capable of adapting to different scenarios, such as, resolution, small irregularities in the contours.
References
[1]. T. Skaland, O. Grong, T. Grong, J. Metall Trans A, 24, 2347, (1993). [ Links ]
[2]. F. Iacoviello, V. Di Cocco, In proceedings of International Conference on Fatigue Crack Paths. September Parma-Italy, 116, 18, (2003). [ Links ]
[3]. T. Xin, Z. Hong, R. Lu-quan, Z. Zhi-hui, C. Ren-doing, International Journal of Fatigue 31, 668, (2009). [ Links ]
[4]. F. Nabil, A. Aly, S. Moenes, Mater. Sci. Eng. A, 504, 81,(2009). [ Links ]
[5]. R.C. Dommarco, A.J. Jaureguilberry, J.A. Sikora, Wear, 261, 172, (2006). [ Links ]
[6]. American Society for Testing and Materials. ASTM A247. Standard Test Method for Evaluating the Microstructure of Graphite in Iron Castings. [ Links ]
[7]. J. Li, L. Lu, M.O. Lai, Mater. Charact., 45, 83, (2000). [ Links ]
[8]. S. H. Pudale, R. J. Rogers, G. R. Nadkarni, AFS Trans., 98, 98, (1998). [ Links ]
[9]. J. Ohser, K. Sandau, W. Stets, W. Gerber, Practical Metallographic, 40, 454, (2003). [ Links ]
[10]. B.I. Imasogie and U. Wendt, Journal of Minerals & Materials Characterization & Engineering, 3, 1, (2004). [ Links ]
[11]. A. De Santis, O. Di Bartolomeo, D. Iacoviello, F. Iacoviello, J. Mater, Proc. Technol. 196, 292, (2008). [ Links ]
[12]. L.A. Morales-Hernández, I.R. Terol-Villalobos, A. Domínguez, F. Manriquez, G. Herrera-Ruíz, J. Mater. Proc. Technol., 210, 335, (2009). [ Links ]
[13]. D.W. Hetzner, Microscopy Today, 10 (2008). [ Links ]
[14]. N, Ritter, J. Cooper, J. Math Imaging Vis., 35, 117, (2009). [ Links ]
[15]. R.E. Ruxanda, D.M. Stefanescu, T.S. Piwonka, AFS Trans., 110, 1131, (2002). [ Links ]

