


Services on Demand
Journal
Article
 English (pdf)
 Article in xml format
 Article references
 Send this article by e-mail
Indicators
-
 Cited by SciELO
 -
 Access statistics
Related links
-
 Similars in
SciELO
Similars in
SciELO
Share

 Permalink
Economía mexicana. Nueva época
Print version ISSN 1665-2045
Econ. mex. Nueva época vol.22 n.2 Ciudad de México Jan. 2013
Artículos
Social Protection Programs and Employment. The Case of Mexico's Seguro Popular Program
Programas de protección social y empleo: El Seguro Popular mexicano
Raymundo M. Campos-Vázquez and Melissa A. Knox
Profesor-investigador, Centro de Estudios Económicos, Colmex. Mexico City. rmcampos@colmex.mx
Lecturer, Department of Economics, University of Washington. Seattle WA, USA. knoxm@uw.edu
Fecha de recepción: 31 de enero de 2011;
fecha de aceptación: 24 de mayo de 2012.
Abstract
Mexico created Seguro Popular in 2002 with the goal of providing free or subsidized health insurance coverage to 47 million uninsured people by the year 2013. Hence, one unintended consequence of the program could be an increase in the size of the informal sector. The introduction of the Seguro Popular program was conducted in stages, across municipalities and time. We exploit this variation and implement a differences-in-differences approach in order to identify the causal effect of the program in formal employment outcomes. We analyze the effect of Seguro Popular using 33 large and relatively rich cities from labor force surveys conducted from 2001 to 2004. In order to measure the effect for poorer municipalities, we also use the individual-level Oportunidades dataset that covers 136 municipalities from 2002 to 2004. We find little evidence of any correlation between Seguro Popular and the decision of workers to be employed in the formal or informal sector. One possible explanation of our findings is the low enrollment of the Seguro Popular program during the period we study. We provide suggestive evidence from the 33 cities that the result holds for the 2005 to 2006 period as well. We conclude that the recent increase in informal employment in large municipalities in Mexico is due to other causes.
Keywords: informality, Mexico, employment, Seguro Popular.
Resumen
México creó el Seguro Popular en 2002 con el objetivo de proveer un seguro de salud subsidiado o gratuito a los 47 millones de no asegurados para el año 2013. Por lo tanto, una consecuencia no intencionada pudiera ser un incremento en el tamaño del sector informal. La introducción del Seguro Popular se realizó en etapas a lo largo de los municipios en el tiempo. Explotamos esta variación e implementamos un enfoque de diferencias-en-diferencias para identificar el efecto causal del programa en el empleo. Analizamos el efecto del Seguro Popular en 33 grandes áreas metropolitanas de las encuestas de empleo realizadas entre 2001 y 2004. También utilizamos datos a nivel individual del programa Oportunidades, que cubre cerca de 136 municipios, de 2002-2004. Encontramos poca evidencia de cualquier correlación entre el Seguro Popular y la decisión de los trabajadores de estar empleados en el sector formal o informal. Una posible explicación de nuestros resultados es que analizamos un periodo en el que la proporción de asegurados en el Seguro Popular es baja. Proveemos evidencia sugestiva que el resultado para las 33 ciudades se mantiene para 2005 y 2006. Concluimos que el incremento en el empleo informal en esas grandes ciudades se debe a otras causas.
Palabras clave: informalidad, México, empleo, Seguro Popular.
JEL classification: J4, H51, O1, O54.
Introduction
There have been many empirical studies on the effects of means-tested social assistance programs on labor supply in the United States and other industrialized nations (see Moffitt, 2002 for an overview of programs in the United States). While many of these studies have found that some types of social assistance programs do have negative effects on individual labor supply decisions (e.g. afdc, Hoynes, 1996), other programs appear to have little or no effect on labor supply (e.g. Food Stamps, Hagstrom, 1998). The link between social assistance and employment is even less clear in developing countries. Little empirical research has been done, and we cannot necessarily extrapolate from the developed country case. One reason we may expect to find stronger effects of these programs on employment in Less Developed Countries (LDCS) is the prevalence of large, legal informal labor markets in these countries. In the presence of strong informal labor markets, the incentives to reduce employment offered by means-tested social assistance programs may drive workers to hide income or employment itself by working in the informal sector.
These large informal labor markets themselves are another reason to be interested in the employment effects of social assistance programs specific to LDCS. These countries face a continuous trade-off between providing social programs to their large poor populations and concerns about the loss of efficiency and economic growth which is believed to be associated with the growth of informal labor markets (Perry et al., 2007). Authors like Baeza and Packard (2006), Levy (2008) and Wagstaff (2007) advocate a change in the means of financing social assistance programs in LDCS, because of the belief that these programs promote informality and that informality negatively affects productivity and economic growth.1 While we cannot address the latter concern in the present study, we do attempt to provide some evidence of the role (or lack thereof) of social assistance programs in promoting informality in the labor market.2
In this paper, we contribute to the literature on the employment effects of social assistance programs in the developing world by examining the case of Mexico's Seguro Popular program. Designed in part to increase and improve health care access for Mexico's approximately 50 million uninsured citizens, Seguro Popular (SP) is a component of Mexico's sweeping health system reform, begun in the early 2000s and scheduled to cover all uninsured by 2013. In particular, workers can have access to SP only if they are not covered by Mexico's official, formal, social security institutions. Hence, SP may provide incentives to workers to stay in the informal sector for longer periods of time or to switch from formal to informal sector jobs. In this paper we look for evidence of that claim.
We are not the first to examine the impact of the SP in the labor market. Barros (2008) finds no impact of the program in formal employment trends. We view our paper as complementary evidence. Barros (2008) relies on consumption-income expenditure surveys, while we focus on employment surveys. Also, he aggregates the information at the state level, while we use municipality level information. Azuara and Marinescu (2011) also analyze the impact of Seguro Popular on informality using a similar strategy to the one used in this paper. However, they analyze individual data, while we use aggregate information at the municipal level. Aggregating information allows us to show trends before and after the program was implemented across municipalities. Both Barros (2008) and Azuara and Marinescu (2011) find no effect of Seguro Popular on formal employment outcomes. Aterido et al. (2011), on the other hand, find a small negative impact of Seguro Popular on formal employment. However, Aterido et al. (2011) focus in the joint decisions of members within the household.
Our analysis follows a difference-in-difference approach, exploiting the variation created by the time-staggered entry of Mexican municipalities into the program. We use two longitudinal data sets, the National Survey of Employment (Encuesta Nacional de Empleo or ENE) and the Urban Household Evaluation Survey (Encuesta de Evaluación de los Hogares Urbanos or Encelurb), the evaluation survey for the implementation of the Oportunidades program in urban areas. These two data sets cover over 150 municipalities during the early years of Seguro Popular implementation, from 2001 through 2004. We look for evidence of significant shifts in employment out of the formal sector in municipalities where workers were given access to the Seguro Popular program during the period studied. Our comparison group is the set of municipalities which had not yet received the program by the time of our study.
We find little evidence of significant effects of Seguro Popular on the labor market, at least during these early years of the program. Although we cannot outright reject a small negative effect, our estimated coefficients are small and mostly insignificant. They tell us that there is little change in the likelihood of being formally employed in a city once it gains access to Seguro Popular. In the aggregate results, males with less than a high school education have the largest negative response to the Seguro Popular program of all demographic groups we analyze. The estimated coefficient implies a 1 per cent decline in formal employment rates after the introduction of Seguro Popular; however, the result is not statistically significant. We analyze several specifications to test the robustness of the result. We consider how Seguro Popular affected formal employment outcomes with a lag and on growth rates of formal employment instead of levels. We restrict the sample to specific demographic groups, exclude government and agriculture, exclude non-salaried workers and the results do not change. The individual data set analysis confirms the aggregate data results. Individuals in cities with Seguro Popular are not more likely to switch from formal to informal sector jobs than individuals in cities with no Seguro Popular. Another common result across data sets is that Seguro Popular does not modify female employment decisions. The results often include estimates with the wrong sign and large standard errors. In sum, both data sets indicate that SP does not significantly affect employment outcomes.
We also consider alternative explanations for the lack of a measurable effect. These include the possibility that take-up of the program is not high enough during the period of our study to allow changes in employment to be detected, and the possibility that the Seguro Popular program is not valued enough by its potential beneficiaries to provide an incentive to leave the formal sector. We provide suggestive evidence for the years 2005-2006 using aggregate data for the municipalities analyzed for the period 2001-2004.3 Cities that substantially increased the coverage of Seguro Popular did not change their formal employment rates substantially.
The rest of the paper is organized as follows: In the first section, we give a history of the social security system in Mexico, including the perceived disparities which led to health care reform in the early 2000s. We also detail the structure of that reform, including the Seguro Popular program and its implementation. A brief overview of the literature on informality in Mexico is also given in this section. Then, we describe an individual decision-making model, which shows how a worker may decide to switch out of the formal sector when given access to a means-tested social assistance program. Section III explains in detail the two data sets used in our analysis, the Encuesta Nacional de Empleo and Encuesta de Evaluación de los Hogares Urbanos, while section IV converts our decision-making model into econometric form and discusses identification issues. Section V describes and interprets the results of our analysis, and section VI concludes, pointing the way for future research.
I. Background and History
1.1. Mexico's Health Care System and Reform
Mexico's current social protection system was born in 1943. Under it, formally employed workers (and their families) are entitled to a full spectrum of benefits including health insurance.4 In exchange for these benefits, they and their employers pay payroll taxes amounting to roughly 24 per cent of their salaries excluding other local and federal taxes. The unemployed and workers not employed in the formal sector are not entitled to these benefits, although there is a network of social assistance programs to which they do have access. In the specific case of health care, two institutions were created for formal sector workers: the Instituto Mexicano de Seguro Social (IMSS) and the Instituto de Seguridad y Servicios Sociales de los Trabajadores del Estado (ISSSTE), for workers in the private and public segments of the formal sector, respectively. The Secretaria de Salud y Asistencia (SSA) was created to serve all others. As the name indicates, the role of the latter institution was purely "social assistance", and while these services are intended to provide for up to 50 per cent of the population, they account for less than a third of federal health spending (Lloyd-Sherlock, 2006).
By 2000, the inequalities in this system were apparent. Nearly 50 per cent of the Mexican population, amounting to 47 million people, was uninsured (Secretaria de Salud, 2004). The World Health Organization (2000) ranked Mexico 144th out of 191 countries in fairness of health care finance, and the Mexican Ministry of Health estimated that 2 to 4 million families, or 10 to 20 per cent of the total population, suffered catastrophic and impoverishing health care expenses every year. These families were almost exclusively drawn from the lowest income quintile, and were four times more likely to be uninsured than insured (Secretaria de Salud, 2004). The System for Social Protection in Health, Sistema de Protección Social en Salud (SPS), was designed in the early 2000s to address some of these issues. A key component of this reform was the Seguro Popular program. Passed into law in 2004 as a modification of the existing General Health Law, the program actually began with a pilot phase in five states in 2002. The goals of Seguro Popular are three-fold: 1) financial protection for workers in the informal sector, 2) the creation of a "culture of prepayment" for SPS beneficiaries, and 3) a reduction in the number of families that are driven into poverty due to unexpected health shocks (Secretaria de Salud, 2004).
The Seguro Popular program is a large-scale undertaking. One of the program's goals was to increase health care spending in Mexico by 1 per cent of GDP (Knaul and Frenk, 2005); and, as mentioned previously, the program will eventually cover up to 47 million people. For these reasons, the program has been implemented in stages. The program achieved full geographic coverage over a five year period according to the following schedule: five states were covered in 2002, 16 states were added in 2003, seven additional states were covered by 2004, and the remaining four states were covered in 2005 and 2006. In addition to this geographic roll out, the program was also implemented in stages by income levels. For the first five years of the program, the emphasis was on covering the lowest income quintile before all others (although some evidence exists that higher income families were also given coverage during this period). On top of these considerations, the law creating Seguro Popular specified that priority should be given to coverage of families in rural areas and areas of high deprivation, as well as to the indigenous population (Gakidou et al., 2007).
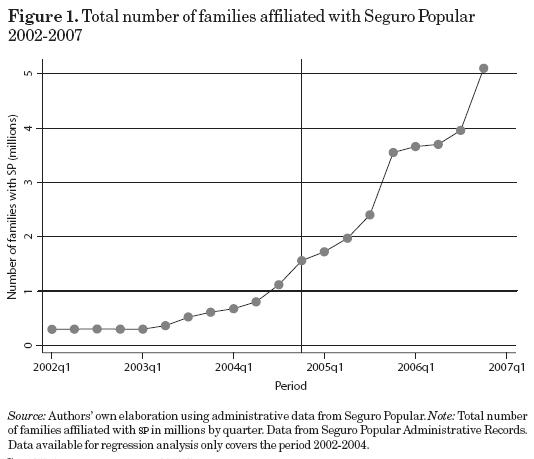
Figure 1 shows the total coverage of SP over time up to the first quarter of2007 (the data is drawn from Seguro Popular administrative records). In the initial years of the program, the number of beneficiaries was low. For example, between 2002 and 2004 coverage increased to 1.5 million families, representing roughly 6 per cent of the families in Mexico. By 2007, however, over 5 million families were affiliated with SP, representing around 20 per cent of the total number of families in the country. In this paper we only deal with the effects of the program until 2004 due to data limitations explained below, although we present evidence that our results hold for the period after 2004.
The Seguro Popular program was designed to give affiliates access to primary, secondary and more advanced health care. The original package of benefits for program affiliates consisted of 169 interventions and 333 drugs, covering 90 per cent of the disease burden in Mexico. By 2006, the benefit package was expanded to cover 95 per cent of the disease burden. Preliminary studies have shown that the program appears to be achieving its stated goals. Gakidou et al. (2007) found that Seguro Popular affiliates used more health services and were less likely to incur catastrophic health expenses than the uninsured, and Knaul et al. (2006) found a reduction in the deepening of poverty from health spending between 2000 and 2004.
In sum, SP is a full package of benefits for workers with no access to formal social security institutions, which appears to be achieving its goal of promoting equity through health coverage to uninsured individuals. The potential cost of achieving this goal is that the program may distort labor market decisions; workers in the informal sector have incentives to stay in the informal sector for longer periods of time, and formal sector workers could switch to the informal sector. In section III we present a simple model that explains this decision. First, we present a brief overview of informality in Mexico.
I.2. Informality
In Mexico and many Latin American countries, informal workers can be defined by their lack of access to social security benefits. Using this definition, table 1 shows average rates of formal employment in Latin America between 2002 and 2004. Mexico's formal sector is smaller than the region average, with only 40.6 per cent of workers formally employed. There are several reasons why this prevalence of informality is a concern for society. At the individual level, workers lack protection from health-related shocks, employment protections, and old age pensions, among other services. This can be detrimental to the workers themselves and detrimental to the economy, as their productivity may suffer when they experience shocks against which they are unable to insure. Productivity at the firm level is also a concern with informality. Firms with informal workers tend to be smaller than optimal, often as a result of lack of access to credit and markets, as well as in an attempt to evade detection (if their informal status is considered illegal). Finally, the smaller size of informal firms may lead to lower productivity growth at the aggregate level (Levy, 2008).
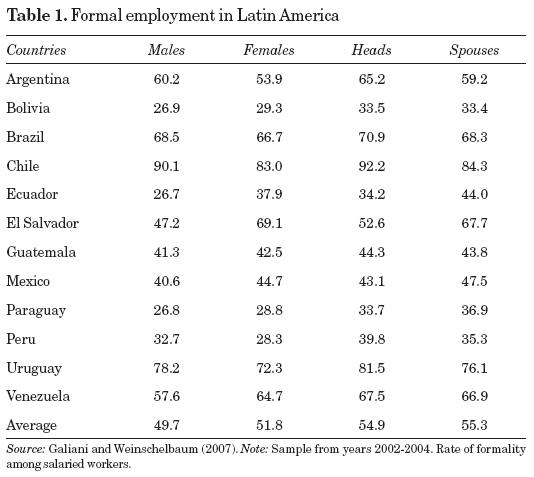
There are three stylized facts that are often used to characterize the informal sector in Latin America (Galiani and Weinschelbaum, 2007). Two out of the three can be used to accurately describe Mexico's informal economy. First, they claim, informal workers tend to operate in small firms, while formal workers are found more often in large firms. In the Mexican case, 73 per cent of informal salaried workers were employed in firms with 15 or fewer employees in 2004, while 98 per cent of informal self-employed workers were found in firms with fewer than 15 employees (Perry et al., 2007). Next, unskilled workers tend to be in informal jobs, while skilled workers tend to be in formal jobs. For example, among Mexican workers with less than a high school education, only 33.6 per cent were employed in the formal sector in 2004, while 68.8 per cent of those with more than a high school education were formal (Galiani and Weinschelbaum, 2007). Another closely related fact about Mexico is that the proportion of workers who are employed in the informal sector varies by age group. In 2004, almost 90 per cent of 15 year old workers were in the informal sector, but the proportion declined to below 40 per cent for 24 year olds, and leveled off to around 20 per cent for older workers (Perry et al., 2007). Finally, in most Latin American countries secondary workers are less likely to be in the formal sector than primary workers. In Mexico, however, the reverse is true. Table 1 shows that 47.5 per cent of spouses are employed in the formal sector, compared to only 43.1 per cent of household heads.
While this discussion treats informality as a homogeneous issue, it is important to note that in reality there are two different types of informal workers: the self-employed and informal salaried employees. So, while it is true that lower skilled workers are more likely to be found in the informal sector, there is another group of informal workers, the self employed, who are experienced workers and who have high levels of human capital. The recognition of these two worker types has lead to two competing models of informality, which view informal workers either as those who are excluded from the formal sector and its benefits, or as those who have chosen informal sector work as optimal for their set of preferences and personal characteristics. Most current work on the subject recognizes that both models of informality apply, depending on the situation and the individual (Perry et al., 2007; Galiani and Weinschelbaum, 2007; Maloney, 2004). Although we are not able to distinguish between the two types of workers in the present study, we remember that there are several paths to informality, and that informal workers can be found in many different demographic groups. For this reason, we examine labor market behavior by age, sex, and education in the analysis that follows.
Another characteristic of the Mexican labor force as a whole is high mobility between the formal and informal sectors (Perry et al., 2007). Between 1987 and 2004 the average male informal worker had a 40 per cent probability of switching into the formal sector in a one year period, while the average formal sector worker had approximately a 10 per cent chance of becoming informal in the same period. Similarly, nearly 35 per cent of female informal workers moved into the formal sector in any one year, while a little over 10 per cent of female formal sector workers made the switch. Worker flows out of the formal sector can be broken down further by income. In 2005, about 11 per cent of formal high wage workers (those who make more than three times the minimum wage) moved to the informal sector, while approximately 16 per cent of formal low wage workers made the switch. A survey of 9 million formal sector workers conducted between 1997 and 2005 found that the average low wage worker spent 4.3 of those nine years in the formal sector, with only 11 per cent staying in the formal sector for the full nine years. Meanwhile, the average high wage worker spent 6.5 years out of nine in the formal sector, while 42 per cent of those workers spent the full nine years formally employed (Perry et al., 2007).
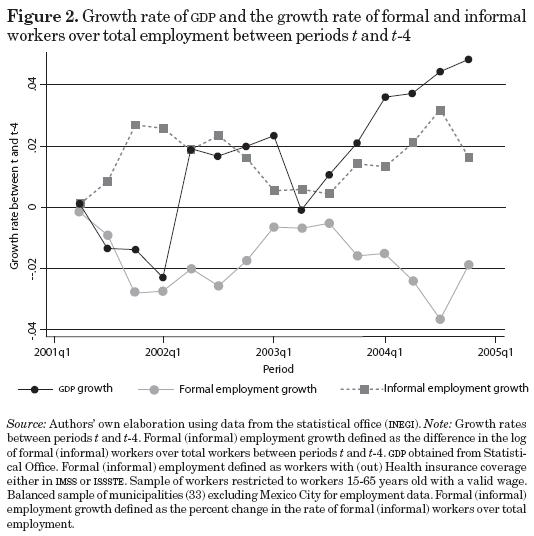
In Mexico, current employment trends show a decline in the share of employment which is considered formal. Figure 2 shows recent trends in growth of both formal and informal employment rates in 33 large Mexican cities, along with GDP growth for the entire country. Between 2001 and 2005, growth in informal employment has been positive. In the same time period, as GDP has grown, formal employment has fallen. Levy (2008) shows that even though the labor force grew by 8.5 per cent between 2001 and 2005, formal employment grew by only 0.5 per cent. This translates into the share of formal workers in the labor force falling from 38.4 per cent to 37.3 per cent, and the share of informal workers rising from 58.8 per cent to 59.5 per cent between 2001 and 2005. There are many possible explanations for this increase in the informal sector of the economy. As mentioned in Galiani and Weinschelbaum (2007), part of the growth of informality in Latin America is driven by increases in female labor force participation. As women are more segregated in low-skill, part-time jobs, an increase in female labor force participation increases informal employment mechanically. Women are also frequently secondary workers in their households. Since social security protections apply to the entire family of a formal worker, there is less incentive for a second worker in a family to enter the formal workforce (and pay the necessary taxes). However, as mentioned above, table 1 shows that in Mexico the proportion of spouses in the formal sector is higher than the proportion of household heads in the formal sector. It is not clear, then, that increased female labor force participation is driving the growth of informality in Mexico. Levy (2008) argues that another possible explanation for the observed increase in informality is the growth in scope and size of social assistance programs, such as Seguro Popular, provided to those in the informal sector. This is the claim we investigate in this paper. Accordingly, the next section provides a model of the perverse labor market incentives that are a possible side-effect of social assistance programs, and proposes a possible response of workers to these incentives.
II. A model of individual choice in the labor market
Recent concerns about the effect of social assistance programs on labor market decisions have focused on the role of these programs in promoting informal employment (Perry et al., 2007; Levy, 2008). Some believe that social protection schemes, like Seguro Popular, which are provided to those without access to formal social security, will create incentives for workers to seek employment in the informal sector over the formal sector. This will then lead to the inefficient outcomes mentioned in the previous section. In this section we explore the relationship between social assistance programs and a worker's choice to be employed in the informal sector of the labor market. We explain how access to a program like Seguro Popular can affect a worker's labor market choices, and discuss the circumstances under which SP might encourage informality.
We explain the worker's decision making process with a simple competitive model of a labor market with both formal and informal sectors, and the strong assumption of free mobility between the sectors. This model proposes that workers will move between the sectors until, at equilibrium, wages and benefits in the formal sector will equal wages and benefits in the informal sector. When this occurs, workers will be indifferent between sectors.
In the generic case, before the introduction of a social assistance program, the value of working in the informal sector is simply informal sector wages. In the formal sector, however, the value to the worker is formal wages plus social security benefits minus costs associated with entering the formal sector.5 After the introduction of a social program targeted to workers in the informal sector, the value of working in the informal sector increases to informal wages plus the new benefits. With the value of working in the informal sector now higher than that of working in the formal sector, employment in the informal sector will increase as workers seek these now relatively more attractive jobs. As employment in the informal sector increases, informal wages will decrease. Meanwhile, wages in the formal sector will increase as workers leave that sector. Eventually, a new equilibrium will be reached, in which the value of working in the formal sector is equal to the new value of working in the informal sector. In this model, the effect of a social assistance program like Seguro Popular is an increase of employment in the informal sector, resulting in an inefficient allocation of employment between the two sectors (Levy, 2007, 2008).
More formally, a worker attempting to maximize her utility, U(L, Y), over leisure and income faces two possible budget constraints:
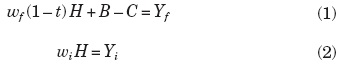
Here L is leisure, H is hours worked, and T = L + H is a fixed number of total hours available. Also, wf and wi are the wages in the formal and informal sectors respectively, t is the tax rate for formal workers, B is the value of formal and informal sector social security benefits, C is the costs associated with obtaining a job in the formal sector, and Yf and Yi are income in the formal and informal sectors. The worker takes her own tastes for leisure, as well as her valuation of B, the social security package, and C, entry costs, into consideration when choosing in which sector to work. When equilibrium is reached, Yf = Yi ; and workers are indifferent between the sectors.
Once a social protection program is introduced, Yi will increase by G, the value the worker places on the services provided by the social program. This has the effect of increasing income for informal sector workers, driving some workers out of the formal sector and into the informal sector. Eventually, a new equilibrium is reached, which can be expressed by the following equation:

Given this model, we expect to find that if workers are placing a value on social protections granted to the informal sector, then there will be a measurable shift of employment out of the formal sector and into the informal sector when Seguro Popular becomes available in an area. We discuss how we attempt to measure these effects in section IV.
While this model is consistent with those common in the public finance literature explaining the labor market effects of cash transfers in the U.S. (Moffitt, 2002), it is important to note that the worker's choices depend on her own valuation of the benefits provided by both the formal and informal sectors. For some workers, the benefits provided by Seguro Popular will fulfill their perceived health care needs, while for others, perhaps older workers or those with young children, they are far outweighed by the more complete benefits provided by IMSS and ISSSTE. We also recognize that there are different "types" of employees, some of whom find work in the informal sector to be more attractive. As discussed in the previous section, these might be younger workers, workers with children who need flexible employment, or even more experienced workers with a desire to be self-employed. This can be thought of as a distribution of values of C across workers. Because of this variation in B and C, we expect to find the effects of the introduction of SP to be heterogeneous in the population, and we analyze the effects of SP on different demographic groups separately.
III. Data
In order to test whether Seguro Popular has an effect on formal and informal employment, we merge administrative records of Seguro Popular by municipality6 with two different large data sets from Mexico, the National Survey of Employment (Encuesta Nacional de Empleo or ENE) and the Oportunidades evaluation survey (Encuesta de Evaluación de los Hogares Urbanos or Encelurb). The administrative records we use were provided by the Seguro Popular administration in Mexico City. They contain the number of individuals and families with Seguro Popular by city and quarter from 2002 through the end of 2006.
The ENE is a quarterly data set for a sample of 45 cities, which are similar to MSAs in the U.S. It is a rotational panel data set in the sense that a household is followed for five consecutive quarters. We focus on data gathered from 2001 through 2004. We begin our analysis in 2001 in order to control for regional characteristics before Seguro Popular was implemented, and we end it in 2004 because in 2005 the ENE was replaced by a different survey, the ENOE.7 Although the new survey was similar in spirit to the ENE, employment trends were not matchable by city and demographic group for the years 2004-2005, and so we were unable to extend our panel past 2004. (We do, however, use the ENOE to provide additional evidence of SP's effects between 2005 and 2006.) We work with a balanced sample of 33 cities in the ENE after we exclude Mexico City from the calculations.8
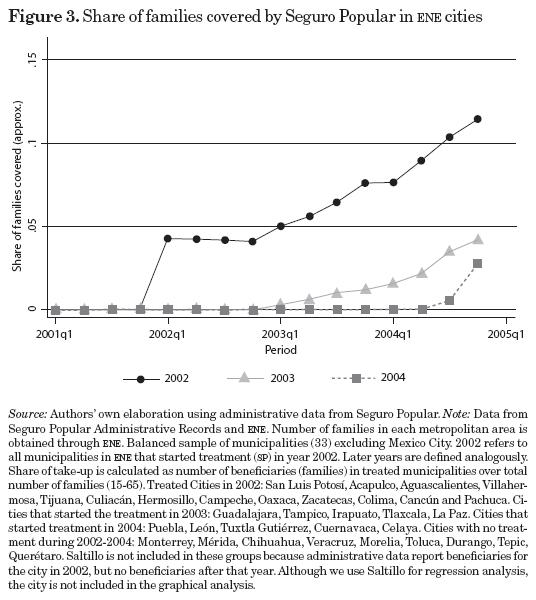
Figure 3 shows the proportion of families affiliated with Seguro Popular in the cities covered by the ENE, while in the Appendix we show the rate of SP enrollment in the ENE cities over time.9 The cities are grouped by the year the program was introduced to them, resulting in three groups of cities being represented on the graph (the group of cities that did not implement SP until after 2004 is not included). Affiliation with Seguro Popular, which rises over time in each of the groups, serves here as a proxy for availability of, and knowledge about, the program.10 For the group of cities that started treatment in 2002, the proportion of beneficiaries in the population slowly rises up to 12 per cent in 2004. Although the largest expansion of the SP program occurred after 2004 as shown in figure 1, a 12 per cent take-up rate in the population is not small. The proportion of the population or families not covered by the formal sector is close to 50 per cent. Hence, the SP program is covering 24 per cent of eligible families. In the empirical analysis section we look not only for the effects of SP on the decision to switch to informal sector jobs, but also on the level of the proportion of workers in the formal sector. For example, if 25 per cent of eligible individuals are enrolled in the SP program, they may move out less often from the informal to the formal sector, and hence contribute to a permanent higher rate of informality in the economy.
We use the ENE data to test for an effect of SP on formal employment at the city level for a subsample of the population that we consider working aged, those between 15 and 65. The main criticism of this identification strategy is a sample selection bias (large cities may have less propensity to be affected by such programs). Given these limitations, we supplement our results with an analysis of a complementary data set, the Oportunidades (formerly Progresa) evaluation survey, known as Encelurb. This stage of the Oportunidades program targeted extremely deprived households in urban communities. The Encelurb is an annual panel covering 12,500 Mexican households (over 74,000 individuals) in 136 urban municipalities and 17 states. The households selected to be in the survey were either eligible for the urban expansion of the Oportunidades program or just above the eligibility cut-off, and are therefore low income households. The survey was conducted in 2002, 2003 and 2004. The data contain information on employment, income, education and health for each member of the surveyed households. In this analysis, we use a sub-sample of 28,675 individuals who are aged 15 to 65 in the three years studied. Although this survey is not representative at the municipality level, it contains a large sample of municipalities, which increases the power to identify the effect of Seguro Popular on formal employment, and increases the generalizability of our result. Moreover, the Encelurb is a panel data set which allows us to test whether SP affects an individual's choice between formal and informal employment.
Figure 4 shows the evolution of Seguro Popular enrollment in the Encelurb municipalities from 2002 to 2007. Again, the municipalities are grouped by the year they received treatment, for four groups in total. Unlike the cities in the ENE, we do not have the total number of families in the Encelurb municipalities, so we can only show the average number of families treated based on the 2000 census population estimates in these municipalities. Enrollment patterns in the Encelurb municipalities are similar to enrollment patterns for the country as a whole, with enrollment increasing slowly until the end of2004 (the end of the Encelurb data) and more rapidly after.
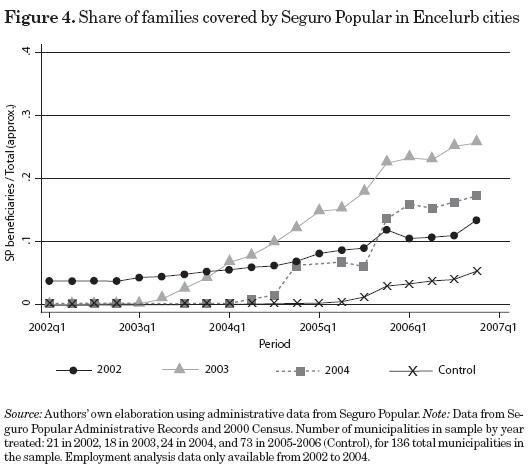
Table 2 gives some 2002 descriptive statistics for our two data sets, and contrasts them to results for workers from Mexico's 2000 census.11 The demographic data shown is for workers aged 15 to 65. The table shows that the cities in the ENE sample are larger, and their residents are more highly educated than the average Mexican municipality. We also see that these cities have more employment, although the proportion of employment that is in the formal sector is slightly lower. Since the Encelurb data is from a non-representative sample of households within selected municipalities, it is possibly misleading to present summary statistics for these municipalities on the whole. Instead, we look at the characteristics of the individuals in the sample (with the exception of average population, which is taken from the 2000 census for the entire municipality). We see from table 2 that workers in the Encelurb sample are much poorer, much less educated, and much less likely to be employed in the informal sector than workers in the ENE cities or the average Mexican municipality. The Encelurb sample is similar to the average Mexican municipality in the proportion of the working aged population that is employed, and it is similar to the ENE in the average age of workers.
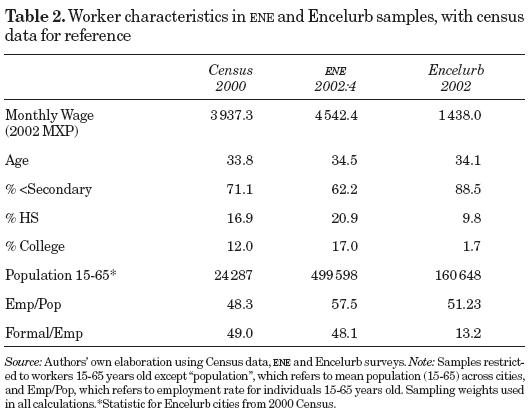
In our samples, a formal sector worker is defined as a worker in a paid job with social security protection, either IMSS or ISSSTE.12 Hence, an informal worker is defined as a worker in a paid job without social security protection. We restrict the sample to workers with a valid wage. Many previous studies of the informal sector (Maloney, 2002, 2004) choose to disaggregate the informal sector into the self-employed and salaried workers, and then exclude owners of businesses and professionals with no social security from their definition of informal employment.13 We do not follow this convention. While the self-employed may indeed have different characteristics from the workers who are conventionally thought of as informal, we recognize that those who are interested in self-employment may be likely to take the existence of social assistance programs into their cost-benefit analysis when deciding whether to remain formally employed or to strike out on their own. For this reason, we analyze the behavior of both informal worker types together, but we analyze worker behavior separately by demographic group. We also include the unemployed in our definition of informal sector workers when analyzing individual level data, since they are eligible to receive Seguro Popular benefits, and some marginal individuals may choose unemployment over formal sector employment if benefits are large enough.
IV. Empirical strategy
IV. 1. Aggregate level
In this paper, we look for evidence of the effect of the Seguro Popular program on formal sector employment by using both aggregate data at the level of the metropolitan area, and individual level data. In this subsection, we cover our empirical strategy for the aggregated data. By analyzing aggregate data, we hope to find whether the share of employment in the formal sector falls when a metropolitan area gains access to SP. We achieve this by following Autor et al. (2006) in exploiting the geographical variation in the implementation of the SP program during the time period we study. We use the ENE data set and aggregate information at the metropolitan area level in order to estimate the following regression:
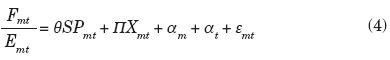
where F represents formal employment and E total employment by metropolitan area m and quarter-year t, such that expresses the share of the formal sector in total employment. The SP variable takes a value of 1 if Seguro Popular is available in metropolitan area m at time t, and 0 otherwise.14
Metropolitan area characteristics (per cent of manufacturing jobs, per cent of young adults 15 to 24, per cent of college graduates) are included in the vector X. In all our estimations we control for time-invariant characteristics for metropolitan areas, and also for quarter-year shocks that affect all metropolitan areas in the same way. As we are aggregating at the city level, we report results using weights  , although this has little impact in the estimation. We estimate robust standard errors allowing for arbitrary correlation across time at the municipality level, as suggested by Bertrand et al. (2004). If the hypothesis proposed by Levy (2008) is correct, and social programs, like Seguro Popular, promote informal employment, then we expect θ to be negative, implying that formal employment as a share of total employment will decrease in areas that gain access to the program.
Even though we have information on the number of families and individuals affiliated with Seguro Popular by metropolitan area, we decided not to use this information for two reasons. First of all, as SP does not discriminate by previous health conditions, any household could wait until a negative health shock occurs to get registered, and so the number of families formally covered by the program does not reflect the number of families who are relying on it in case of need. Second, even though states decide when to begin implementing SP, the existence and extent of coverage in individual municipalities was decided by the municipality. This decision was based on a number of factors, including municipality level health resources (Secretaria de Salud, 2004). Hence, the coverage ratio is more likely to be correlated with unobserved economic characteristics of the municipalities, which are related to the prevalence of formal and informal employment. For example, a bias may arise if negative economic trends in an area cause a fall in formal employment and also prompt politicians to increase spending on social assistance programs, providing more SP coverage than other areas. Of course, this example also highlights the possible bias in our entire analysis: each municipality which chooses to provide SP to its residents may be experiencing different economic trends from those which don't. We believe this problem is mitigated by adding municipality level control variables and municipality fixed effects, as described above. Moreover, the introduction of SP was designed at the state level and as our urban sample contains only two cities within the same state, we believe that the assumption of exogeneity of the SP dummy variable we use in the regression is more likely to be satisfied. In order to investigate how SP affected different types of municipalities and to strengthen the validity of our results, we include individual level analysis using the Encelurb (Oportunidades) data in smaller urban communities, as described below. Also, recent findings by Bosch and Campos-Vazquez (2010) and Aterido et al. (2011) show that SP enrollment is not correlated with employment trends at the municipality level.
IV.2. Individual level
In order to test the effect of access to the SP program on an individual's decision to work in the formal or informal sectors, we use the difference-in-difference design described in the previous section to analyze a three year panel of individual level data, the Encelurb. We limit our sample to individuals between 15 and 65 in order to better capture the effects on the working-aged population. First, we look at the population of individuals in our sample who were employed in the formal sector in 2002, the first year of the survey. We hypothesize that if access to Seguro Popular has value to these workers, we will see some of them shift their employment into the informal sector in response to the introduction of SP in their area. Following Ardington et al. (2007), we estimate the following regression of status in the informal sector in 2004 on Seguro Popular presence and personal characteristics:

In this cross-sectional regression, Informalim is a dummy variable indicating whether person i in municipality m is working in the informal sector in 2004, given that they worked in the formal sector in 2002; SPm is a dummy variable indicating whether Seguro Popular was available in municipality m in year 2004; and X represents observable characteristics at the household and individual level, such as age, number of children under six in the household, health status, log of income, and status in the Oportunidades program. We estimate the coefficient θ with a linear probability model and cluster our standard errors at the municipality level.
As a further test, we also replicate the aggregate-level analysis of the previous section. We estimate the following regression equation to see whether the introduction of SP into a municipality has an effect on the likelihood of an individual, in that municipality, choosing to work in the formal sector:

In order to remain consistent with estimates at the aggregate level, we estimate this equation using a linear probability model, with standard errors clustered at the municipality level. Linearizing the model, Equation (6) becomes:

Here Formalimt is a dummy variable indicating whether individual i, living in municipality m is working in the formal sector in year t;αm and αt are municipality and year fixed effects, respectively; and vimt =αi + εit, where ai is an individual random effect. Estimatintg equation (7) above will give us the coefficient θ, which we can interpret as the effect of the introduction of SP into an individual's municipality on the likelihood of that individual working in the formal sector. As in the previous section, we expect that θ will be negative if the benefits of Seguro Popular do provide incentives for workers to join or remain in the informal sector.
V. Results
V.l. Aggregate level V.1.1. 2001-2004 period
V. 1.1.1. Graphical Analysis and Identification Issues The main identifying assumption of the difference-in-difference strategy outlined in section IV is that the implementation of SP is not correlated with unobserved employment trends which determine the share of formal workers in an area. In this section we present graphical evidence of the evolution of the proportion of formal workers in the ENE sample, and a graphical analysis of the effect of SP on formal employment rates. This evidence will justify our use of the difference-in-difference empirical strategy, as well as support the conclusions of the regression analysis presented below.
Earlier in this paper we discussed the possibility that the levels of Seguro Popular enrollment in each municipality may be correlated with economic trends in these municipalities. There are two pathways for this to occur. First, if cities in Mexico are more likely to increase social services when residents fall on hard economic times, it is possible that the cities which received SP first were also experiencing an unrelated decrease in formal sector employment at the same time. If this is the case, and the cities that did not receive SP did not experience the same downward trends, our difference-in-difference analysis could yield negative and significant estimates of the effect of SP on formal employment, even though the causality is actually running in the other direction. Given, however, that state and local governments were required to fund part of the SP program, and that the program was not brought into an area until adequate health infrastructure existed, it seems more likely that politicians would wait to expand the program when their cities were experiencing economic growth. If this is the case, we risk underestimating the effects of SP on informal employment, since they may be muted by the improved economic status of the municipalities which received the program first. Regardless of the direction of the bias, we are faced with the possibility that employment trends may be influencing SP, rather than the other way around.
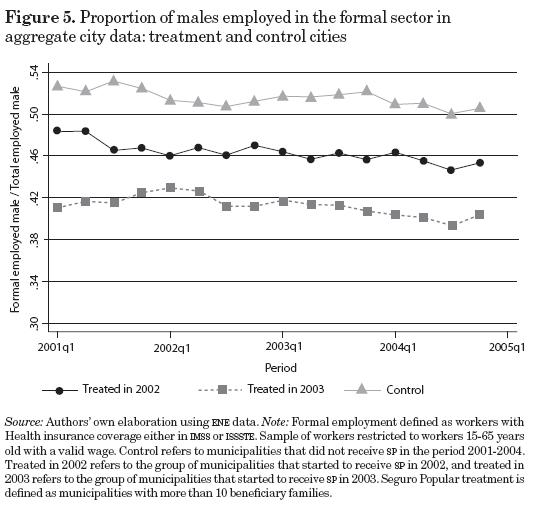
To address these concerns we use this section to document employment trends in the ENE cities, and to test whether employment trends were similar in treatment and control cities, both before and after the implementation of the Seguro Popular program. We begin by showing formal employment trends for male workers in treated and control cities during the time period of our study. Figure 5 shows the proportion of males employed in the formal sector in cities treated in 2002, cities treated in 2003, and cities treated after 2004 (never treated in our study and considered untreated for our purposes), from the first quarter of 2001 to the last quarter of 2004. While average levels of formal employment are different in each of the three groups, formal sector employment appears to be declining in all, even before the introduction of SP. The figure also shows that trends were not different across cities before the program was implemented. In the cities that received treatment in 2002, the share of families with SP increased 10 per centage points between 2002-2004 (see figure 3), but figure 5 does not show a stronger downward trend among this group.
In order to analyze the timing effect of SP on formal employment outcomes more formally, we compare the cities that started SP in 2002 against those cities that were never treated during the period 2002-2004. There are 13 cities in the treatment group and nine cities in the control group. We run a similar regression to equation (4) in order to obtain the mean difference in formal employment rates between treatment and controls for each period in the sample (normalized to the fourth quarter of 2001).15 Figure 6 shows the regression line, which hovers around zero for the entire period studied, and the confidence intervals indicate that we cannot reject the hypothesis that the normalized difference between the two groups of cities is zero at all times. We conclude that the treatment and control did not have substantial differences in male formal employment rates before or after the program was implemented in 2002.
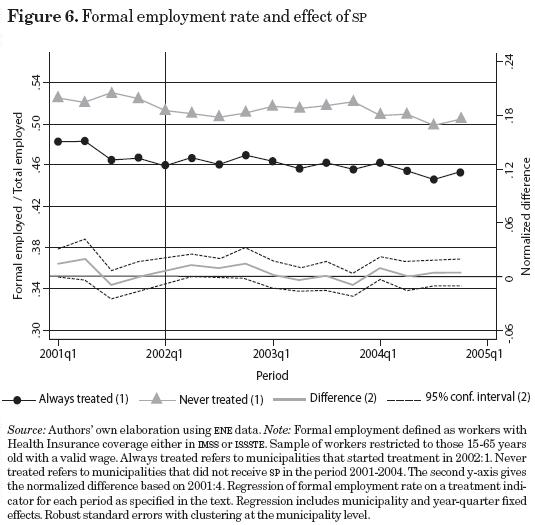
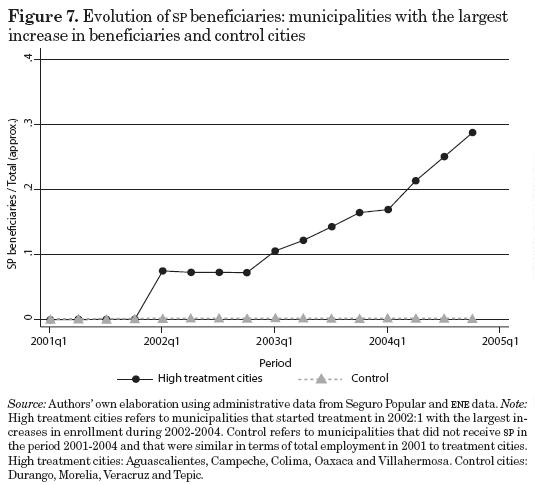
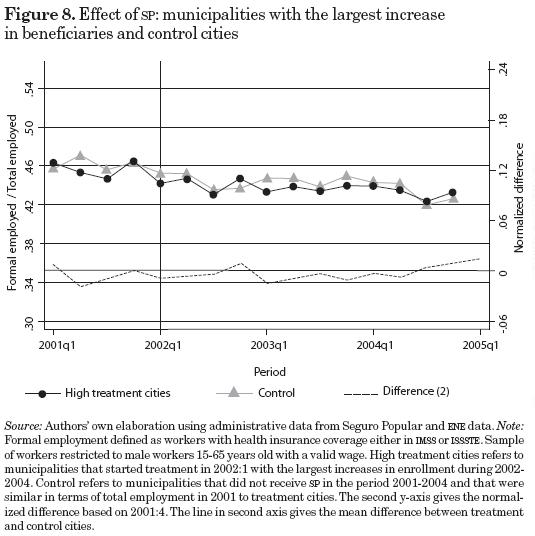
In addition to validating our use of the difference-in-differences estimator, the preceding discussion hints at the results we will present in upcoming sections. As we can see in figure 6, there is no significant difference in employment outcomes for treated and control cities in the ENE sample. One possible criticism of our method is that SP take-up was low in the early years of the program, and our inability to find an effect is due to there being only a small proportion of the eligible population that is actually treated during the period we study. In order to address this criticism, we select the five cities with the largest increases in enrollment during the 2002 to 2004 period, and compare them with a group of cities that are similar in their levels of employment in 2001.16 Figure 7 shows the evolution of the share of beneficiaries in the population for this subsample of treatment and control cities. The number of beneficiaries increased substantially in the treatment subsample during this period. However, figure 8 shows no important differences in the rate of formal employment in the treatment and control cities after SP was implemented. The y-axis on the left shows the trends in formal male employment rates, and the y-axis on the right shows the mean difference between treatment and control cities normalized to the fourth quarter of2001. We do not include a confidence interval because the number of clusters is small.17 The figure does not show any strong pattern between SP and formal employment rates during the period, even after the substantial increase in enrollment in 2003.
V.1.1.2. Regression Analysis
We have estimated the results both in levels and logs. Due to short space, we only show results using logs, but the results using levels are qualitatively similar. Table 3 shows the main results of the paper. It provides an estimate of θ from regression (4) for the entire population of workers in the ENE cities between 2001 and 2004. This table also includes separate regressions for specific demographic groups. The first panel of results apply to demographic groups in the population, and the second and third panels break those results down by sex. All regressions in table 3 include time-varying control variables like the share of jobs in manufacturing in the population, the share of college educated individuals in the population and the share of individuals 15-24 in the population. The estimates in table 3 provide the per cent change in the formal employment rate as a result of SP. Results for the full population are not statistically significant.
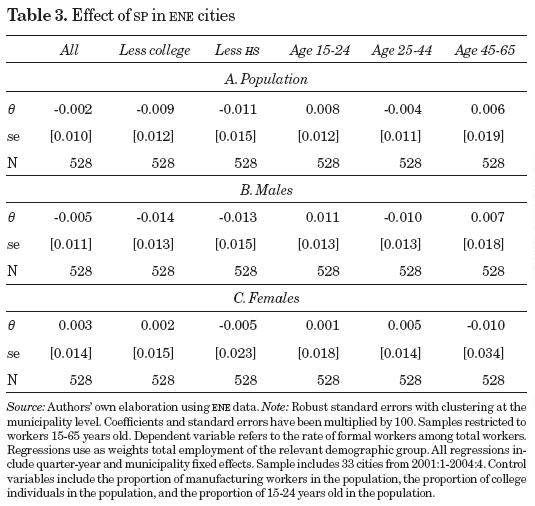
Males with less than a high school education reduce their formal employment rates among workers by 1.3 per cent on average after the introduction of the SP program. However, this effect is imprecisely estimated and again we cannot rule out a positive effect of the SP program on formal employment outcomes. Females seem to be even less affected by the SP program given the close to zero estimates across demographic groups. In sum, table 3 shows little effect of Seguro Popular on employment outcomes in large municipalities.
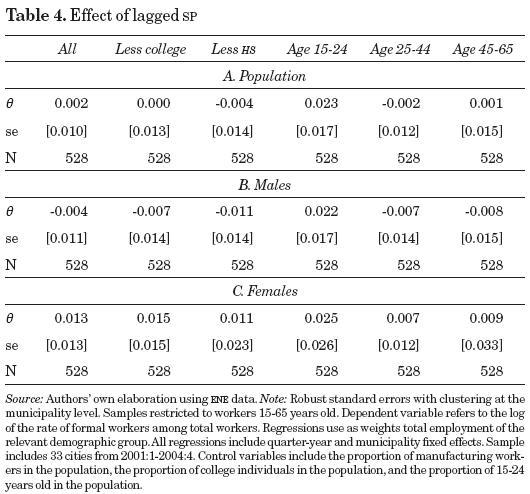
Since SP enrollment grew slowly in the early days of the program, when it was first introduced to municipalities, it is possible that potential beneficiaries needed some time to learn the rules of the program and to decide whether it was worth registering for it. In order to take this possible mechanism into account, we estimate the effect of SP on formal employment outcomes as in regression (4), but we replace the treatment variable for a one-year lagged treatment variable. In this case, the effect of SP is estimated only after an area has had the program for one year. Table 4 shows the results when the dependent variable is in logs. The results do not suggest that a lagged treatment variable affects formal employment rates. The results are comparable to those in table 3. Table 4 implies that males with less than a high school education reduced their formal employment levels by 1.1 per cent, but the effect is not statistically significant. Females' formal employment rates are not negatively affected by the introduction of the SP program. The message from tables 3 and 4 is again that there is little evidence that SP affects formal employment rates.
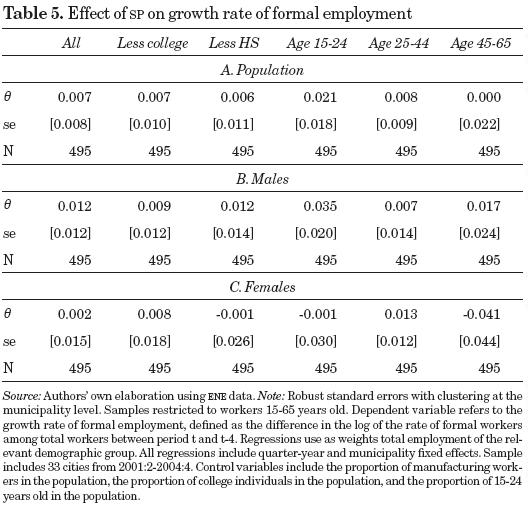
Instead of affecting the level of formality in the municipality, we hypothesize that SP may affect the growth rate of formal employment. Municipalities with SP may have different formal employment dynamics caused by this program. For example, SP may affect the mobility rate between formal and informal sectors. Table 5 includes estimates of a regression similar to Equation (4), but the dependent variable is now the difference in the log of the formal employment rate between periods t and t - 4. The table shows no evidence to support the claim that once municipalities obtain the SP program the growth rate of formal employment is lower.
Previous tables have shown the effect of SP on employment using the full sample of workers from all industries and from both the public and private sectors. It is possible, however, that the effect of SP on a worker's labor market decisions will depend on the industry in which he is employed. For example, the introduction of a social assistance program may have no effect on workers in government jobs (which are in the formal sector), since those jobs offer many other advantages to employees. Therefore, if the majority of formal employment in a city is in the public sector, the introduction of SP may have little or no effect on the size of the formal sector in that city. By the same token, it is possible that employment in agriculture includes an important seasonal component and, as agricultural workers are mostly informal workers, the previous estimates including agricultural workers can be noisier than the true ones. We estimated Equation (4) in which the dependent variable is in logs, but those employed in the agricultural and government sectors are excluded from the sample of workers. The results are almost identical to the results provided in table 3. We further restrict the sample to salaried workers excluding government and agricultural workers, and confirm that the results do not change.
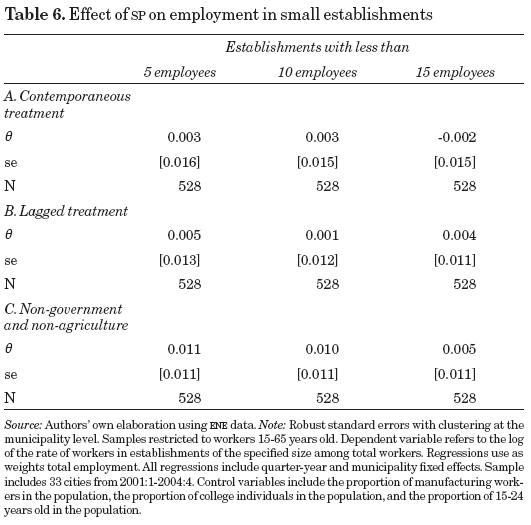
Since informal sector workers are more likely to be employed in smaller firms, either for reasons of evasion of enforcement or due to the limited capacity of informal firms to grow, we also investigate whether SP increases employment in small firms. We re-estimate regression (4) but change the dependent variable to the log of the proportion of workers employed in establishments of specific size. We estimate regressions for employment in establishments with less than 5, 10 and 15 employees. Table 6 shows the results using the contemporaneous treatment variable (Panel A) as in table 3, and the lagged treatment variable (Panel B) as in table 4; the bottom part of the table (Panel C) includes the estimation using the sample of workers excluding government and agriculture workers. Although all estimates are positive as predicted, the results are closer to zero than those estimated by the previous regressions, and imply that SP is not related to formal employment rates. For example, Panel C indicates that SP increases employment in establishments with less than five employees by 1.1 per cent, but the result is not statistically significant.
V.1.2. 2004-2006 period
As shown in figure 1, Seguro Popular expanded substantially after 2004. This is the end of the ENE data set, and it is possible that we do not find any effect of SP with the ENE data because program take-up is small before 2005. Therefore, in order to check for possible effects of SP after 2004 we use the ENOE data to look for correlations between the increase in the share of take-up of SP between 2005 and 2006, and the increase or decrease in the share of formal employment over the same time period. The ENOE data are obtained through the Mexican statistical office website, and we were able to obtain the aggregate proportion of workers by gender in the formal sector across metropolitan areas for the period 2005-2006. In this subsection we provide suggestive evidence that SP is not correlated with formal employment rates even for the period of high-enrollment of SP, 2005-2006. We cannot implement the same analysis as before because the aggregate data are only given by gender, so we lack the trends in formality rates for more specific demographic groups.
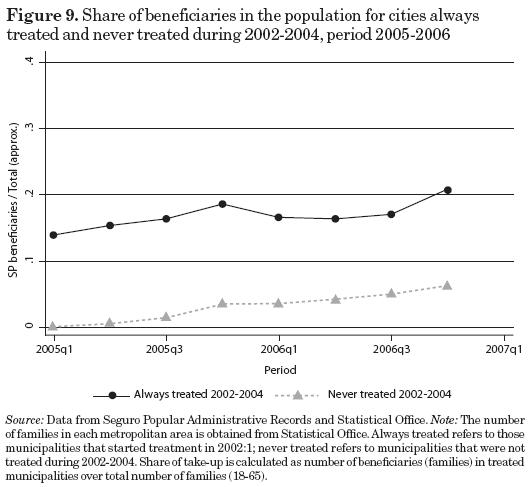
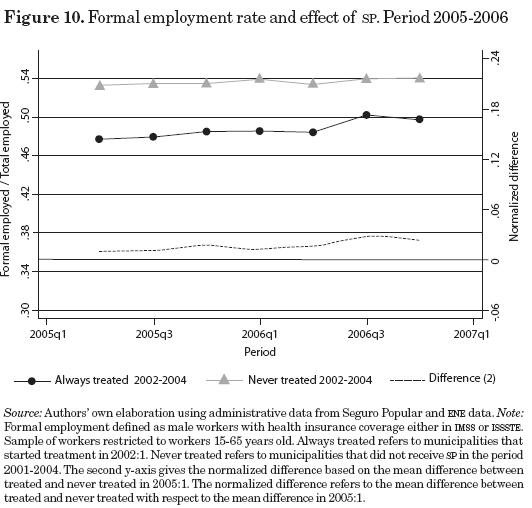
We first analyze the trends in formal employment in cities that started treatment in 2002 and those cities that were not given the program during the 2002-2004 period. The approximate share of beneficiaries among the population in these two groups is given by figure 9. Cities that started the treatment in 2002 do have a larger proportion of beneficiaries in their population than the cities that started treatment in 2005. However, the cities that started treatment after the first quarter of 2005 did see the proportion of beneficiaries in their population increase at a rate similar to that of the first group of cities. Figure 10 shows the trends in formality rates among males in these two groups of cities. The figure also includes the difference in formality rates between the two groups of cities, normalized to the difference in the first quarter of 2005. The figure does not reflect any effect of SP on formality trends.
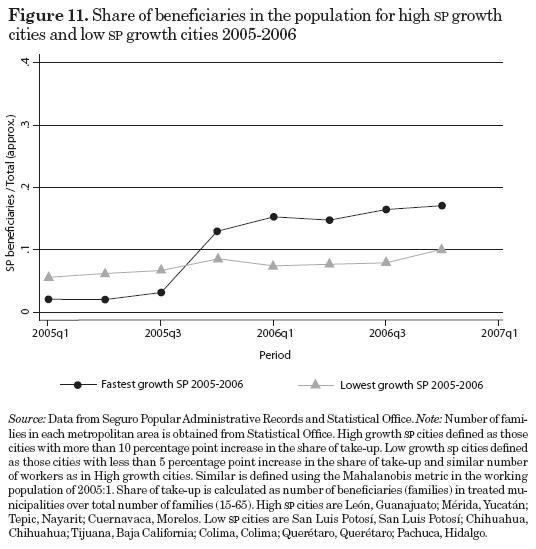
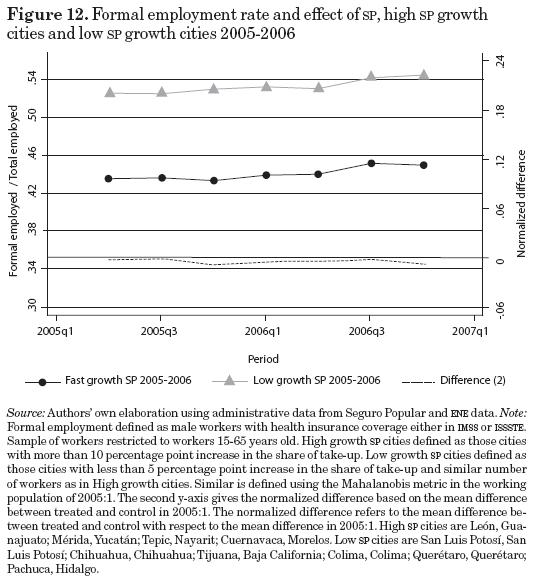
The problem with figure 10 is that both groups of cities are getting the treatment at the same rate. In order to analyze the impact of SP we divide the sample in two groups: cities with large increases in the share of SP beneficiaries in the population (defined as those with an increase larger than 10 percentage points between the first quarter of 2005 and the fourth quarter of2006), and cities with small increases in the share of SP beneficiaries in the population (defined as those with an increase of less than 5 percentage points between the first quarter of2005 and the fourth quarter of2006). As most of our cities in the sample are in the latter group, we select the cities which are similar in terms of total employment in the first quarter of 2005 to the cities with the largest increases in the share of beneficiaries. We use a simple Mahalanobis metric to accomplish that goal.18 Figure 11 shows the evolution of the share of beneficiaries in the population across these two groups. It is noticeable that there is a substantial increase in the share of beneficiaries in the fourth quarter of the year 2005. During the 2005-2006 period the share of beneficiaries increased approximately 18 percentage points in the cities with the highest growth of SP, while the increase was only approximately 3 percentage points in the cities with the lowest growth of SP. These substantial increases in the number of beneficiaries were not reflected in substantial changes in formality rates, as figure 12 indicates. Even though the fourth quarter of 2005 sees a drop in formal employment at the same time as an increase in the share of beneficiaries, this apparent negative effect rapidly vanishes, suggesting that the effect of SP on formality rates is close to zero.
Finally, figures 13 and 14 relate the change in formality rates across cities with the share of SP beneficiaries in the population in those cities. Figure 13 compares the log change in formality rates with the change in the share of beneficiaries across cities between the first quarter of 2005 and the fourth quarter of 2006. The figure includes a simple linear fit of this relationship. The graph indicates zero correlation between formality and SP. Figure 14 uses the share of beneficiaries in the fourth quarter of 2006 as its x-axis, instead of the change in the share of beneficiaries. If SP negatively affects formal employment, then we expect that the cities with the largest take-up of SP will have lower changes in formal employment. Figure 14 indicates that the share of beneficiaries is not negatively related to the log change in formality rates.19
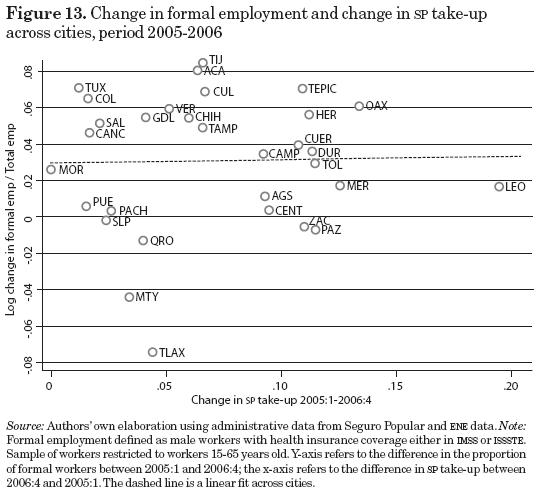
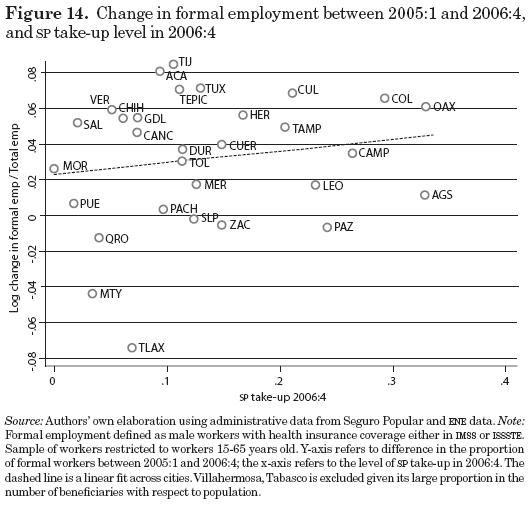
Figures 10-14 (11, 12, 13) indicate that there is little to no correlation between the introduction of Seguro Popular and municipality-level shares of formal employment, at least for our sample of large municipalities between 2002 and 2004, and suggestively through 2006. In order to further test the effects of Seguro Popular, we now turn to the individual level Encelurb data to find whether we can detect an effect of Seguro Popular on an individual's decision to work in the formal sector of the labor market for a sample of cities less developed than ENE cities.
V.2. Individual level
In order to determine whether there is a relationship between access to the Seguro Popular program and an individual's decision to work in the formal sector, we use the individual level Encelurb data to estimate Equation (5) using 2259 observations. We find that formal sector workers in municipalities given access to SP are 0.08 percentage points more likely to switch to the informal sector, although the standard errors are large (3.34) and we cannot rule out a larger effect on formal sector employment.20 There appears to be no significant relationship between SP and switching from formal to informal sector work, although standard errors are large.
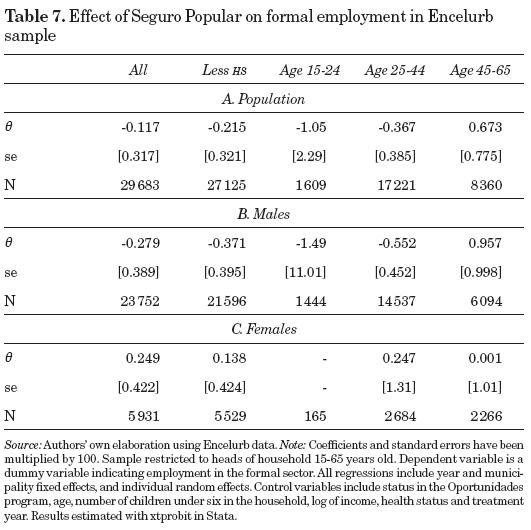
We also estimate Equation (6) to reproduce the aggregate level results at the individual level.21 We use the information of the head of the household. The coefficients and their standard errors are given in table 7, and are multiplied by 100 as above. These coefficients can be interpreted as a percentage point change in the likelihood of an individual being formally employed once Seguro Popular is introduced into their region. As with the previous tables, analysis of the full sample is given in Panel A, and Panels B and C limit the sample to males and females, respectively. Column 1 shows the estimated effects for the full sample, while subsequent columns show results for those with less than a high school education, those aged 15 to 24, those aged 25 to 44, and those aged 45 to 65.22 Control variables and time invariant city level effects are included in the regressions, along with random individual level effects.23 The results in table 7 are consistent with those given in table 3. The demographic groups most likely to be affected by Seguro Popular, males with less than a high school education and young males, show negative effects. However, the standard errors are large. Females do not show any negative effect, consistent with the employment surveys.
VI. Conclusions
In this paper we look for evidence of a link between the introduction of Mexico's Seguro Popular social assistance program and a movement of workers out of the formal sector and into informal employment. With data from 2001 (before the start of the program) until 2004, and suggestive evidence for later periods, we do not find that the introduction of SP into an area significantly decreases formal employment. While we cannot rule out decreases in formal employment of up to 1 to 2 per cent for some demographic groups, the estimated coefficients are on the order of half of a per cent or less and insignificant (except in a few cases where the coefficients are positive). These estimated effects are small when compared to the continued decline of formal sector employment in all of the cities studied during the 2001 to 2005 period, even those that did not receive treatment.
If the model given in section II is valid, we must consider why we do not see the predicted effect of SP on employment. One consideration is low take-up among treated municipalities in the 2001-2004 period. Municipalities that started the program in 2002 only had, on average, approximately 10 per cent coverage at the family level by the end of 2004. Since, however, the program was targeted to the lowest income quintile of the population in its first few years, and approximately 50 per cent of the population is uninsured (and thus eligible for the program), these 10 per cent of families are likely the constituency the Mexican government was trying to serve most. In that way, our analysis is representative of the intended effects of the program. If this is true, then it is likely that SP provides little to no incentive for the lowest income workers to leave or avoid employment in the formal sector. Since the largest increase in the coverage of SP was after 2004, which is the end of both the ENE and Encelurb data, a continuation of our analysis after 2004 with the ENOE would be the best way to provide more information about the full effect of SP.
Another possible explanation for our lack of findings is that the cities in Mexico (or at least in our sample) that received early access to SP have experienced different employment trends than the cities that did not. If this is true, it is possible that we would have seen an increase in formal employment in these cities if it weren't for the presence of SP. The analysis of employment trends in section V.1 attempts to show that this is not the case. Nevertheless, the analysis focuses only on a small sample of cities. The final, and most likely, explanation for our results is that, while Seguro Popular is valuable for those with no means of insuring against health care shocks, it is not valued over the benefits and social status which accrue to formal sector workers. Additionally, it is possible that marginal workers do not have the luxury to consider benefits and choose between sectors. Given the existing high mobility between sectors and decreasing employment in the formal sector overall, many workers may be moving in and out of the formal sector for reasons larger than health insurance. For this reason, we believe that future research needs to address the role of social protection policies as a whole, not only health insurance policies as the one analyzed in this paper, in order to understand the impact of those policies on formal employment outcomes.
In the end, regardless of the reason, we must conclude that Mexico's Seguro Popular program has not caused workers to move out of formal sector employment, at least in the initial period of the program and in large municipalities. As the Seguro Popular program continues to grow, researchers should continue to study its employment effects, and those of other social assistance programs. However, the findings of this paper should lead us to question the belief that Latin America's social assistance programs are responsible for the rise of informality in the region in a significant way, and lead us to investigate other, more likely, causes.
References
Ardington, C., A. Case and V. Hosegood (2007), "Labor Supply Responses to Large Social Transfers: Longitudinal Evidence from South Africa", NBER Working Papers, 13442, National Bureau of Economic Research. [ Links ]
Aterido, R., M. Hallward-Driemeier and C. Pages (2011), "Does Expanding Health Insurance beyond Formal-sector Workers Encourage Informality? Measuring the Impact of Mexico's Seguro Popular", Policy Research Working Papers 5785, The World Bank. [ Links ]
Autor, D. H., J. J. Donohue and S. J. Schwab (2006), "The Costs of Wrongful-Discharge Laws", The Review of Economics and Statistics, 88 (2), pp. 211-231. [ Links ]
Azuara, O. and I. Marinescu (2011), "Informality and the Expansion of Social Protection Programs", Working Paper, MPRA Paper 35073, Munich, University Library of Munich. [ Links ]
Baeza, C. C. and T. G. Packard (2006), Beyond Survival: Protecting Households from Health Shocks in Latin America, Stanford University Press. [ Links ]
Barros, R. (2008), "Wealthier but Not Much Healthier: Effects of a Health Insurance Program for the Poor in Mexico", mimeo, Stanford University. [ Links ]
Bertrand, M., E. Duflo and S. Mullainathan (2004), "How Much Should We Trust Differences-in-Differences Estimates?", The Quarterly Journal of Economics, 119 (1), pp. 249-275. [ Links ]
Bosch, M. and R. Campos-Vazquez (2010), "The Trade-offs of Social Assistance Programs in the Labor Market: The Case of the 'Seguro Popular' Program in Mexico", Working Paper DT-2010-12, El Colegio de México, Centro de Estudios Económicos. [ Links ]
Esquivel, G. and J. L. Ordaz-Diaz (2008), "¿Es la politica social causa de la informalidad en Mexico?", Ensayos, XXXVII (1), pp. 1-32. [ Links ]
Gakidou, E., R. Lozano, E. Gonzalez-Pier, J. Abbott-Klafter, J. Barofsky, C. Bryson-Cahn, D. M. Feehan, D. K. Lee, H. Hernandez-Llamas and C. J. Murray (2007), "Assessing the Effect of the 2001-2006 Mexican Health Reform: An Interim Report Card", The Lancet, 368 (9550), pp. 1920-1935. [ Links ]
Galiani, S. and F. Weinschelbaum (2007), "Modeling Informality Formally: Households and Firms", Working Papers, 0047, CEDLAS, Universidad Nacional de La Plata. [ Links ]
Gasparini, L., F. Haimovich and S. Olivieri (2007), "Labor Informality Effects of a Poverty-Alleviation Program", Working Papers, 0053, CEDLAS, Universidad Nacional de La Plata. [ Links ]
Hagstrom, P. (1998), "The Food Stamp Participation and Labor Supply of economía mexicana nueva época, vol. XXII, núm. 2, segundo semestre de 2013 Married Couples: An Empirical Analysis of Joint Decisions", Journal of Human Resources, 31 (2), pp. 383-403. [ Links ]
Hoynes, H. W. (1996), "Welfare Transfers in Two-Parent Families: Labor Supply and Welfare Participation under AFDC-UP", Econométrica, 64 (2), pp. 295-332. [ Links ]
Knaul, F. M. and Julio Frenk (2005), "Health Insurance In Mexico: Achieving Universal Coverage Through Structural Reform", Health Affairs, 24 (6), pp. 1467-1476. [ Links ]
Knaul, F. M., H. Arreola-Ornelas, O. Mendez-Carniado, C. Bryson-Cahn, J. Barofsky, R.Maguire, M. Miranda and S. Sesma (2006), "Evidence is Good for Your Health System: Policy Reform to Remedy Catastrophic and Impoverishing Health Spending in Mexico", The Lancet, 368 (9549), pp. 1828-1841. [ Links ]
Levy, S. (2007), "Can Social Programs Reduce Productivity and Growth?", Working Paper, Eight Global Development Conference: Global Development Network. [ Links ]
---------- (2008), Good Intentions, Bad Outcomes: Social Policy, Informality and Economic Growth in Mexico, Brookings Institution Press. [ Links ]
Lloyd-Sherlock, P.(2006), "When Social Health Insurance Goes Wrong: Lessons from Argentina and Mexico", Social Policy and Administration, 40 (4), pp. 353-368. [ Links ]
Maloney, W. F. (2002), "Distortion and Protection in the Mexican Labor Market", Working Paper, Center for Research on Economic Development and Policy Reform, Stanford University. [ Links ]
---------- (2004), "Informality Revisited", World Development, 32 (7), pp. 1159-1178. [ Links ]
Moffitt, R. A. (2002), "Welfare Programs and Labor Supply", in A. J. Auerbach and M. Feldstein (eds.), Handbook of Public Economics, Elsevier, pp. 2393-2430. [ Links ]
Perry, G. E., W. F. Maloney, O. S. Arias, P. Fajnzylber, A. D. Mason and J. Saavedra-Chanduvi (2007), Informality: Exit and Exclusion, World Bank Publications. [ Links ]
Secretaría de Salud (2004), Información para la rendición de cuentas, Secretaría de Salud, Mexico. [ Links ]
Wagstaff, A. (2007), "Social Health Insurance Reexamined", World Bank Policy Research Working Paper, 4111, World Bank. [ Links ]
World Health Organization (WHO) (2000), The World Health Report 2000. Health Systems: Improving Performance, World Health Organization, Geneva. [ Links ]
1 For example, Baeza and Packard (2006) mention: "Setting the correct participation incentives for self-employed and informal workers has proven extremely difficult. Their incomes are unobservable, their participation is entirely voluntary, and they have access to free health services from public providers. Why pay when good medical care can be had for free? [...] The best but hardest way would be delinking by gradually reducing and eventually replacing payroll tax-financing with financing from general tax revenue" (p. 10). Wagstaff (2007) mentions: "[Social Health Insurance] thus contributes potentially to growing informality of the economy, with all the negative connotations, including a reduction in the government's ability to raise taxes" (p. 19). Levy (2007) mentions: "This book does claim that Mexico's social policy [...] contributes to informality and that informality, aside from thwarting the government's social goals, diminishes the country's economic potential, to the detriment of all [...] My point in this book is that [social protection programs] generate, de facto, a perverse incentive structure that works against the long-run interests of workers, particularly low-income workers, and that the contribution of those programs to reducing income inequality is weak" (p. 289). Finally, Perry et al. (2007) mention: "The main challenge relates to the fact that expanded social assistance programs provided freely (and sometimes provided conditionally on working in the informal rather than the formal sector) may themselves be creating disincentives to the formalization of the workforce who are taxed via payroll contributions to gain the right to social security benefit" (p. 197).
2 While many social assistance programs are in existence in Latin America, such as Oportunidades and Seguro Popular in Mexico, Jefes de Hogares in Argentina, Régimen Subsidiado in Colombia, and Bolsa Escola in Brazil, there have been few empirical studies of their labor market effects. One exception is the Argentinean program, Jefes de Hogares, which provided a cash payment for unemployed household heads with children in school (Gasparini et al., 2007). Gasparini and co-authors found that the program was associated with a large and significant drop in the likelihood of finding formal sector employment. Formal sector employment among program participants was up to 5 percentage points less than that of similar workers who were not in the program. While this evidence is suggestive, it is hardly conclusive. For example, the Jefes de Hogares program was a cash transfer program (similar to TANF or AFDC), while many other programs in LDCs provide in-kind transfers, which often have weaker labor market effects than cash transfers (Moffitt, 2002). On the other hand, Esquivel and Ordaz-Diaz (2008) conclude that the effect of social policies in Mexico on formal employment outcomes is null.
3 For reasons explained in the data section, we cannot use the long panel of cities from 2001-2006 because the labor force survey changed in 2005. We use aggregate data across large metropolitan areas published in the Statistical Office website instead, in order to analyze formal employment outcomes during the 2005-2006 period.
4 Social security benefits also include life insurance, disability pensions, work-risk pensions, retirement pensions, sports and cultural facilities, day care, and housing loans. Not all of these benefits were available as early as 1943.
5 Depending on the model, costs associated with entering the formal sector could be due to rationing of formal sector jobs, or inherent technological differences between sectors, among other explanations.
6 Municipality is used here as a translation of the Spanish word municipio. Aggregate data uses metropolitan areas (one or more municipios) and individual data uses municipalities (one municipio).
7 The Statistical Office (INEGI) does not provide homogeneous series of employment for the period 2000-2007. They provide a measure of unemployment rate for that period and claim to use a weighting factor in order to compare trends between the periods 2000-2004 and 2005-2007. We were not provided with the weighting factor, and as a consequence we have been unable to use a homogeneous series of formal or informal employment for the period 2000-2007.
8 SP was implemented in Mexico City after 2004, but it was implemented in the State of Mexico and Mexico City's metropolitan area since early 2002. As we only observe metropolitan areas, we decided to exclude Mexico City from the analysis. This decision does not affect the final results.
9 In 2002, the initial year of Seguro Popular, all beneficiaries deemed eligible for the program were enrolled by administrators. Starting in 2003, beneficiaries had to voluntarily reregister for the program, causing some cities to lose all beneficiaries between 2002 and 2003. Appendix figure A1 includes the evolution of the share of beneficiaries for each city in the final sample.
10 Take-up is measured as the number of families enrolled divided by the number of households with workers.
11 We chose to look data from the fourth quarter of 2002 in the ENE sample because the 2002 Encelurb data was taken in the third and fourth quarters of that year.
12 IMSS covers workers from the private sector and ISSSTE covers workers from the public sector.
13 In unpublished regressions we experiment with this measure of informality. The final results presented in the paper are not affected by this classification.
14 There are two metropolitan areas with less than five families registered in Seguro Popular. We take this information as measurement error and assume that the true number is zero. We explore the sensitivity of this definition below. It is possible that individuals do not know the benefits of the program immediately but with a lag.
15 The regression is  where T is a dummy variable indicating whether the municipality got the treatment in period Tmt-j(for example, T4 represents whether municipalities got the treatment four periods from today - period 2001:1). Robust standard errors with clustering at the municipality level.
16 Treatment cities with the largest increases are: Aguascalientes, Campeche, Colima, Oaxaca, Villahermosa. Control cities are: Durango, Morelia, Veracruz and Tepic. Control cities were selected on a simple Mahalanobis metric according to employment in 2001. Control cities were restricted to the sample of no treatment during 2002-2004.
17 Villahermosa shows a strong increase in take-up between 2002 and 2004. By the end of year 2004, the share of beneficiaries in the population was close to 50 per cent. When we exclude Villahermosa from the calculations, results are similar to figure 8.
18 High growth SP cities are León, Guanajuato; Mérida, Yucatán; Tepic, Nayarit; Cuernavaca, Morelos. Low growth SP cities are San Luis Potosí, San Luis Potosí; Chihuahua, Chihuahua; Tijuana, Baja California; Colima, Colima; Querétaro, Querétaro; Pachuca, Hidalgo.
19 We experiment with the relationship in levels, and the results are similar. We also experiment with differences in employment rates between similar quarters (instead of differencing quarter 4 with quarter 1) to avoid different seasonal effects across cities, but results are similar, and we chose to present figures for the longest possible period of time.
20 Sample restricted to individuals 15-65 years old who were employed in the formal sector in 2002.
21 In Stata, we use the command xtprobit with random effects.
22 No results were shown for those with less than a college education, since this description applied to nearly the full sample.
23 The same analysis was performed for all individuals at the household level, not only the head (not reported). As expected, the results are similar; however, the results using only the head of the household are slightly more negative. We also estimated equation (7) using linear probability models, and the results do not change.

