


 text new page (beta)
 English (pdf)
 Article in xml format
 Article references
 Send this article by e-mail
 Cited by SciELO
  Similars in
SciELO
Similars in
SciELO 
 Permalink
Introduction
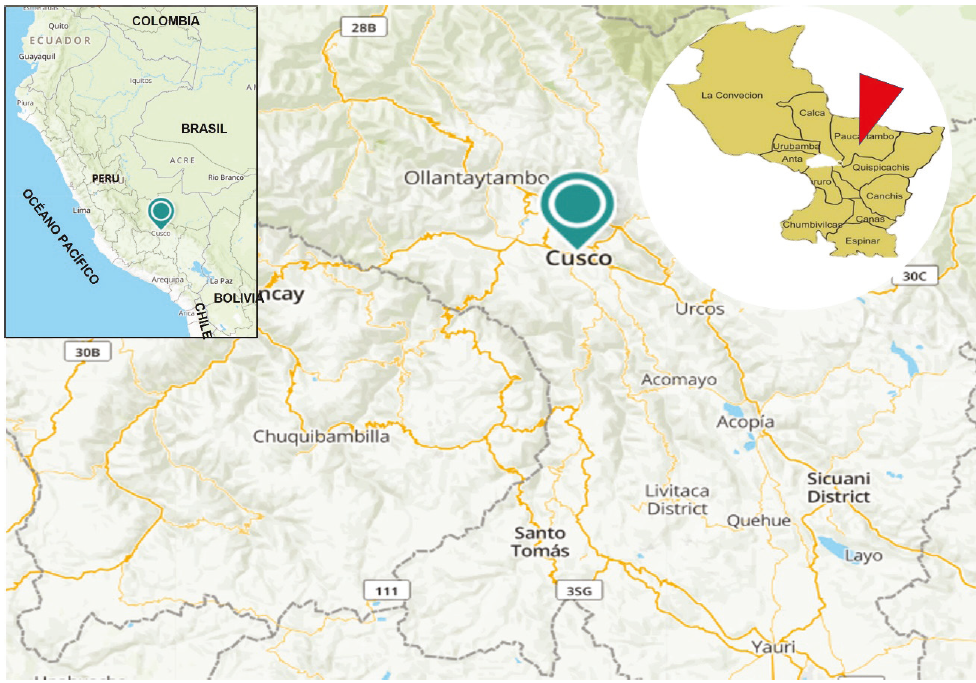
The Qero's Gold company is located in the province of Paucartambo in the Cusco-Peru region, it is part of the Eastern Cordillera where mountain ranges originate, also known as quartz veins, veins in shear zones, as well as mesothermal and orogenic deposits (Audebaud, 1973); their main feature is their small volume which results in a high grade of gold (up to 8 g/T). The deposit is of the orogenic type with massive volcanogenic sulfide (SMV) type mantles, the mineralized fluids were removed by the deformations produced by the orogeny and these in turn contributed to the formation of blanket-shaped orebody; the quartz veins belong to a subsequent stage of emplacement on shear zones that were produced by emplacements of hypo-abyssal igneous rocks of the Triassic Permian (Vargas & Hipólito, 1998). In this region, orogenic deposits are exploited informally by locals as a source of income; however, lack of knowledge of the geology, geometallurgy and metallurgical extraction processes adequate to each mineral leads to deficiencies in their methods of exploitation and recovery. An alternative to these problems is mineralogical and metallurgical studies (Henley, 1989), this has proven to be an excellent precedent for the development of unit operations and establishes a process in stages of concentration which optimizes the recovery of disseminated gold in gold ores accompanied by sulfides.
For the processing of minerals, the concentration by gravimetry and flotation of minerals is a practice developed extensively for free gold minerals and some mineralogical associations (Fullam et al., 2016); the performance of this concentration method depends on the degree of release directly related to the form, size, composition, composites, surface and chemical conditions such as collectors (xanthates, dithiophosphates, mercaptanbenzoates, amines, etc.), foaming agents (MIBC, Aeroflot, dowfroth 250, etc.), activators (copper sulfate, zinc sulfate, etc.), depressants (lime, cyanide, guar gum, etc.), pH modifiers (acids, carbonates, lime) and others (Allan & Woodcock, 2001). For the gold mineral dissolution process, the most widespread practice is the use of cyanide in alkaline media; despite increasingly strict environmental regulations, it remains a viable alternative due to its ease of use and low cost, in addition to being one of the most studied leaching agents for different types of minerals (Marsden & House, 2006); however, some minerals are difficult to treat with this reagent, which are considered refractory to the cyanidation process, that is, under normal conditions, recoveries greater than 50 % are not possible.
This work seeks to determine a metallurgical process for the recovery of gold based on the mineragraphy of the mineral from the Qero's Gold mine, where the metallurgical process shows variable recoveries because there is no characterization of the mineral and the mineralogical associations present, for so the use of the polarized light microscope has an essential effect for the determination of free gold and gold present in the quartz-pyrite matrix. The Scanning Electron Microscope (SEM) allows the identification and verification of the presence of gold in a solid solution and the associations with sulfides or submicroscopic minerals with gold companies. Finally, the results presented in this work show the performance of mineragraphy in the gold recovery process, mineragraphy characterization in conjunction with the metallurgical tests of grinding, gravimetric concentration, flotation, and cyanidation, allows obtaining applicable information for the optimization of metallurgical tests.
Experimental materials and procedures
Non-probabilistic sampling of an intentional or criterial type is carried out for the mineral, and samples of the head, concentrate and tails are selected for chemical analysis by inductively coupled plasma optical emission spectroscopy (ICP-OES). The mineragraphic analysis (microscopic and macroscopic) and metallurgical tests laboratory level was carried out for studying the texture, mineralogical associations and particle size.
For size reduction, a jaw crusher and ball mill were used. For concentration, a flotation cell and centrifugal concentrator (Falcon F-140); for agitation leaching in bottles, and characterization in a scanning electron microscope (microscope of polarized light and X-ray diffractometer). In the description of the minerals, quartz (Qz), pyrite (py), goethite (goe), gold (Au), sulfosalts (sul), chalcopyrite (cpy), hematite (he) are identified, electrum (el), arsenopyrite (apy) and others of lower concentration considered gangue (GGs).
Grindibility tests were performed in a standard 6.5'' x 9'' laboratory ball mill at 66.7 % solids designed to evaluate material grinding, mineral sample was prepared at 100 % -m10 (8") to determine the grinding time necessary to obtain granulometry of 65 % -m 200 and 85 % -m 200; the products obtained were granulometry analyzed to determine the curve of grindibility at different times (15, 20, 25 and 30 min), shake leaching in bottles at pH 11 with 30 % solids and 1000 ppm cyanide (CN-) prepared from NaCN, the rougher flotation at 32 % solids with a particle size of 65 % and 85 % -200 m (74 µm), the operating parameters used are summarized in Table 1. In addition, copper sulphate (CuSO4) was used as sulfide activating agent, A-404 (dithiophosphate-mercaptobenzothiazole) as a primary collector for the flotation of the auriferous pyrite in acidic and neutral circuits, Z-11 (sodium isopropyl xanthate) as a secondary collector of a selective feature that is used to combine the collecting and activating power, as well as MIBC (methyl isobutyl carbinol) as a foaming agent used in the flotation process.
Table 1 Operational parameters for laboratory tests
| Tests | Operating parameters | |
|---|---|---|
| Gravimetric concentration |
Sample weight |
10 kg |
| Granulometry |
65 % -200 m (74 µm) |
|
| Feed flow |
1800 cm3/min |
|
| Gravity force |
98 G |
|
| Water pressure |
1.5 PSI | |
| Rougher flotation |
Sample weight |
1000 g |
| % Solids |
32 |
|
| Granulometry |
85 % -200 m (74 µm) |
|
| Cell volume | 3000 cm3 | |
For the cyanidation tests (Table 2), the cyanide dosage for the mineral was considered from the milling, and the second test milling and cyanidation (direct cyanidation) at a particle size of 13.2 and 4.9 %, respectively, 1 Kg sample with 1000 ppm cyanide concentration at pH 11 and 72 hours of stirring, the pH values and cyanide concentration were set to avoid the formation of HCN, which is harmful to the process and to the environment.
Table 2 Operational parameters cyanidation tests in cyanidation tests (direct and from milling), 1 Kg of mineral, 1000 ppm CN-, pH 11, and 72 hours of agitation
| Granulometry | |
|---|---|
| Direct cyanidation |
13.2 % -200 m (74 µm) |
| Cyanidation from grinding |
4.9 % -200 m (74 µm) |
For the selection tests, the following stages are determined: griding, gravimetric concentration-flotation and cyanide leaching; grinding-leaching (direct leaching) and leaching from griding according to the species of minerals found and gold release.
Results and discussion
Mineralization
The mineral comes from the Inkaracay, and Mina Sanca 2 veins of the gold deposit located in the Paucartambo province of Cusco-Peru, belonging to the Qero's Gold mining company (Figure 1).
The Inkaracay vein (Figure 2a) presents an outcrop of approximately 130 m and 15 to 20 cm power, with a depth that reaches 60 cm. The assembly presents quartz (SiO2, Qz), pyrite (FeS2, Py), calcium carbonate (CaCO3, Ca), and gold (Au) represented by Qz-Py-Ca-Au, carbonates as well as coarse and fine gold are observed in the pyrite microfractures and disseminated gold in quartz with an average grade of 20 g/T; the Mina Sanca 2 vein (Figure 2b) presents an outcrop greater than 350 m, with an average power of 17 cm, and a depth that reaches 34 cm, the assembly shows quartz, pyrite, calcium carbonate, and Au (Qz- Py-Ca-Au), thick gold is appreciated in the form of native gold trapped inside a gray quartz matrix, they also appear in the form of leaves when in contact with quartz and slate, fine gold is shown as filler in pyrite microfractures with an average grade of 45 g/T.
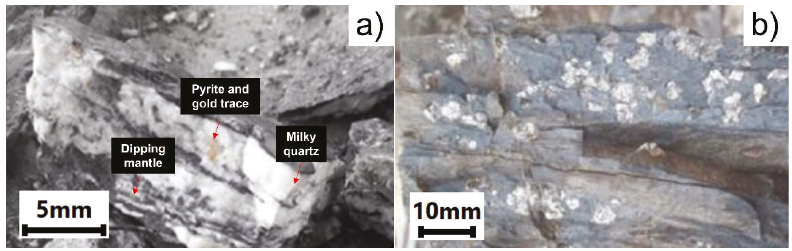
Figure 2 a) Inkaracay Vein with gold dissemination (dipping mantle, pyrite, and gold trace) and b) Mina Sanca 2 Vein
In the stockwork zone are the Inkaracay and Mina Sanca 2 veins (Figure 3a and 3b, respectively), corresponding to a mineralized structure with the presence of several families of milky quartz veinlets; the predominant veins have a SE-NW direction, the rock assemblage is of the Qz-Py-Apy-Au-Ag type which presents high mineral pyritization encapsulated between quartz and pyrite, some veins exceed 250 g/T, and are thus exploited in a global area of approximately 1,000 m2 with a grade of 8 g/T having proven mineralization of 40,000 T at 15 m depth and potential mineralization of 120 m in depth.

Mineralogical analysis
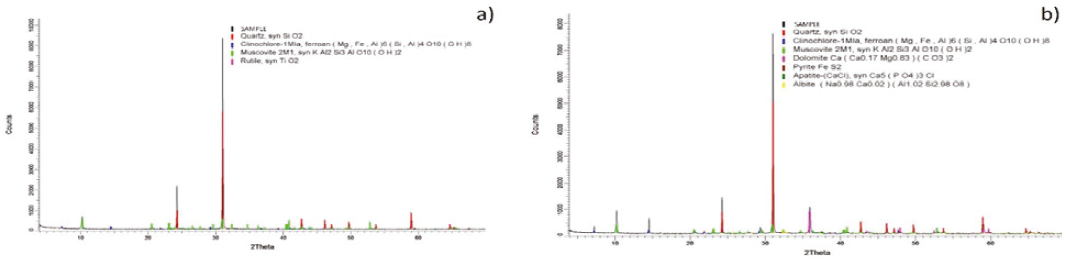
X-ray diffraction analysis of the two samples shows that the main composition in the Inkaracay vein (Figure 4a) is quartz (SiO2), muscovite (KAl2Si3AlO10(OH)2), and dolomite (CaMg(CO3)2) with minor composition, in the Mina Sanca 2 Vein (Figure 4b) it presents quartz (SiO2), muscovite (KAl2Si3Al O10(OH)2) and rutile (TiO2) to a lesser extent.
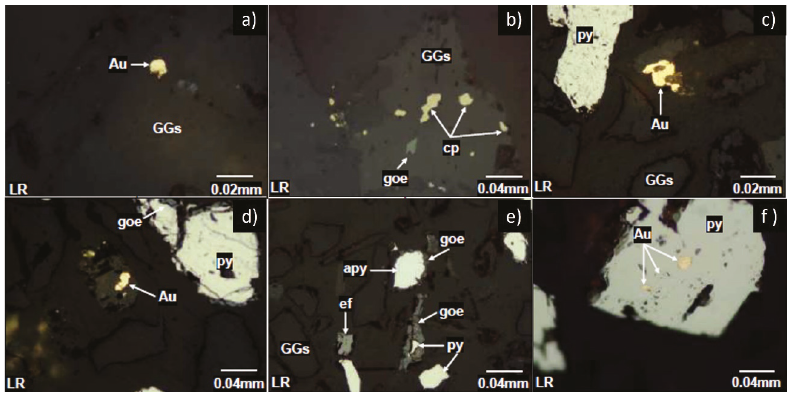
The mineralogical analysis of the Inkaracay vein (Table 3) was carried out at different granulometry +100 (149 µm), +200 (74 µm), and -200 m mesh by microscope of polarized light to determine the degree of release of the mineral. It can see mixed binary gold grain (Au) and gangues (GGs) at +100 m mesh (Figure 5a), ternary mixed grain of chalcopyrite (py), goethite (goe), and gangues (GGs) at +100 m mesh (Figure 5b), native gold free grain (Au) and pyrite (py) mesh +200 m (Figure 5c), a free particle of native gold (Au), mixed grain of pyrite (py) and goethite (goe) mesh + 200 m (Figure 5d), mixed binary grains of arsenopyrite (apy) with goethite (goe) and pyrite (py) with goethite (goe), free grains of sphalerite (ef) and pyrite (py) in a fine mesh of -200 m (Figure 5e), a mixed particle of native gold (Au) with pyrite (py) showing occlusion of the gold in a pyrite matrix at a fine mesh of -200 m (Figure 5f).
Table 3 Mineralogical analysis of the Inkaracay and Mina Sanca 2 at different granulometry
| Sample | Mesh | Species | Figure |
|---|---|---|---|
| Inkaracay | 100 | gold-gangue | 5a |
| chalcopyrite-goethite-gangue | 5b | ||
| 200 | gold | 5c and 5d | |
| pyrite | 5c and 5d | ||
| goethite | 5d | ||
| gangue | 5c and 5d | ||
| -200 | arsenopyrite-goethite | 5e | |
| pyrite-goethite | 5e | ||
| sphalerite | 5e | ||
| gangue | 5e and 5f | ||
| pyrite | 5e | ||
| gold-pyrite | 5f | ||
| Mina Sanca 2 | 100 | gold-gangue | 6a |
| pyrite-goethite | 6b | ||
| 200 | gold-goethite | 6c and 6d | |
| gangue | 6c | ||
| -200 | Native gold | 6e | |
| gangue | 6e and 6f | ||
| pyrite-goethite-hematite | 6f |
The mineralogical analysis for the Mina Sanca 2 Vein (Table 3), in Figure 6a, at a granulometry of +100 m, a binary mixed grain of non-metallic gangs and native gold (GGs-Au) can be seen, in Figure 6b at a mesh +100 m mixed grains binaries of pyrite and goethite (py-goe), for Figure 6c, in a granulometry of +200 m, free grains of non-metallic gangue minerals (GGs), mixed binary grain of gold and goethite (goe/Au) can be appreciated.
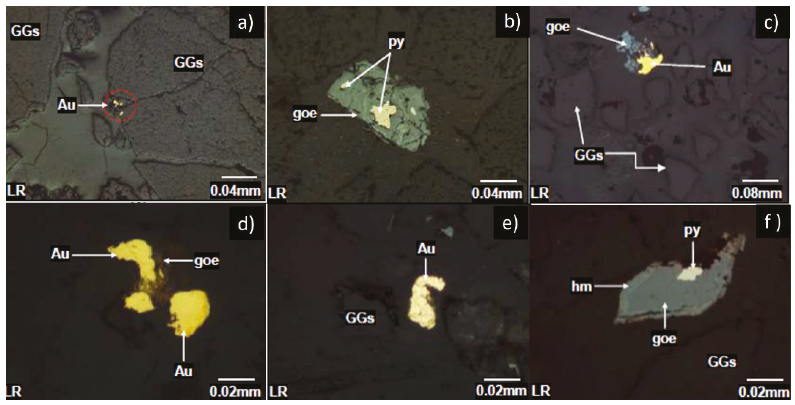
Figure 6 Mina Sanca 2 vein microphotographs at +100 m (6a, 6b), + 200 m (6c, 6d) and -200 m (6e, 6f) mesh
At +200 mesh observe mixed binary grains of goethite and gold (goe/Au, Figure 6d); it can be seen that the finer the mineral (-200 m), the higher the degree of liberation, the gold is seen separated from the gangue free grains of native gold (Au, Figure 6e), finally it can be observed that at a -200 m there is the presence of mixed ternary grains of pyrite (py), hematite (hm) and goethite (goe) and free non-metallic gangue particles (GGs) in Figure 6f.
Metallurgical study
Table 4 shows the percentage composition in the mixture (blending) of the samples coded as 1, 2, and 3, used to analyze grindability, gravimetric concentration, rougher flotation, and leaching. The proposed scheme is in accordance with the operating conditions of the processing plant and quartz content (SiO2) which could generate additional charges in operating and energy costs in the size reduction area.
Table 4 Coding, the weight of the samples and percentage of mixture
| Items | Sample 1 | Sample 2 | Sample 3 | |||
|---|---|---|---|---|---|---|
| Weight (Kg) |
Composition (%) | Weight (Kg) |
Composition (%) | Weight (Kg) |
Composition (%) | |
| Inkaracay vein | 28 | 63.64 | 18 | 36 | 28 | 49.12 |
| Mina Sanca 2 vein | 16 | 36.36 | 32 | 64 | 29 | 50.88 |
Table 5 presents the chemical analysis (Au, Ag, As, and S) and organic analysis (mineral coal) of the mixtures codified in the previous section (sample 1, 2, and 3) and represents the head of the mineral for the metallurgical grinding tests, gravimetric concentration, leaching, and flotation.
Table 5 Head chemical analysis of mixtures and organic carbon in shale rock
| Samples | |||
|---|---|---|---|
| Sample 1 | Sample 2 | Sample 3 | |
| Au (g/t) | 0.17 | 2.91 | 1.96 |
| Ag (g/t) | < 0.5 | < 0.5 | < 0.5 |
| As (%) | 4.16 | 3.46 | 5.06 |
| S (%) | 0.99 | 1.67 | 1.05 |
| Total Carbon (%) | 0.83 | 1.29 | 0.76 |
| Organic Carbon (%) | 0.28 | 0.13 | 0.41 |
The sulfur content is related to sulfide minerals such as pyrite, chalcopyrite, arsenopyrite, galena, and sphalerite (Table 5). Therefore, its presence will be discussed concerning the species present.
A) Grindability
From the grinding tests, the longer the residence time in the mill, the finer granulometry is obtained (Figure 7a and 7b); for example, for sample 1 at 16.4 min, there is a P80 of 110 µm and with a longer residence time. The P80 decreases to 65 µm, unlike sample 2, significant variability in the granulometric curve concerning time is appreciated. At the P80, to achieve a granulometry of 100 µm, a time greater than 31.20 min at 65 % -200 m must also be reached at 43.60 min; it achieves 68 µm in 85 % -200 m.
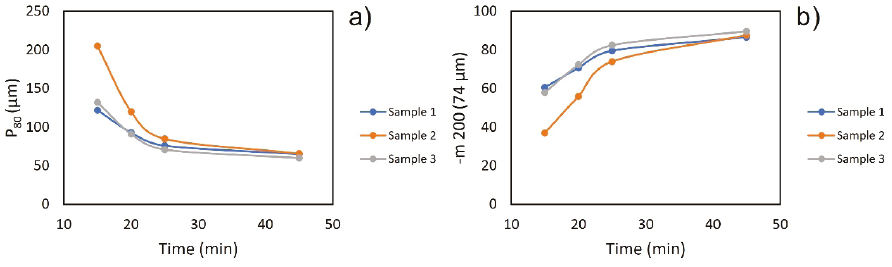
Sample 3 shows similar behavior to sample 1, because for 17.50 min, 115 µm is obtained at 65 % -200 m and 85 % -200 m to 27.60 min. An average of 19.37 min was determined to obtain a P80 of 100 microns, which is the optimal granulometry for the metallurgical processes selected with our type of mineral, for the flotation tests, and worked as a granulometry 85 % -200 m to evaluate the effect of particle size in all tests.
B) Gravimetric concentration
With this concentration test, it is possible to recover 49.19 and 13.40 % for gold and silver respectively. Sample 2 (Table 6), and Figure 8 show the photomicrograph obtained from the concentrate obtained. For sample 3, recovery of 58.61 and 14.63 % of gold and silver respectively (Table 7), the low degree of recovery is related to the occlusion of gold within the pyrite as shown in (Figure 5f), and the encapsulation in the gangue (Figure 6a). On the other hand, sample 1 was not considered in this test due to the low concentration of gold (0.16 g/T).
Table 6 Gravimetric concentration, Sample 2
| Weight | Grade | Recovery (%) | |||
|---|---|---|---|---|---|
| (%) | (g/T) | ||||
| Au | Ag | Au | Ag | ||
| Concentrate | 1.19 | 89.78 | 7 | 49.19 | 13.4 |
| Tailings | 98.81 | 1.09 | 0.5 | 50.81 | 86.6 |
| Head calculated | 100 | 2.15 | 0.58 | 100 | 100 |
| Head tested | 2.92 | <0.50 | |||

Table 7 Gravimetric concentration, Sample 3
| Weight (%) |
Grade (g/T) |
Recovery (%) | |||
|---|---|---|---|---|---|
| Au | Ag | Au | Ag | ||
| Concentrate | 1.19 | 132 | 7.7 | 58.61 | 14.63 |
| Tailings | 98.81 | 1.1 | 0.5 | 41.39 | 85.37 |
| Head Calculated | 100 | 2.66 | 0.59 | 100 | 100 |
| Head Tested | 1.95 | <0.50 | |||
Figure 9a shows the presence of oxidized pyrite with the presence of oxides such as hematite and goethite. In Figure 9b, arsenopyrite is present that causes problems in concentration; according to Figure 5, the release of this type of species depends on the size of particle obtained in the milling.

Table 8, presents a summary of the species found in the concentrate of sample 2 that has a higher content of gold (89.78 g/T) in the head, where there is a higher content of quartz (63 %), followed by pyrite and arsenopyrite (18 and 5 % respectively), a low amount of gold is recovery from the presence of gold as electrum at 0.1 %; the tailings obtained go to the next stage of concentration by flotation.
C) Rougher flotation
Table 9 presents the recovery of gold and silver as elements of interest and arsenic and iron as harmful elements to evaluate the process. For sample 1 by flotation, 87.90 and 16.36 % recovery of gold and silver are obtained respectively in the concentrate for a gold head grade of 0.24 g/T, and less than 0.5 g/T of silver with a granulometry of 85 % -200 m pH of 7.7 this pH value prevents the flotation of pyrite instead of gold (Mu et al., 2020), CuSO4 acts as a pyrite depressant in the conditioning stage, in addition the collectors A-404 and Z-11 are used in conditioning and flotation as well as in foaming the MIBC, this procedure is repeated for samples 2 and 3.
Table 9 Flotation metallurgical balance, Sample 1
| Weight (%) |
grade (g/T) |
(%) |
Recovery (%) | ||||||
|---|---|---|---|---|---|---|---|---|---|
| Au | Ag | As | Fe | Au | Ag | As | Fe | ||
| Concentrate | 10.9 | 1.78 | 0.8 | 1.1 | 10.91 | 87.9 | 16.36 | 78.86 | 27.45 |
| Tailings | 89.1 | 0.03 | <0.50 | 0.04 | 3.53 | 12.1 | 83.64 | 21.14 | 72.55 |
| Head Calculated | 100 | 0.22 | 0.53 | 0.15 | 4.33 | 100 | 100 | 100 | 100 |
| Head Tested | 0.24 | <0.50 | 0.15 | 4.15 | |||||
Table 10 shows a recovery of 95.54 and 50.74 % of gold and silver recovery, respectively, with a grade in sample 2 of 2.91 g/T and less than 0.50 g/T for gold and silver. The presence of arsenic in this sample is of 0.87 and 26.98 % of the iron in the concentrate. This behavior is related to the higher content of arsenic species in the form of arsenopyrite (Figure 9).
Table 10 Flotation metallurgical balance, Sample 2
| Weight (%) |
grade (g/T) |
(%) |
Recovery (%) | ||||||
|---|---|---|---|---|---|---|---|---|---|
| Au | Ag | As | Fe | Au | Ag | As | Fe | ||
| Concentrate | 5.14 | 57.3 | 9.5 | 0.87 | 26.98 | 95.54 | 50.74 | 88.75 | 39.23 |
| Tailings | 94.86 | 0.15 | <0.50 | 0.01 | 2.27 | 4.46 | 49.26 | 11.25 | 60.77 |
| Head Calculated | 100 | 3.08 | 0.96 | 0.05 | 3.54 | 100 | 100 | 100 | 100 |
| Head Tested | 2.91 | <0.50 | 0.06 | 3.47 | |||||
Table 11 presents the results obtained with sample 3; this has an intermediate recovery compared to samples 1 and 2 (90.43 and 29.44 %) for the recovery of gold and silver, respectively with a gold grade of 1.96 g/T and less than 0.50 g/T for gold and silver respectively with a mixture in similar compositions of the two veins tested (49.12 % of the Inkaracay vein and 50.88 % of the Mina Sanca 2 vein).
Table 11 Flotation metallurgical balance, Sample 3
| Weight (%) |
grade (g/T) |
(%) |
Recovery (%) | ||||||
|---|---|---|---|---|---|---|---|---|---|
| Au | Ag | As | Fe | Au | Ag | As | Fe | ||
| Concentrate | 10.93 | 16.78 | 1.7 | 0.93 | 10.63 | 90.43 | 29.44 | 88.39 | 22.96 |
| Tailings | 89.07 | 0.22 | <0.50 | 0.02 | 4.38 | 9.57 | 70.56 | 11.61 | 77.04 |
| Head Calculated | 100 | 2.03 | 0.63 | 0.12 | 5.06 | 100 | 100 | 100 | 100 |
| Head Tested | 1.96 | <0.50 | 0.12 | 5.06 | |||||
For the three samples presented, the gold recovery was high with 87.9, 90.43, and 95.54 % for samples 1, 3, and 2 respectively. Arsenic and iron are closely linked to gold recovery because their recovery is more significant, 78 % for As and 22 % Fe, respectively; this behavior is related to the presence of arsenopyrite; it is essential to mention that arsenopyrite has a collateral effect on the flotation due to hydrophobicity tends to float with valuable minerals despite depression with sodium aluminum silicate so the concentrates obtained went through the grinding, amalgamation, and retort process for the final recovery of gold.
D) Leaching tests
The objective of this test is to evaluate the behavior and metallurgical response of sample 1 (63.64 and 36.36 % of the Inkaracay and Mina Sanca 2 veins, respectively), pH natural=6.5 was measured by shaking the sample in water for 24 h. To maintain process leaching stability the pH is controlled with lime, small amounts were added, it was stirred for two hours, then the pH value is measured, and this is continued until reaching the cyanidation pH equal to 11.
Figure 10 shows the percentage of recovery of gold and silver with respect to a time of 72 hours when the cyanide is dosed from the milling and the direct leaching of the mineral; despite these conditions, it shows a low recovery of gold and silver (lower that 19 %) which is related to the preg-robbing effect which occurs in the presence of carbon (Sibrell & Miller, 1992), the sample used presents a content of 0.83 % of carbon in sample 1 (Table 4), it is also refractory to the process of leaching due to the fact that the gold is occluded in a pyrite matrix (Figure 4f), presents contents of arsenopyrite and altered arsenopyrite (Figure 9a and 9b). A similar behavior is observed if the cyanide concentration is increased to 2000 ppm CN- and some alternatives were evaluated like as use prefloat and chlorine process with less performance and elevated consumption of reagents, these results are not shown in this research work.

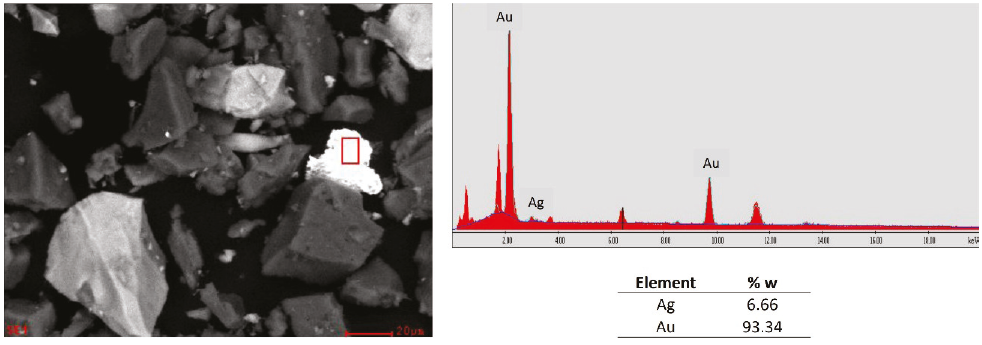
Finally, in sample 1, the presence of the gold and silver alloy was found, known as electrum, which constitutes one of the leading gold minerals present in the sample (Figure 11) and presents chemical refractoriness (Yannopoulos, 1991), the other peaks were not identified because for the matter of these analysis only gold and silver are the objective, for this type of minerals there are several methods for their treatment such as the use of cyanide alternatives such as thiosulfate (Aylmore & Muir, 2001), thiourea (Deschênes & Ghali, 1988; Li & Miller, 2006) and others (Haque, 1987). However, these agents have limited chemical stability against certain pH and potential conditions (Calla & Nava-Alonso, 2020).
Of the three samples tested, the contend in sample 1 presented has and intermediate concentration (0.83 %) and presents preg-robbing for gold, so it was not evaluated leaching test for samples 2 and 3 with contents of 1.29 and 0.76 % carbon total, respectively (Table 5).
Conclusions
The mineralized structures of the Inkaracay and Mina Sanca 2 veins are found as an intrusive formation in the Qero's batholith and the Sandia formation, and there is evidence of a metamorphic rock location superimposed on the quartz mantles within which leads to the pyritization of the valuable material (gold).
The mineragraphic characterization helps determine the presence of gangues such as carbonaceous and silica in the mineralogical body. It serves as the basis for analyzing the behavior of the metallurgical process, for example, cyanide leaching is evident with a recovery of less than 19 %; this behavior was studied according to the release of the gold as well as the refractory behavior, the presence of electrum and occluded gold in the pyrite as well as the presence of arsenopyrite were studied in the leaching process of the tested samples.
Due to collection properties, it was determined that flotation is the suitable metallurgical process for the recovery of valuable minerals: for gold, 85 % -200 mesh, working with a blending of 36 % vein mineral Inkaracay, and 64 % of Mina Sanca 2 mineral vein (sample 2), a solids percentage of 30 % and a pH of 7.7 allow obtaining 95.54 % gold and 50.74 % silver recovery.

