


 text new page (beta)
 English (pdf)
 Article in xml format
 Article references
 Send this article by e-mail
 Cited by SciELO
  Similars in
SciELO
Similars in
SciELO 
 Permalink
Introduction
Currently, photogrammetry is a technique used in obtaining digital elevation, and orthomosaic models of areas from aerial images (Mills & McLeod, 2013). Although technology has potentially evolved to improve the results of this technique using tools based on terrestrial and remote sensors such as global positioning systems (GPS), total station, detection, and range of laser images (LiDAR), the synthetic aperture radar, and unmanned aerial vehicles (UAV), among others, the use of some of these continues to represent high costs in their use (Hastaoğlu et al., 2019).
Among the instruments of high accessibility, low cost, and that allow obtaining high spatial resolution images in a simple, and flexible way, the UAV can be mentioned (Hemmelder et al., 2018); this instruments allows safeguarding the integrity of operators in dangerous environments, and have few flight restrictions (ISPRS, 2004; Shi et al., 2011; Patterson et al., 2014; Xiang & Tian, 2011).
Although UAVs have significantly increased their capacity to collect data in the field with higher density (Dering et al., 2019), it has been pointed out that the use of additional tools improves the precision of the results (Jimenez et al., 2017).
When only the camera positions are used as coordinates for the construction of the DEMs, these constructions tend to present errors in orientation of the block mainly, and open the way for there to be significant information biases. Therefore, it is recommended to add at least three or four GCPs to camera stations during processing to avoid bias because of elevations (Forlani et al., 2018).
Thus, the use of Agisoft Meta Shape software and ground control points (GCP) added to the high-quality images contribute to improving the precision of the DEM obtained (Jimenez et al., 2017).
The use of distributed ground control points (GCP), allows greater control in the plani-altimetry correction of the images, producing acceptable errors (Liew et al., 2012; Jimenez et al., 2017; Martinez et al., 2018).
The software allows data processing and the generation of final models. However, these procedures make it possible to compare the methodologies with respect to the conventional methods. The bibliographic information is still scarce, and dispersed; the topography obtained by UAV requires case studies that contribute to validate the precision that can be achieved using this instrument, and the support of control points (Jimenez et al., 2017).
Having said the above, this article describes a procedure to create a DEM and orthomosaic using a UAV and a GPS from high-resolution images contemplating eight georeferenced GCPs and corrected by the station closest to the study site.
Theoretical framework
Previous studies
Different authors have focused their work on the UAV and the GPS, due to the facilities and working conditions they provide, they also used these technologies for the development of their research such as Niethammer et al. (2012) and Luccier et al. (2013) used the UAVs to reconstruct landslides using aerial photography; Siebert & Teizer (2014), they used UAV to inspect works and supervise the emergency and disaster service. Barmpounakis et al. (2016) used UAV to monitor traffic and acquire some parameters of speed, acceleration and trajectories. Forlani et al. (2018) used UAV with RTK (Real Time Kinematic or Real Time Satellite Navigation) in the same flight plan to generate Digital Surface Models (DSM) using three different block configurations.
Similarly, GPS has stood out as a new technology due to the ease of acquiring data in the field. In this way, Llenera & Suarez (2015) analyzed the GPS data to obtain reference and time systems using different positions of the satellites. They obtained points on the surface of the earth by means of computer triangulations, altitude, longitude, and latitude.
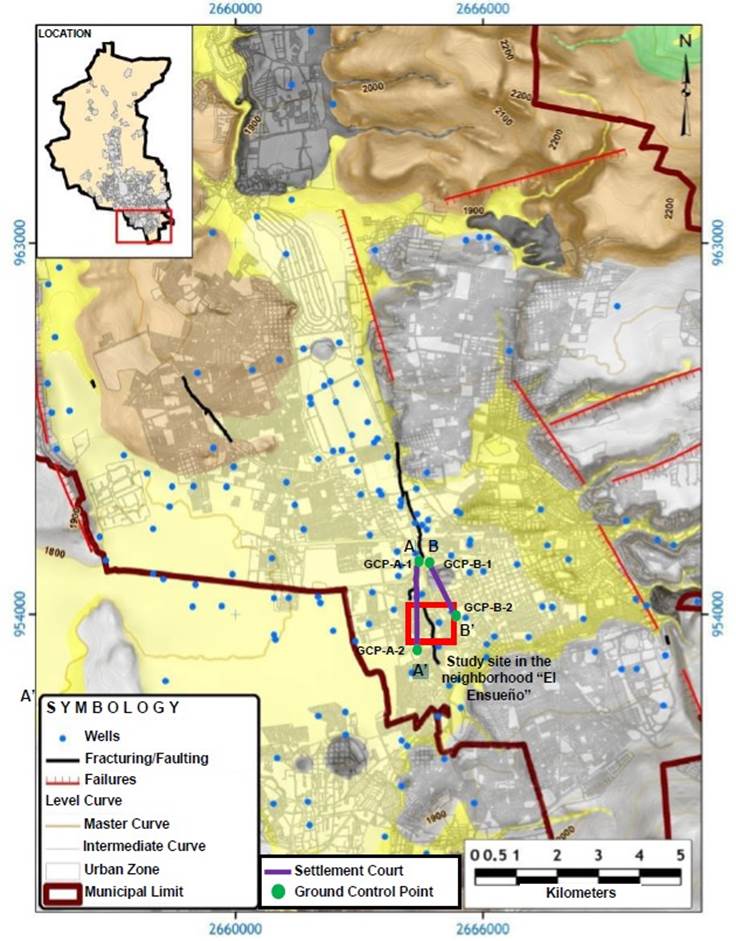
Now, referring to the study site that is proposed in this paper, some researchers have been carried out for some years where different damages caused by the existing faults in the Queretaro valley have been reported. These failures are mainly associated to the graben with shape rectangular bounded by the fault system with north-south direction and normal displacement. The western and eastern trace can be located in the San Bartolome fault and the Oriental fault (Carreón et al., 2005). Pacheco (2007) carried out a gravimetric study, using six profiles on faulting, constructing gravimetric, and gradient anomaly maps in order to characterize the phenomenon on urban areas more precisely, quickly, and easy. On the other hand, Civil Protection of Queretaro (2015) created a Risk Atlas (Figure 1) in which it registers the vulnerability, risk of subsidence, and fracturing of the subsoil according to the location of each site, considering the proximity to the faults but this Atlas has an accuracy of 50 m in some areas and it does not detect the influence area of each failure nor the new ones. This Atlas is presented herein as Figure 1.
UAV
The UAV is used to obtain aerial images in less time at different heights, while maintaining high resolution in digital photogrammetry (Colomina & Molina , 2014). The UAVs are mainly made up of two main elements: an aerial platform, equipped with a camera and a navigation system, and a remote control from which aerial activity is programmed and monitored by using a mobile device (Escalante et al., 2016). On the other hand, to determine the video recording mode for UAV, there are certain parameters such as: stabilization, location, navigation, and identification of objects (Barmpounakis et al., 2016).
The use of UAVs in Mexico is regulated by the SCT (Secretaría de Comunicaciones y Transportes, 2019), who classifies the RPAS (Remotely Piloted Aircraft System) commonly known as drones through the Official Mexican Standard NOM-107-SCT3-2019 through Table 1.
Table 1 The classification of the UAV according to their weight
| Classification of Remotely Piloted Aircraft Systems | |||
|---|---|---|---|
| Maximum takeoff weight | Use | Compliance with the Numeral of this Official Mexican Standard | |
| Equal to, or less than 2 kg | Micro RPAS | Recreational | 4.10, 4.11 y 5.1. |
| Private non-commercial or commercial | 4.10, 4.11, 5.1, 5.2 y 8* | ||
| Greater than 2 kg, and up to 25 kg | Small RPAS | Recreational | 4.10, 4.11 y 6.1. |
| Private non-commercial or commercial | 4.10, 4.11, 6.2 y 8* | ||
| Greater than 25 kg | Big RPAS | Recreational | 4.10, 4.11 y 7.1. |
| Private non-commercial or commercial | 4.10, 4.11, 7.2 y 8* | ||
*Number 8 is only applicable when special operations are required
GPS
GPS are autonomous devices because they have their own reference system and time scale using different reference systems expressing the positions of their satellites (Llenera & Suárez, 2015); however, it is necessary to have a computer network to be able to determine by triangulation, altitude, longitude and latitude of an object on the earth's surface (Cortés et al., 2010).
On the other hand, it is necessary to consider that sometimes they have measurement errors. Some of the main factors are: meteorological phenomena, the imprecision of the clocks, unforeseen electrical interferences, multi-path errors, among others (Cortés et al., 2010).
Ground Control Point (GCP)
GCP is a physical ground site, established within a coordinate system and which can be used as a guide (Cruz, 2008). The purpose of these points is to provide information for the georeference process of space objects and phenomena of interest according to the needs of each project; Liew et al. (2012), mentions that GCPs are used for rectification of aerial images in a non-parametric approach.
On the other hand, it is necessary to have a good distribution in the study area and a number of GCPs that contribute to have a better precision in photogrammetry obtained by UAV (Martínez et al., 2018).
Orthomosaics
A mosaic, according to Cheng et al. (2007) is the set of images taken from one or more cameras, through which it is possible to make an overlap between them, joining and combining them in a single image and, by expanding the range of vision of the scene. When the mosaic is corrected by the distortions generated by the relief even with the objects in it. These are called orthomosaic (Escalante et al., 2016).
Digital Elevation Model (DEM)
According to Instituto Nacional de Estadística y Geografía (INEGI, 2019) in Mexico a DEM is a visual and mathematical representation of the height values, related to the mean sea level, which makes it possible to characterize the shapes of the relief and the elements and objects present in it. DEM are frequently used in studies related to geology, the environment, engineering and architecture (Akturk & Altunel, 2018).
According to the aforementioned, there are two types of DEM: one is the Digital Surface Model (DSM) which represents all the existing or present elements on the surface of the earth (vegetation, buildings, and, infrastructure). It could be understood that it represents the elevations of the surface layer of objects on the ground and are used to interpret the shapes of the reliefs and some elements it contains. These have being useful for 3D modeling of telecommunications, urban planning and aviation, among others; and the Digital Terrain Model (DTM), through which the shape of the terrain is produced. Once all the foreign elements were removed. It represents the elevation values of the lowest points of the surface or terrain, being very useful to locate geographic elements and natural features such as rivers, ridge lines and breaks, among others (Fuentes et al., 2012).
Materials and methods
Study area
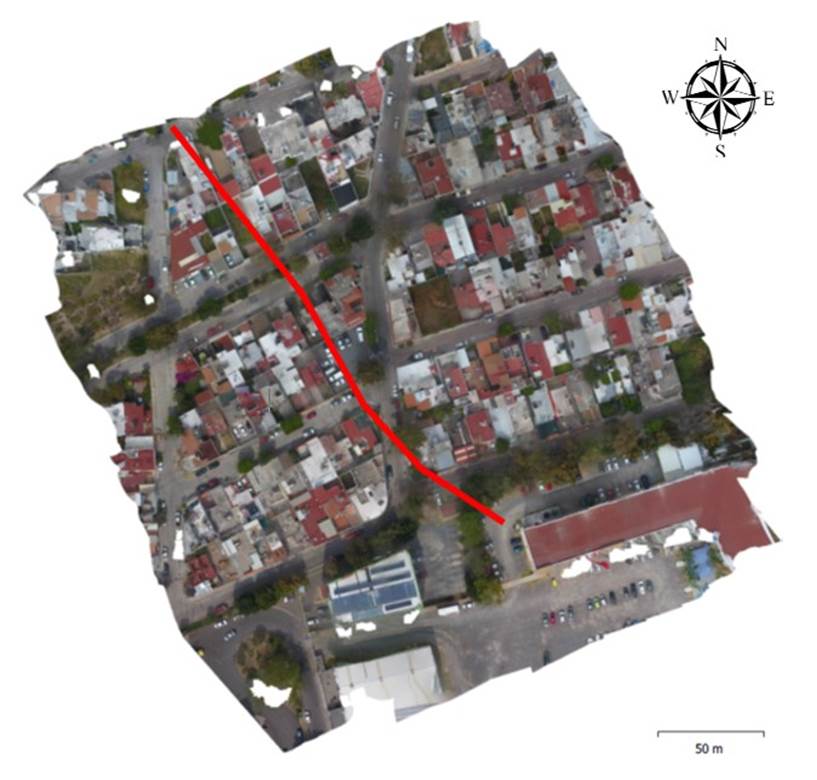
The study area is located in Santiago de Queretaro, Queretaro, Mexico (Figure 2); it presents a rugged topography due to continuous movements, since there is a fault due to subsidence, also known by other authors as a stress crack, located in the Queretaro valley, which is shown in Figure 3 and Figure 4, crossing the neighborhood of "El Ensueño".
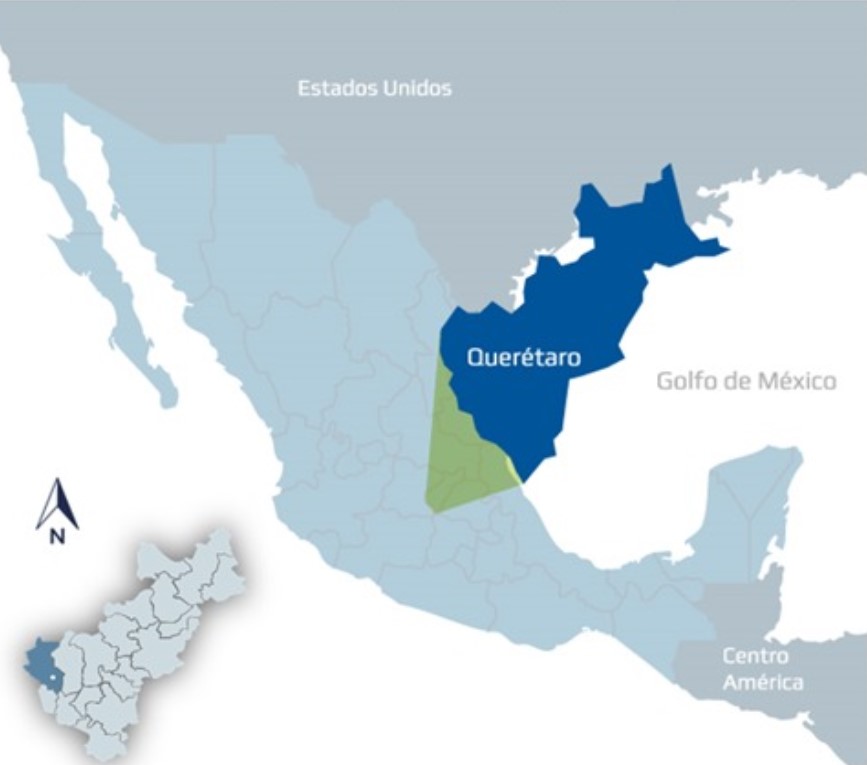
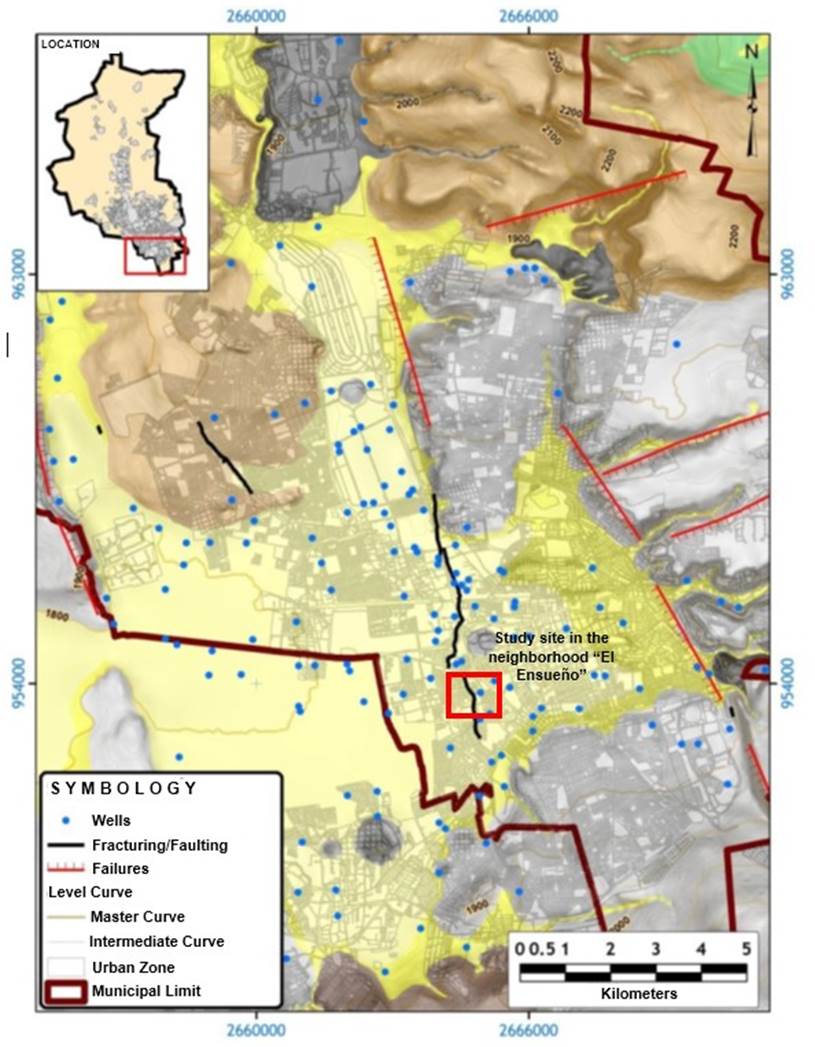
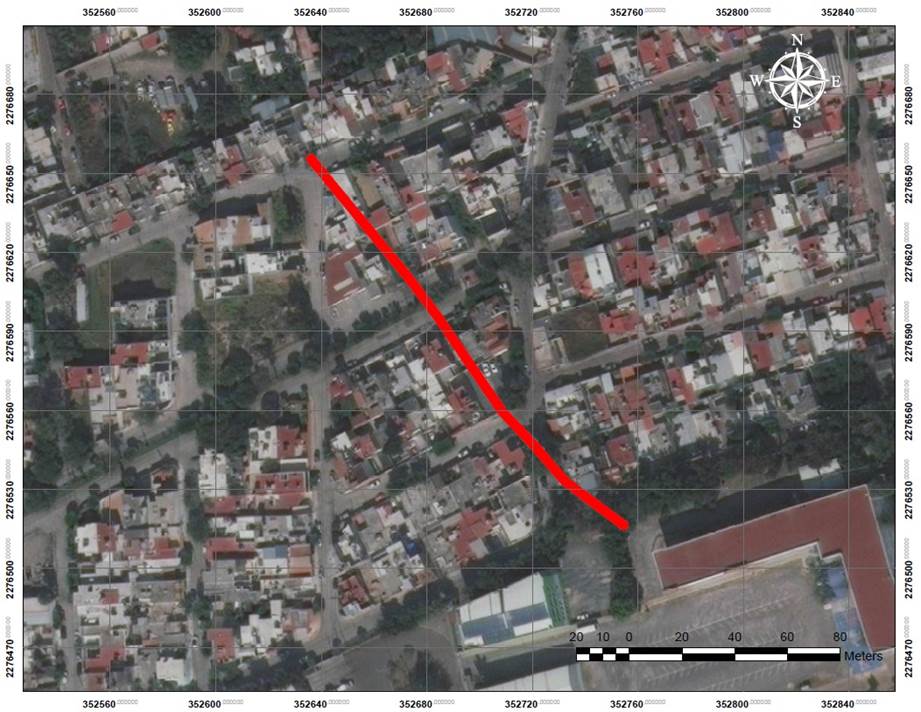
Figure 4 Micro-localization of the area of study “El Ensueño”, where the fault is shown by subsidence that crosses it
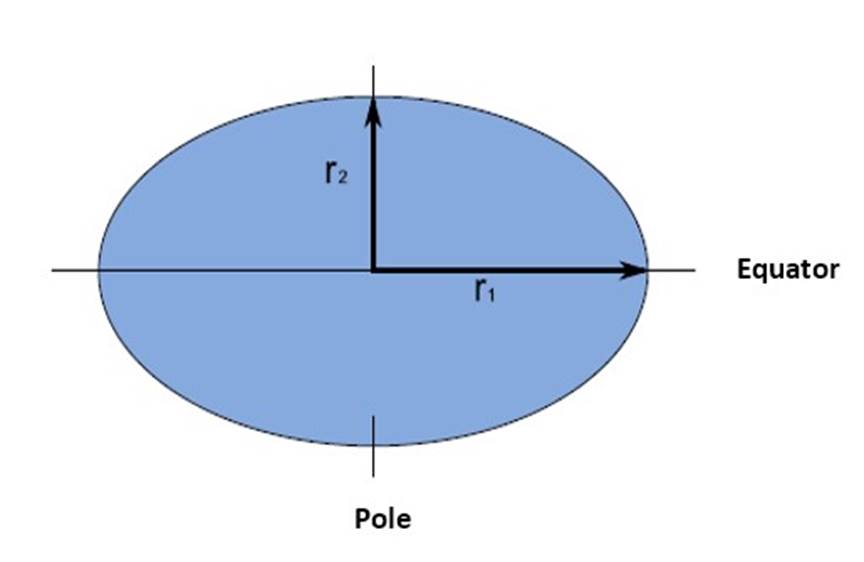
This area presents vertical displacements of between 0.20 to 0.90 centimeters with NE-SW and NW-SE orientation. One of the most affected areas is the “El Ensueño” area, which is located inside the ellipsoid (Figure 5) WGS 84 (World Geodetic System, 1984) with the parameters of semi-major axis 6378137.00 and semi-minor axis 6356752.314, and is located in the zone 14 with UTM coordinates 2276546.01 N and 352689.16 E, where an area of 18,288 m2 is considered (shown in Figure 3, inside a box).
Placements of ground control points
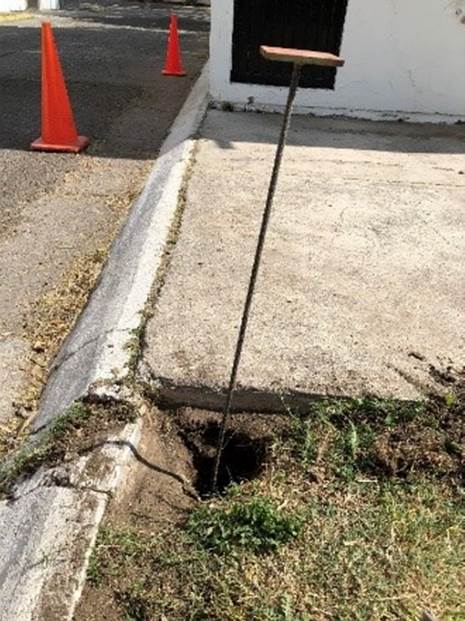
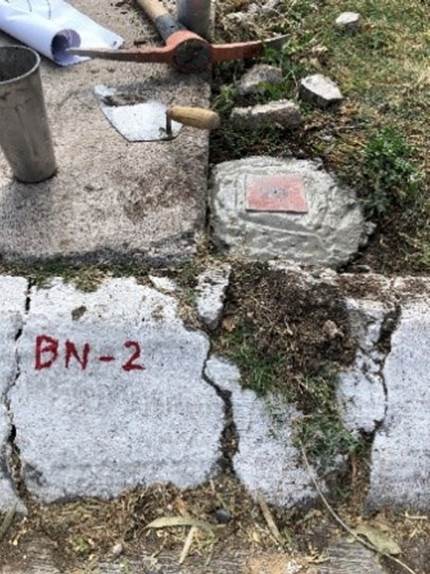
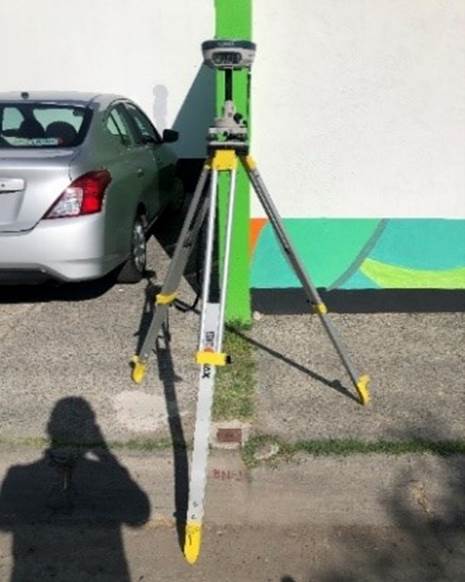
Eight GCPs were located at the study area in order to have greater control over the planimetry and altimetry correction of the images. GCPs were made up of steel plates welded to rods with an iron plate over it. This is shown in Figure 6. So, they were anchored to the ground and could be measured with a dual-frequency GPS (Figure 7).
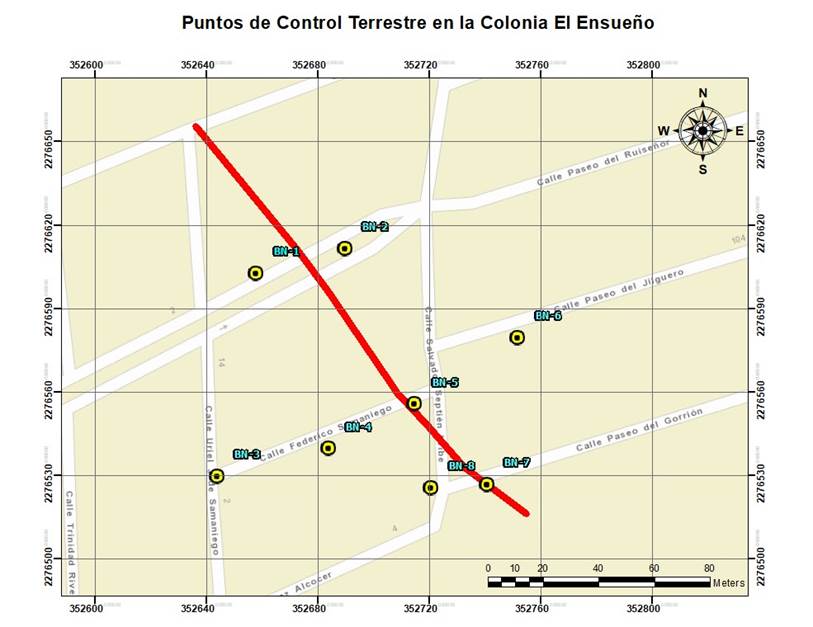
As a result of the placement of the GCPs in the “El Ensueño” neighborhood, the following location sketch of the eight GCPs used is obtained, shown in Figure 8.
Furthermore, considering that the GCPs would not be visible during the UAV flight, the use of tarps with a multi-colored target was implemented to facilitate the identification of the GCPs.
Data collection
Regarding the data collection two devices were used: a UAV DJI Phantom 4, with a 20 megapixel image sensor, a transmission range of 7 kms and autonomy of 30 m; and a Sokkia GRX2 GPS, with Magnet Field software and precision in static mode: Only: L1: H: 3mm + 0.8 ppm, V: 4mm + 1.0 ppm.
Measurement of ground control points
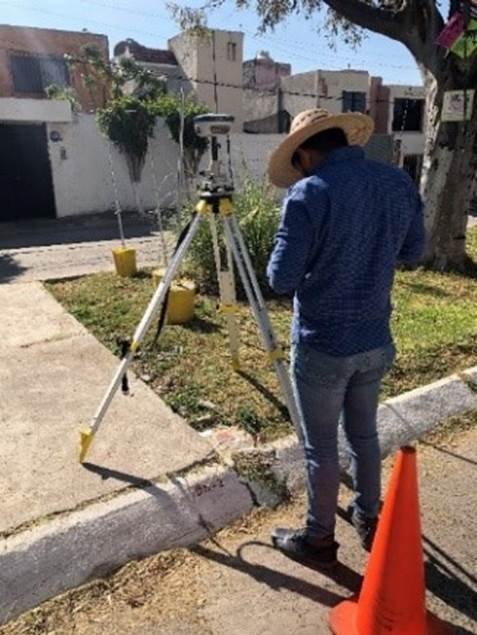
The GCPs were measured on November 21 and 22, 2019, for which the Sokkia GRX2 GPS was used in static mode (Figures 9 and 10), in each of the eight points placed at the study site. Each point was measured for one hour in order to have better data quality and more reliable precision. So, the measurement error can be reduced.
Flight planning and image acquisition
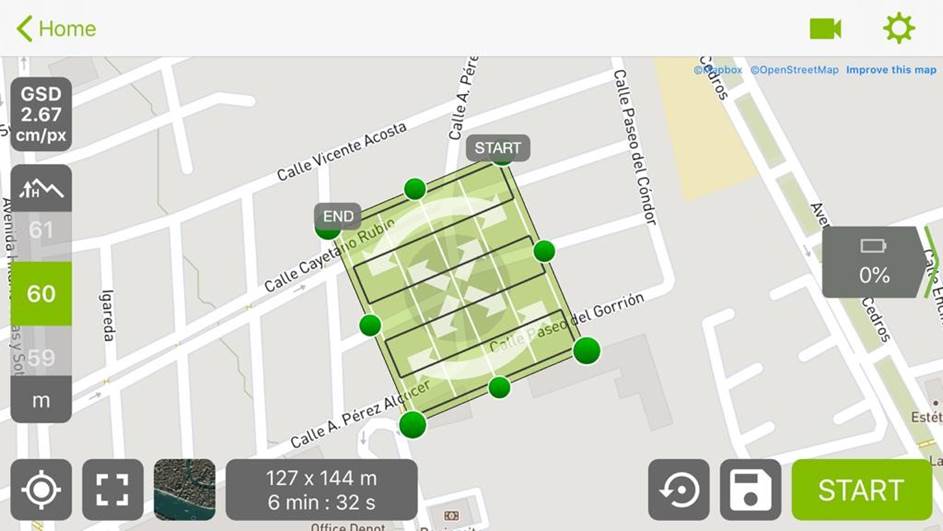
The UAV flight plan was carried out on November 26, 2019 at 12:40 pm, in a time of 6 min and 26 s, with dimensions of 127 x 144 m and an overlap of images of 80 % and 70 %, at an altitude of 60 m. The flight plan carried out by the UAV at the study site is shown in Figure 11, all through the PIX4D mobile application.
Data processing
Two software were used to process the data obtained in the field: the Topcon Tools for the processing of the data obtained by the GPS in the static method, and the Agisoft Metashape, for the processing of the images obtained by the UAV.
Ground control points
To process the eight GCPs, it was downloaded from the Geodesic Network of Mexico (RGNA) of INEGI. The measurements of the UQRO station with the coordinates UTM 2277537.296 N and 352773.121 E, using the WGS 84 ellipsoid for the post-processing of the data. This station is located in the Engineering Department of the Autonomous University of Queretaro (UAQ), which it is the active station of the State of Queretaro. These data where obtained in RINEX format. It were processed with the UNERINEX software from INEGI to join the 24 h measurements by using only those that were made on November 21 and 22, 2019. The Topcon Tools software was used in order to obtain the correction the coordinates a greater precision in them and that these are linked to the INEGI RGNA.
Images
For the processing of the images obtained by means of the UAV, the Agisoft MetaShape software was used where, firstly, the photographs obtained with the UAV were added, followed by the eight GCP obtained by means of the GPS data, and these were introduced as markers points, the coordinates obtained from the processing of the points with Topcon Tools were established, although it is worth mentioning that these points were attached manually, identifying in each photograph included in the processing, the GCP to have a minor error in the process; after that, the option of the cameras in each of the photographs was immediately unmarked, so that the coordinates for the model are those of the GCP and not those of the GPS of the UAV, because the latter has with many variations due to changes in climatic and environmental conditions, obstructions and sensors, among others.
Subsequently, the images were oriented with the coordinates obtained; as a result, the dense point cloud can be obtained, the model can be textured, the DEM and the orthomosaic can be acquired through the different integrated options that the software has.
Results
The results obtained from the processing of the data used in this article by means of GPS and UAV for obtaining DEM and orthomosaics are presented below.
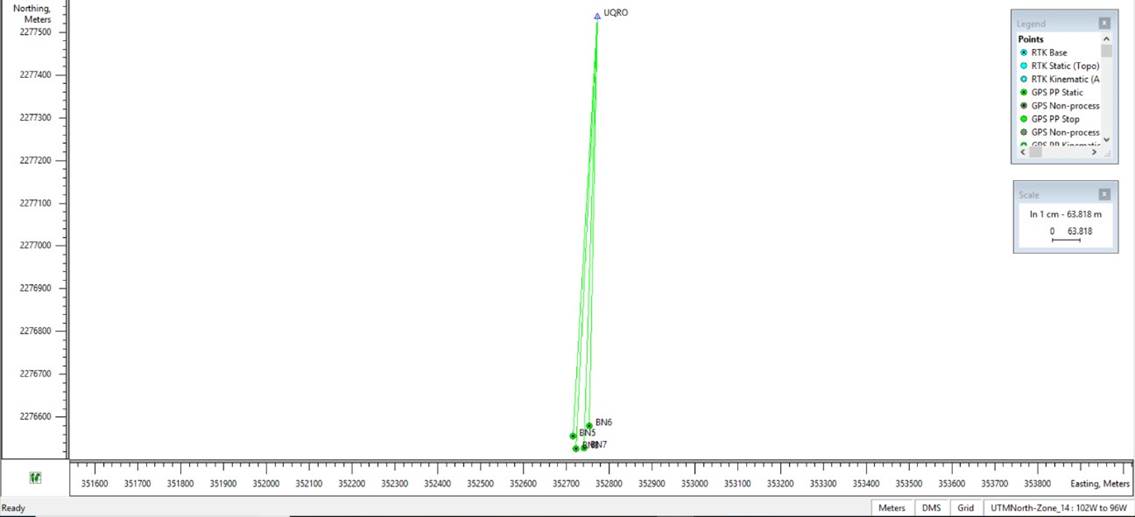
The GCPs taken by the Sokkia GRX2 GPS in static mode, processed with Topcon Tools software and georeferenced to the INEGI RGNA, are shown in Figure 12 and Figure 13. The link of the active station of Queretaro and the GCPs are shown in UTM coordinates.
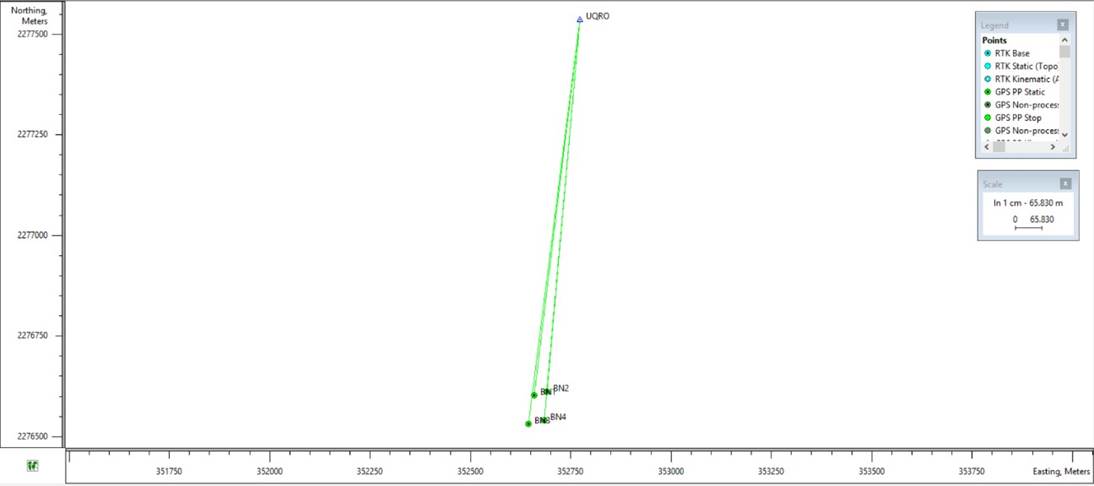
It should be noted that the processing was done separately, because the DEMO version of the software was used as it did not have the license.
As a result, the coordinates and elevations of the GCPs were obtained, such information is presented in Table 2.
Table 2 GCP coordinates and elevations obtained
| Ground Control Point (GCP) | UTM coordinates | Elevation (m) | |
|---|---|---|---|
| North | East | ||
| BN-1 | 2276603.236 | 352658.586 | 1800.060 |
| BN-2 | 2276612.125 | 352690.924 | 1801.227 |
| BN-3 | 2276530.970 | 352644.987 | 1799.863 |
| BN-4 | 2276540.403 | 352684.722 | 1800.074 |
| BN-5 | 2276556.601 | 352715.472 | 1800.889 |
| BN-6 | 2276580.706 | 352752.989 | 1801.617 |
| BN-7 | 2276527.735 | 352741.959 | 1801.108 |
| BN-8 | 2276526.363 | 352721.866 | 1800.227 |
On the other hand, the images that were obtained by the UAV were processed with the Agisoft MetaShape software, through which a dense point cloud anchored to the GCP obtained by the GPS was created for more precision of the model, finally acquiring the orthomosaic of the study site, which is shown in Figure 14.
Likewise, the estimation of the GCP errors was obtained as shown in Figure 15. The report generated by Agisoft MetaShape where each color indicates the error in Z axis represented in the color palette on the right side, which are indicated in centimeters. The size and shape of the ellipse represents the error in X and Y, these errors are considered from the GCPs who are recognized as support points according to the software nomenclature. Therefore, when the images processed were obtained during the flight. These can be affected by the different light conditions and obstacles that the captured images may present.
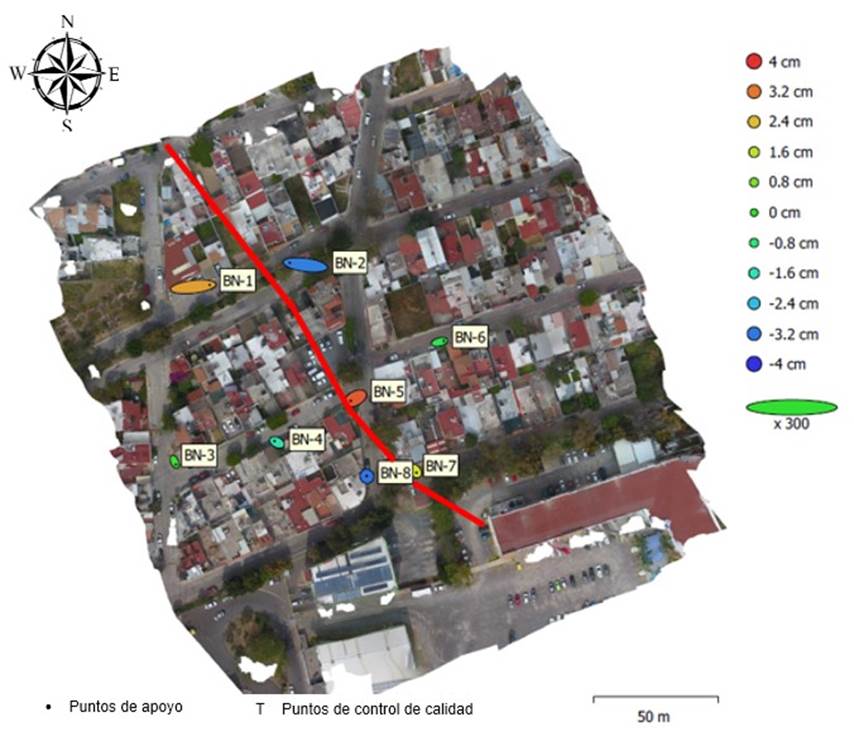
Errors were automatically obtained by the software, using the formula for the calculation of the Mean Square Error (RMSE) by considering the square error in each of the dimensions with respect to its projection on the images that are shown in the previous in Figure 15. The GCPs presented in Figure 15 are shown below in Table 3.
Table 3 GCP X-East, Y-North, Z-Altitude
| GCP | Error X (cm) | Error Y (cm) | Error Z (cm) | Total (cm) | Image (pix) |
|---|---|---|---|---|---|
| BN-1 | 4.44092 | 0.50457 | 2.74891 | 5.24718 | 0.520 (14) |
| BN-2 | -4.19617 | 0.54762 | -3.11089 | 5.25218 | 0.366 (21) |
| BN-3 | 0.33765 | -0.74040 | 0.1484 | 0.82718 | 0.111 (4) |
| BN-4 | -0.70271 | 0.35078 | -1.36845 | 1.57782 | 0.213 (16) |
| BN-5 | -1.21713 | -0.64384 | 3.52810 | 3.78727 | 0.251 (33) |
| BN-6 | 1.15467 | 0.28454 | -0.33718 | 1.23609 | 0.169 (30) |
| BN-7 | 0.42314 | -0.46419 | 1.91749 | 2.01775 | 0.343 (25) |
| BN-8 | -0.06164 | 0.09154 | -3.24125 | 3.24313 | 0.359 (19) |
| Total | 2.26205 | 0.49308 | 2.39459 | 3.33077 | 0.311 |
In Table 3 each error for each GCP in the different dimensions are shown. The calculation of the errors were obtained by means of the differences between the source camera and the estimated coordinates of the GPS. By considering a good alignment of the images and the real coordinates obtained by the high-precision GPS. As a result of which a lower final value is obtained at 0.6 re-projection pixels for all points. It is considered that if the error obtained is greater than 1 pixel no correct alignment between the images and the coordinates is implied.
Finally, the digital elevation models of the study site are shown in Figure 16 and 17. A maximum height of 1,819.87 m and a minimum height of 1,795.59 m for the DSM were showed. A resolution of 0.0463611 m / pix, and a point density of 465,256 points per m2, and for the DTM a maximum height of 1805.91 m and a minimum of 1789.45 m were obtained. The DEM is presented in Figure 16. It is better known as the Digital Surface Model (DSM) because it represents all the elements present on the study site or on the earth's surface such as: buildings, vegetation, automobiles, infrastructure, among others. Figure 17 is called the Digital Terrain Model (DTM). It shows a classification of the point cloud by terrain. Only those points that belong to the natural terrain, without considering all those points that belong to the infrastructure and vegetation are presented.
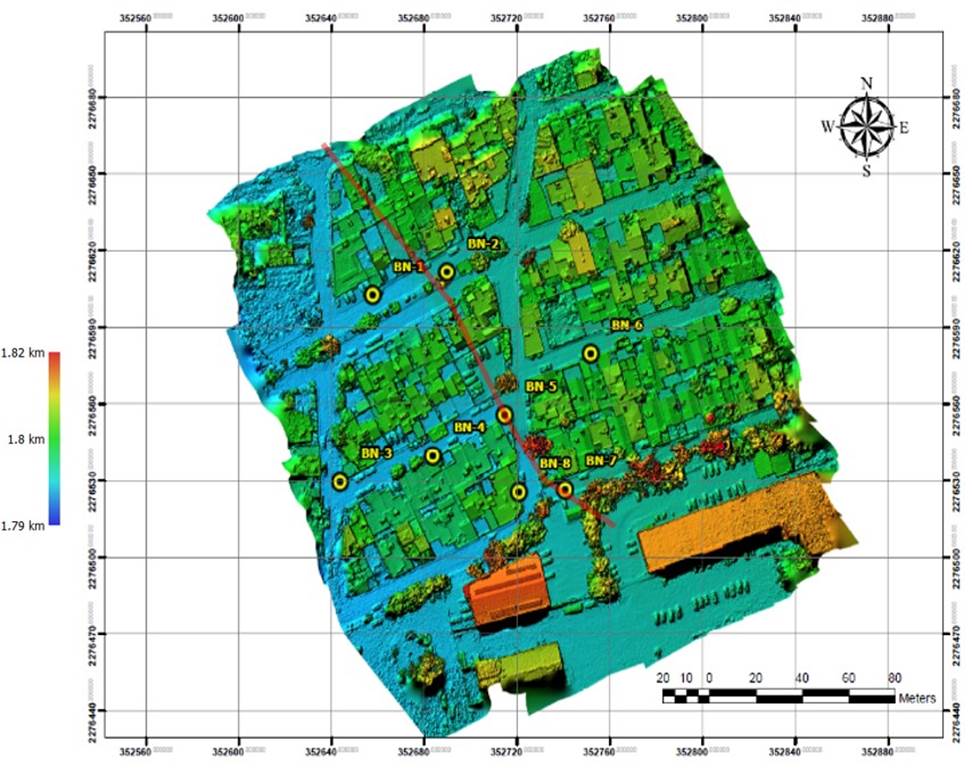
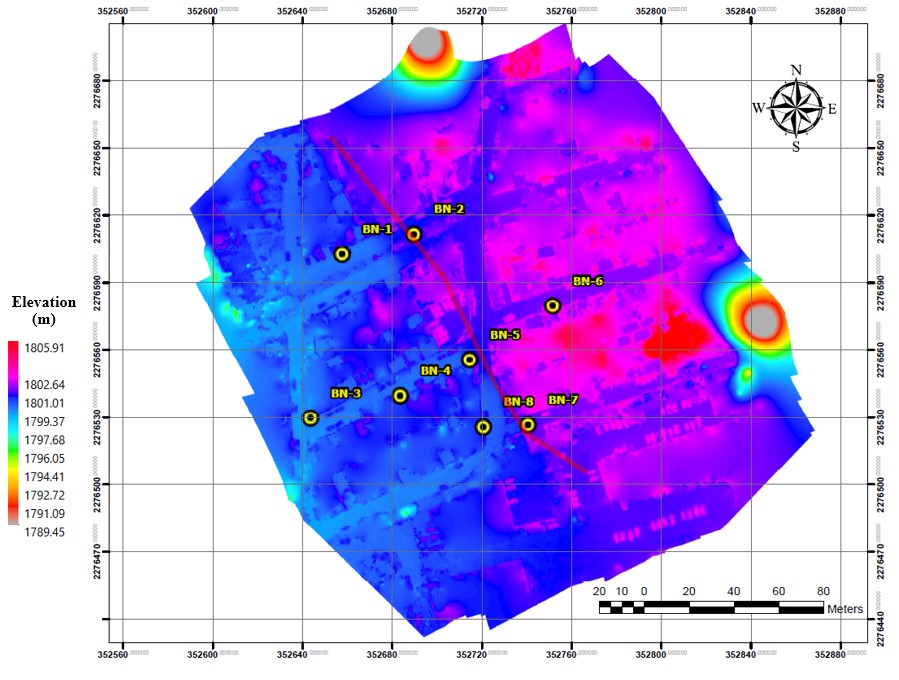
As can be seen in the Figure 17. The range of colors of blue varies in the central part of the DEM because in that area there is a subsidence transverse fault that completely crosses the “El Ensueño” neighborhood. So, it is possible to appreciate the unevenness by considering that it is approximately between 90 to 120 cm, which continuous displacements have been occurred causing different building’s damage during almost thirty years.
The parameters and the information mentioned above were obtained with the flight characteristics of the UAV shown in Table 4.
Table 4 UAV flight characteristics
| UAV flight characteristics | |
|---|---|
| Number of images | 103 |
| Flight altitude (m) | 60.6712 |
| Soil resolution (m/pix) | 0.0231806 |
| Covered area (km2) | 0.0504839 |
| Mooring numbers | 7284 |
| Projection | 55033 |
| Error (pix) | 1.38462 |
| Camera model | FC330 (3.61 mm) |
| Camera resolution | 4000 x 3000 |
| Focal length (m) | 3.61 |
| Pixel size (micron) | 1.56192 x 1.56192 |
Conclusions
The UAVs have recently taken on an important role within engineering and research. Different authors have used the UAVs to carry out simple and sometimes more complicated tasks, some of them have been: topographic surveys by means of aerial photogrammetry, monitoring of large areas with landslides, emergency service in rescues from natural disasters, among other innovative uses. Due to the fact that their use is quite simple and they demand few resources for it use. It is being governed by the new (published past November 2019) established laws or regulations. Furthermore, they are considered an excellent alternative to acquire high resolution images and other data, in a short time in any environment.
On the other hand, GPS has also become an excellent tool for obtaining points at any physical site on earth, in order to accurately obtain geographic coordinates.
According to the aforementioned. It is exposed in the different sections of this article, the use of both technologies is complementary, increases precision and reduces data collection time in the field. However, the use of the UAV independently has some disadvantages when used to carry out photogrammetric surveys. Because the integration of GPS and UAVs have multiple variations due to the geometry of the satellite mainly due to the different weather conditions and the quality of the equipment.
As can be seen in Table 2, the elevations of the GCP were obtained quickly and easily, repeating this step for a certain time, a monitoring of the complete area could be carried out in order to observe and understand its behavior during related phenomena with displacements. On the other hand, in Table 3 the different errors can be observed for each GCP by considering the pixels of each one of the photographs use. As an example GCP called as BN-1 presents an error in centimeters at X = 4.44092, Y = 0.50457 and Z = 2.74891.
It must be mentioned that these errors are automatically calculated by the software using the formula of the root mean square error (RMSE). This depends on how a pixel is altered in the processing, or in the capture of the images. The advantage of this process through Agisoft MetaShape is that it shows the total errors in the X, Y and Z dimensions. It can be seen that these errors depends on the number of images to which they are georeferenced during post-processing. It can be seen that GPS and UAV are two potential elements for obtaining DEM and topography in a short period of time, and with low use of technical personnel to carry out measurements and operation of the flight, in addition to the low requirements that are needed for the processing of all the data.
The most important impact is that the Digital Terrain Model (DTM) shows a spectacular difference between one side and another of the failure zone, which can indicates that this is a perfect tool to distinguish the particular affected areas with to use in an Atlas risk for urban areas with construction over failures due to land subsidence phenomena were detected or not.

