


 text new page (beta)
 English (pdf)
 Article in xml format
 Article references
 Send this article by e-mail
 Cited by SciELO
  Similars in
SciELO
Similars in
SciELO 
 Permalink
Introduction
Latin America represents one of the most important markets for manufacturers of carbonated drinks, as it concentrates the major consumers of soda in the world.
According to a study by Euromonitor International, Argentine is at top of the list with 131 liters per capita in 2012, followed by Chile with 121 liters and Mexico in third place with nearly 119 liters (CNN Expansión, 2013).
Carbonated drinks are considered a commodity and an essential part of the Mexican diet, providing energy to the working class as a milk substitute for the underprivileged children who consume it for its high sugar content. Therefore the bottling industry has been characterized for being stable as it keeps having a high sales volume even with the fluctuating conditions of the economy.
Before 2002, the carbonated drinks market in Mexico was divided mainly between two large bottler companies. Because of this characteristic, it could be considered as a duopoly. However, after 2002 a third bottler entered the Mexican market. The latter currently has two manufacturing plants and has been showing a significant increase in total market share. The market share for this third bottler is growing due to the introduction of the family size at lower price comparing with the current formats offered by the original two main bottling companies. As a result of this, market share was divided and the competition for market share has become fiercer (Sangabriel, 2012).
In addition to this, in 2013, Mexican Senate approved a reform that taxes one peso per liter of sugared beverages, as well as the related concentrates, powders, syrups, essences or flavoring extracts that contain any added sugars. These categories included carbonated drinks.
On average, the demand for carbonated drinks in Mexico decreased 4.06 percent (equivalent to 1.65 liters per person) during the first quarter, according to information provided by one of the main bottlers in Mexico. In 2013, per capita consumption of the carbonated beverage reached 163 liters per year. Meaning that, an average person in Mexico consumed nearly 40.75 liters per quarter (Espinosa, 2014). Thus, the sales goals of soft drinks in Mexico are much more difficult to achieve.
The goal of a company is to make profit. Thus, the reduction of sales is a major problem that must be solved in order to sustain the market share. The bottling companies require organized measures to face this reduction on sales, and because of that, is of the highest importance to improve the sales and marketing processes that are currently running on the organization. The potential impact of this strategy is that, by improving those processes, the results are shown directly on bottom-line profit (Pestorius, 2006).
This implies the necessity to establish a framework for problem solving that will provide a roadmap to make improvements on the sales and marketing processes. Today there are several problem solving methodologies that could address these kinds of problems, however it is necessary to pick one that has a structured thinking process that provides a common language and method to address business opportunities and solve business problems. A methodology that fits into this description is Six Sigma (SS).
SS has a history of success with hard savings. In the first 5 years of SS implementation, Motorola achieved saving of $US 2.2 billion (Tohidi & KhedriLiraviasl, 2012). For these reasons is safe to assume that this is the main driver for organizations to select SS as a solving problem methodology.
Six Sigma is a process improvement methodology, oriented to reduce variability of processes and with that, achieve defect (understanding a defect as any occurrence when a product or service does not satisfy the client’s requirements) reduction or elimination based on data and facts through implementation of SS projects. According to Kubiak and Benbow (2009), SS could be defined on four different ways:
Philosophy: The philosophical perspective views all work as processes that can be defined, measured, analyzed, improved and controlled. If you control the inputs, you will control the outputs.
Set of tools: The SS expert uses qualitative and quantitative techniques to drive process improvement.
Methodology: This view of SS recognizes the underlying and rigorous approach known as DMAIC (define, measure, analyze, improve and control). DMAIC defines the steps a Six Sigma practitioner is expected to follow, starting with identifying the problem and ending with the implementation of long-lasting solutions. While DMAIC is not the only SS methodology in use, it is certainly the most widely adopted and recognized.
Metrics: In simple terms, SS quality performance means 3.4 defects per million opportunities (accounting for a 1.5-sigma shift in the mean).
From this point and onwards when Six Sigma is referred it would mean the methodology definition from the section above.
As written before, SS is implemented through SS projects. A typical SS project consists of the following phases Define, Measure, Analyze, Improvement and Control. Some variations were made to the DMAIC process in order to integrate the organizational goals (Recognize) and to assure the continuity of the improvement achieved with projects (Replicate/Review), transforming the process from DMAIC to R-DMAIC-R (Temblador and Beruvides, 2009).
The structure of the DMAIC methodology allows the use at any business function. Since the early days of SS, there has been an unfortunate but common perception that SS is only oriented to manufacturing processes and that a fact based problem solving methodology does not transfer well to transactional processes, such as sales and marketing (Pestorius, 2007).
The fundamental problem in these business functions is due to inefficiency or ineffectiveness of at least one component of the sales process or lack of information within the process. (Webb, 2006)
Pestorius (2007) mentions several reasons for which people working outside manufacturing may be uneasy about using SS as a problem solving method, he lists the following:
In manufacturing it is believed that almost every variable can be controlled.
Professional backgrounds of SS consultants are usually from manufacturing areas, that may represent a barrier to the understanding of sales and marketing processes.
Quality is not an attribute typically measured in sales and marketing.
Sales and marketing do not easily adopt standardized processes.
However, Guaspari (2001) mentions that it is possible to implement SS on sales and marketing as long as the tools used on the methodology are tailored to these processes.
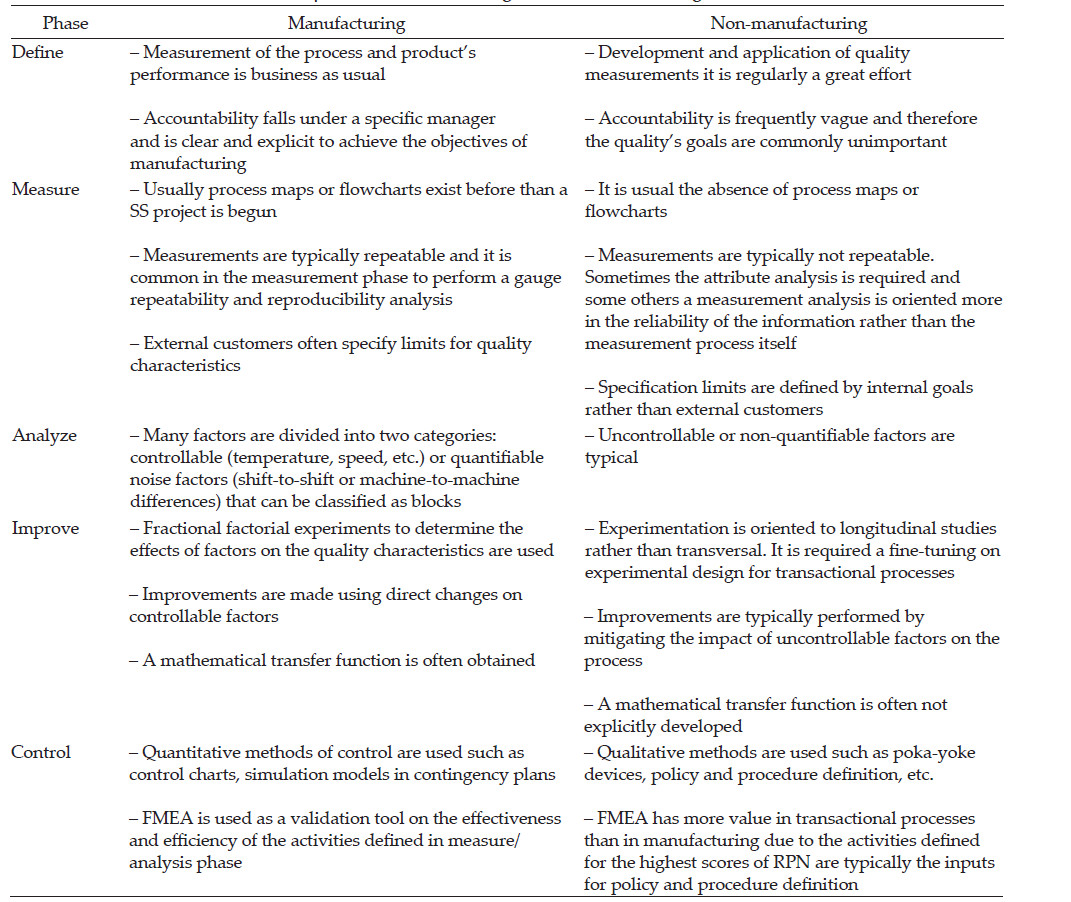
In Table 1, the differences between manufacturing and non-manufacturing on each of the DMAIC phases are presented.
SS is a project driven methodology. An adequate project selection is one of the most important activities because it guides the identification and allocation of resources in order to obtain more relevant benefits. One addendum to the DMAIC structure was the introduction of the Recognize before Define phase. At the Recognize phase, the customer, process and business voice are identified and along with the strategic planning they are used to align the company’s objectives with the project list (Thompson, 2007). Pyzdek (2003) says that project selection for SS is as much as an art as a science. One starting point is to select projects that top management would “buy”, however, there is no “ideal” procedure on how to select projects for SS, while there have been several attempts to make a process to select projects they fall short on how to do it constantly. (Thompson, 2007)
This paper will present a framework for project selection in the sales and marketing environment and its results when applied to a soft drinks bottling company.
Stage I. Establish commitment and with CMO
SS as methodology could be used to improve business profitability, to drive out waste, to reduce cost of poor quality and to improve the effectiveness and efficiency of all operations so as to meet or even exceed customers’ needs and expectations (Banuelas and Antony, 2002). In the past, this methodology has been predominantly used to improve manufacturing processes, but it is now increasingly applied to a wide variety of nonmanufacturing operations also known as transactional processes.
Most of the relevant transactional processes can be found in the sales and marketing functions. Selling and marketing exist because someone must persuade someone else to listen carefully, speak frankly, make a decision and typically part with his or her money (Webb, 2006). These functions (S&M) must add value from a customer perspective.
As any business improvement strategy, SS requires commitment from top management also known as steering committee. Typically, each member of the steering committee will take the role of sponsor of the program, and therefore for a successful implementation they must be involved in the allocation of proper resources for the program (Halliday, 2001). One major key for this to happen is to have an executive training of the methodology prior to the beginning of the initiative.
Commitment often comes from the benefits (forecasted or previously obtained) of the implementation. Antony (2006) mentions the following benefits from applying Six Sigma on transactional processes:
Effective decisions must be taken based on facts instead of emotions. Costs can be considerable reduced using well-known techniques for problem resolution.
Identify and appreciate the customers’ requirements and expectations, it will influence the customer satisfaction and loyalty.
The shareholders satisfaction will increase through trusted and capable internal operations.
Problems could be efficiently solved implementing correct problem solving techniques and training.
Discard systematically all the non-value operational activities in order to improve delivery of service.
The level of service will be reliable by minimizing variability in service performance.
Improve preventive process instead of fire-fighting approach.
Encourage teamwork in all levels of the company
Once the management is convinced from the potential benefits, it is time to establish how to tackle sales and marketing problems. In order to address these problems, a value driver map is required to deploy, from the strategic down to the operative, performance indicators to be used that present an overview of S&M functions.
Stage II. Elaboration of a value driver map
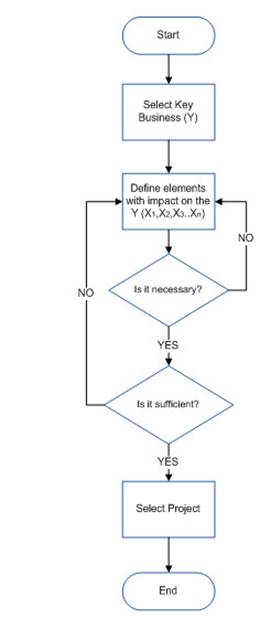
The goal of stage II is to identify the operative indicators (X’s) that have an impact on the Key Business Indicators (KBI) that represents the process performance main result (Y) through a value driver map (VDM). A VDM is a tree diagram that shows a relationship among strategic and operational performance indicators. An equivalent of the VDM is the CTQ tree that is used to translate needs considered vital by the customer into product and services characteristics and links these characteristics to organizational processes (Six Sigma Academy, 2002). The difference between VDM and CTQ tree is the focus on the processes and its result in the first one against the customer’s needs in the second one. In the context of project selection for SS it is possible to use a value driver map to find which strategic indicators are the results (needs) of certain performance indicators (drivers) and which are the key issues to resolve in order to improve that performance (requirements) (Figure 1).

The process to elaborate a value driver map is the following:
At first, it is necessary to establish which is the main indicator to be improved. Usually a Key Business Indicator is selected, this indicator will be the “Y” of the Value Driver Map and it should be place at the left of the sheet.
A participative session with stakeholders is required to define the components or elements that have impact on the “Y” indicator. In order to do this, it should be asked how does Y is calculated? or what elements are required to estimate Y?. This process would result on having on the right of the indicator another level for process performance indicators that have a relationship with the indicators on the left.
In order to ensure all indicators required are on the value driver map, a validation process is necessary before continuing to the next level. This should be done through a necessity and sufficiency analysis. Necessity means that the indicator is required in order to go to the next level and sufficiency would be when it is not needed another indicator to go to the next level. Once those two conditions are achieved it is safe to assume that is possible to go to the next level.
Step 2 and 3 repeat themselves until the last practical level is achieved (this is assured by step 3). The last level indicators are the ones that will be selected for the SS projects.
The deliverable for stage II will be a tree-like diagram (Figure 2) that establishes the relationship of the results (Y) with what it has been done on the processes (X).
Stage III. Project Selection
Project selection is a critical factor on any continuous improvement program, the correct identification of SS projects leads to significant benefits. Managers and employees gain This can induce confidence in management as well as in employees about the efficacy of the Six Sigma initiative, and as a result it will promote future investment and efforts in the initiative (Kumar et al., 2009).
There is research about the existing relationship of project selection and the stalling of such projects. There are two main reasons identified; 1) errors of problem definition traceable to the absence of certain objectively verifiable characteristics in the project itself, 2) errors in judgment during the decision-making process. (Bacdayan, 2001)
The selection of six sigma projects is considered a multi-criteria decision where most of the information relevant to the problem is difficult and conflicting in nature. Selection criteria need to be prioritized so that those that are most critical to the overall success of the business will have the most impact on the project selection.
The following Table 2, is aligned with previous studies of critical success factors for six sigma implementation, where customer focus, linkage to business strategy, top management commitment and financial benefits are considered as essential factors for the successful implementation of six sigma (Banuelas et al., 2006; Antony, 2004).

At the end, management has to choose which of the criteria will be used for project selection. Usually they pick projects with higher financial impact; however as the company strategy could be one that focus in other aspects of the organization any criteria could be used.
Management should have an agreement on which criteria is to be used to avoid further questioning on why a project was selected.
At this point we have a Value Driver Map with the X’s that affect our main indicator (Y). Project selection shall be done by choosing from the pool of X’s which are the ones that have a major impact according to the criteria agreed upon by management.
The project selected shall always have a form of “Increase/Decrease (depending on the indicator) X”. This is to ensure that there are no confusions on the objective of the project selected.
The selected projects should be evaluated later by the financial department to get an estimate of the benefits of each one of the projects. It is important that the evaluation specify what kinds of benefits will be resulting of completing the project (Direct P&L savings, cost-avoidance, employee morale, etc.).
Case study
In order to implement this framework, we worked with a bottling company that was interested on doing process improvement projects for the sales and marketing function, so we were hired as External coaches.
At stage I, we met with the Chief Executive Officer (CEO) of the organization and its Sales and Marketing Director to establish the objectives of the implementation and who would be the team that would work on this particular SS implementation. The organization is structured as the Figure 3 shown below.
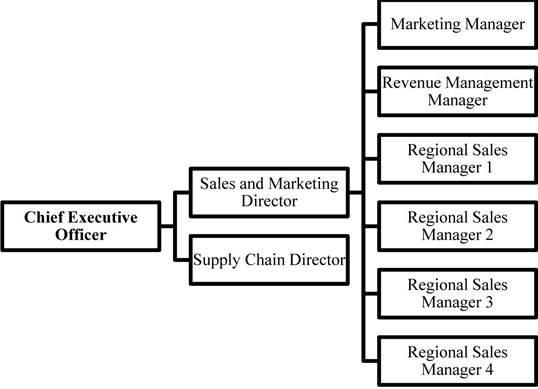
Top management decided that for the first exercise to elaborate the value driver map a team formed by the Marketing Manager (1), Revenue Management Manager (1) and the Regional Sales Managers (4, one for each sales region) would be appropriate.
On the next meeting, the CMO and his staff were informed about the initiative of implementing SS on the Sales and Marketing functions, we discussed topics such as:
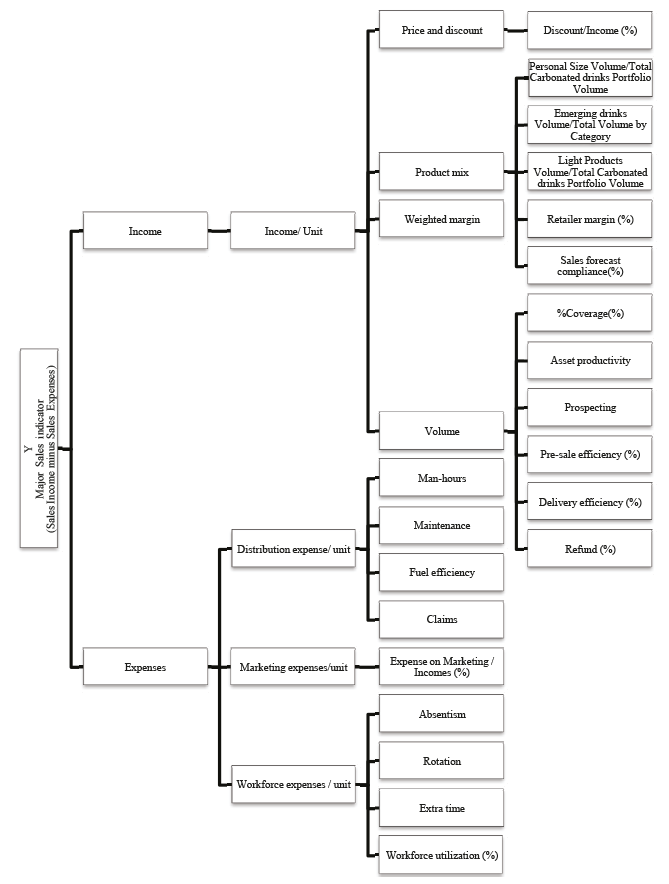
Top management decided that the SS program objective was to be focused on two main directives: a) Increase Sales Income and b) Diminish Sales Expenses, the results would express a better performance on the Major Sales Indicator (Sales Income minus Sales Expenses). After this we scheduled a meeting for the following week to train the team to elaborate the value driver map.
For stage II, the session was scheduled with duration of 40 hours divided between 5 days. The agenda is indicated on Table 3:
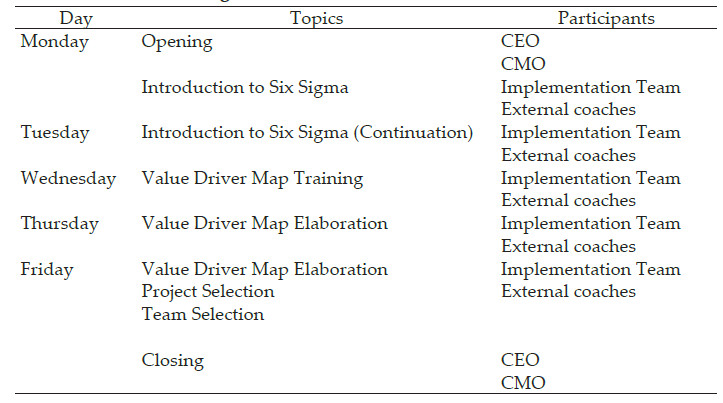
On the opening, the CEO and CMO reassured the Implementation Team of the importance of the SS program to the company and how it would improve the company’s revenue, they also expressed that SS implementation would benefit the personnel skills and it was a good chance for exposure and career development. The team was reminded of the two directives that would have to be present on every project for the improvement of the Major Sales Indicator, they also were assured that they would have available resources to implement the projects.
After this we commenced the training for the team on Six Sigma, the topics covered were the basics of the R-DMAIC-R model, the objectives of each phase and which tools were to be used for implementation.
The next step was to train them on the Value Driver Map, this was done in order to do the exercise the next day, we asked them to bring information on their performance indicators to have the more data to work on.
In the exercise session, the team correctly identified the Major Sales Indicator as the Y on the Value Driver Map and on the next level the two directives that they were given on a previous session. This was followed by the questions, “¿Which are the main elements composing the Sales Income and the Sales Expense?” The session consisted on brain storming between managers and the review of the different performance indicators managed on their departments following the framework established on stage II. The resulting Value Driver Map is shown below as Figure 4.
The map was validated by the implementation team and in order to continue to stage III of the model. For the following day, the implementation team was asked to bring data on these KPI’s. For stage III, each one of the Regional Sales Managers reunited with the Revenue Management Manager and the Marketing Manager and chose projects for each one of the regions. The criteria used to select the projects was financial impact. The number of projects selected was restricted by the number of people in their regions. In the Table 4 below is shown the projects that were selected and the amount of people to deliver them.

After the projects were selected, Regional Managers would have to choose a start date for training on Six Sigma for each one the project leaders.
Conclusions
One of the hardest challenges that any continuous improvement program faces it is the lack of support from top management. Even today many organizations consider continuous improvement as a spend instead of an investment, on this type of organization a program is likely to fail on deliver results or simply fade away as another management initiative.
Six Sigma has proven in its many years of existence that is a project driven methodology that works and delivers real results, however much of its success depends on management support (time, people, financial resources, etc.) and the adequate project selection. Project selection is one of the most critical and challenging activities faced by Six Sigma companies. Most organizations are able to identify a host of project opportunities, but the difficulty arises in sizing and packaging those opportunities to create meaningful projects.
Top management often manages in the language of currency, while the processes measure its results on performance indicators. An effective communication between these two parts is crucial to achieve results that are on the benefit of the organization.
On the sales and marketing functions it is even more challenging to translate these requirements as most people believe that measurement on these areas is hard to achieve.
The value driver map is a straightforward tool that makes clear the relationship between processes and finances. In this way the proposed framework helps top management to have a notion of how an indicator has a certain impact over the bottom-line and therefore it is easier for them to continue supporting these initiatives. As the framework requires input from the main stakeholders it ensures that their expertise is rested on the relationships that are formed at each level of the map.
The use of these framework on the case study ensured that the top management main concern, the major sales indicator, was always the goal of the SS initiative and that all efforts were align to achieve such goal.
The outputs from the case study in this paper show that the value driver map approach provides an alternative way for selecting Six Sigma projects on sales and marketing functions. One advantage of the proposed framework is that it can be used on other key business areas of the organization without making any changes.
Furthermore, the proposed framework establishes a guideline to quantify and select projects based on impact on the bottom-line.
It is proposed as a further research to explore the possibility of creating mathematical models that could establish the relationship of indicators at its correspondent levels. This way an organization could predict what would be the impact of increasing or decreasing a performance indicator on the bottom-line.

