


Services on Demand
Journal
Article
 English (pdf)
 Article in xml format
 Article references
 Send this article by e-mail
Indicators
-
 Cited by SciELO
 -
 Access statistics
Related links
-
 Similars in
SciELO
Similars in
SciELO
Share

 Permalink
Papeles de población
On-line version ISSN 2448-7147Print version ISSN 1405-7425
Pap. poblac vol.15 n.62 Toluca Oct./Dec. 2009
Demographic forecasts, migration and transition theory: a labor market perspective
Predicciones demográficas, migración y teoría de transición: una perspectiva del mercado de trabajo
Michele Bruni
University of Modena. Correo electrónico: boromir_bm@libero.it
Abstract
The paper proposes a new logical system to build demographic scenarios based on a model that explain migration inflows as a function of the manpower needs that countries with below replacement fertility are experiencing, as a result both of the decline in Working Age Population and employment growth. Using this approach we show that the WAP of countries characterized by low fertility will necessarily increase; that the migration balance of numerous countries will turn from negative to positive well before 2050; that the level of the international migration flows will progressively increase to unprecedented values so that at least 250–300 million people will move from developing countries to developed countries in the next 50 years; that the decline in fertility and the relative rates of employment growth of developed and developing countries will determine radical changes in the pattern of international migrations. The last part of the paper discusses some policy implications of this vision of the future.
Key words: demographic forecasts, labour market, international migration, structural burden, transition theory.
Resumen
El trabajo propone un nuevo sistema lógico para construir escenarios demográficos basados en un modelo que explique los flujos entrantes de migración como una función de las necesidades de mano de obra que países con tasas de fecundidad por debajo de los niveles de remplazo están experimentando como resultado del declive de la población en edad laboral y el crecimiento del empleo. Usando este enfoque mostramos que la población en edad laboral (PEL) de los países caracterizados por un bajo nivel de fecundidad necesariamente crecerá; que el balance migratorio de numerosos países cambiará de negativo a positivo bastante antes de 2050; que el nivel de los flujos migratorios internaciones progresivamente incrementará hasta valores no vistos de manera que entre 250 y 300 millones de personas migrarán de países en desarrollo hacia desarrollados en los siguientes 50 años; que el declive en fecundidad y el crecimiento relativo de las tasas de empleo de países desarrollados y en desarrollo determinará cambios radicales en el patrón de las migraciones internacionales.
Palabras clave: predicciones demográficas, mercado de trabajo, migración internacional, carga estructural, teoría de la transición.
Introduction
For more than twenty years demographers have been announcing to the world, although with little impact on politicians and public opinion, that an unprecedented demographic implosion was going to strike the more developed countries. The cause? In total opposition to all previous forecasts, the decline in fertility, that had began with the industrial revolution, has not stopped at the replacement level of around 2.1 children per woman, but has dropped below this threshold in numerous developed and developing countries. It has been unanimously maintained that this will determine a relevant reduction of total population, an even more pronounced contraction of Working Age Population (WAP) and progressive ageing phenomena that will seriously threaten the existing welfare systems.
In the last 50 years the forecasting performance of demographers has not been very successful. The historical change of the sign of the migration balance of the countries of the North shore of the Mediterranean came as a big surprise not only to the citizen and politicians of Spain, Portugal, Italy and Greece,1 but also to demographers and economists. According to the theory of demographic transition,2 the extraordinary demographic revolution that has been affecting an increasing number of countries starting at the end of the XVIII century was expected to provoke the passage from a traditional demographic regime, characterized by high rates of fertility and mortality, to a modern demographic regime characterized by low rates of fertility and mortality. Both regimes are described as equilibrium regimes. Therefore, the theory of demographic transition has always maintained that the decline of the rate of fertility would have stopped at the value of 2.1 children per woman. This prediction has already been largely falsified by empirical evidence, but continues to represent a reference point for theoretical and empirical analysis. Finally, in the last twenty years, demographic forecasts have largely underestimated the migration balances of the countries with below replacement fertility and, therefore, their level of working age population and total population.
The paper maintains that also the forecast of a demographic implosion will be disproved and that the countries affected by below replacement fertility will witness a growth of working age and total population. This result that contradicts all the available forecasts is generated by the adoption of different assumptions on the migration balance. In the standard model future migration balances are assumed equal to the average value of the migration balances registered in the previous ten years and constant over the period of the forecast.3 No consideration is given to the future trends of WAP and to the relationship between the demographic sphere and the economic sphere and, more specifically, to the relationship between immigration and the demand for labour. A different logical system based on an immigration model that posit a functional relationship between immigration and the decline in WAP and employment growth, shows that in countries with a TFR below two immigration is normally above replacement level and does therefore generate an increase in WAP and Total Population. The same approach will then bring to the conclusion that numerous European countries in transition from a command economy to a market–based economy will become countries of arrival so that, in not too far a future, all European countries will register positive migration balances. This will be true also for other countries like Korea and Cuba. The paper does also analyze the problem of the structural burden. The use of an economic indicator brings to the conclusion that the process of ageing, induced by the decline in fertility, will not necessarily bring to a worsening of the structural burden. The increase in the number of the dependant can, in fact, be offset by an increase in the employment level and in the rate of employment. The final part of the paper is devoted to a short discussion of some policy implications of this new vision of the demographic future for what relates to the lack of labour supply, to the structural burden, to the demographic unbalance that characterizes an increasing number of developed and developing countries. Some final notations are directed to explicit the relationship between migration flows and the theory of demographic transition.
The area of potential demographic decline
The fertility rates of the more than 200 countries in which the world population is today divided present two main characteristics: an unprecedented dispersion of values and a very high number of countries with total fertility below–replacement level.
According to the last survey published by the Population Division,4 total fertility rates are included between a maximum of 7.3 children per woman in the People's Republic of Congo and a minimum of 0.8 in Macao. Of the 195 countries and territories considered by the Survey 67 have a fertility rate at or below 2.1,5 45 between 2.11 and three, and 83 above 3 (fig. 1).
In the first group of countries total population is already declining, or will start to decline in the next few years. The fertility rates of the countries in the second group can be expected to decline below two in the next 2030 years and their total population to decrease in the second half of the century. The third group includes the countries in which the demographic explosion will almost certainly continue for a long time, possibly beyond the end of the century. For the moment, let's define these three areas as the Area of the Potential Demographic Decline (APDD),6 the Area of the Future Potential Demographic Decline (AFPDD) and the Area of the Demographic Explosion (ADE).
In the medium variant scenario7 of the Population Division total fertility is assumed "to converge eventually toward a level of 1.85 children per woman".8 Therefore, according to the most probable scenario of the Population Division, an increasing number of countries is expected to register declines in total and working age population together with relevant ageing phenomena. Will this forecast become true?
The projection of a closed population can be considered rather reliable over the medium run since, under normal conditions, fertility and mortality rates do not present dramatic changes and, therefore, past tendencies provide good indications for the future.9 Moreover, no viable alternative methodology is today available.
Over a horizon of 15–20 years, the forecast of a closed WAP —a variable that will play a major role in the following analysis— is even more reliable since entries are constituted by generations of young people already born or that will be born in the following five years.
As acknowledged also by the Population Division,10 the weakest assumptions are those relative to migration. The Population Division projection of the migration balance of each country is based on two elements: past trends and the country policy stance on this issue, the first being largely predominant. This approach is therefore based on the implicit hypothesis that the migration balance is totally independent from the natural balance of WAP and is not influenced by the economic sphere, and more specifically by labor market trends.
The past performance of this approach has been, to say the least, rather poor. In the '80s, it has led to assume migration balances extremely lower that those that have then be registered. Lately, the progressive increase in migration balances has determined a parallel increase in their forecasted levels. The final result has been that the initial scenarios of dramatic drops in total population and WAP have become progressively less pessimistic.11
The decline of working age population and migrations flows in apdd's countries
After progressively reducing the number of children, a decline in the number of births will provoke a progressive decline in the number of people in working age and therefore of the potential labor force. This phenomenon started in numerous developed countries toward the end of the XX century, but its full impact will become extremely more relevant in the XXI century. Table 1 reports the demographic projections made by the Population Division for 41 countries that will register a natural decline of their WAP between 2005 and 2050, together with the data for 1960–2005 period.12
In 1960 the WAP of the countries in the sample amounted to 594 million that, at the time, represented 34 per cent of the world total WAP. In the following 45 years all these countries, but Germany and Luxembourg, registered positive natural balances that amounted to a grand total of 185 million. Although 18 countries registered a negative migration balance, WAP grew in all the countries of the sample reaching a total value of 859 million in 2005 (20.5 per cent of the world WAP). Immigrants from countries outside the sample contributed for 29 per cent, on the average 1.7 million immigrants per year. Other 10 million immigrants moved between the countries of the sample so that net immigration in the 23 countries of arrival amounted to 85 million contributing to the growth of their WAP by 40.1 per cent. The ranking of arrival countries for total number of immigrants is lead by the USA (41 million), followed by Germany (10 million), Canada, France (between 6 to 7 million), Russia and Australia (between 5 to 6 million). In Germany and Luxembourg, the only two countries with negative natural balances, migration was above replacement level.
According to the Population Division forecast, in the first half of this century, the dynamic of the WAP of the 41 countries of our sample will witness a Copernican demographic revolution: their natural balances will turn negative, determining an overall decline of WAP of 197 million. The phenomenon will reach maximum values in Japan and Italy (respectively –41.4 and –40.5 per cent), while the USA will be the less affected (–0.8 per cent) (graph. 1).
What about migration? According to the Population Division forecast, three different situations will emerge. In a first group of countries, net migration will be positive, but below replacement; in a second group, migration will more than offset the natural decline; in a third group, net migration will be negative contributing to the decline in WAP.
In the first group of countries, around 38 million immigrants will compensate 26.6 per cent of the natural decline of WAP (–143 million) so that the total balance will be equal to –105 million. In the second group of countries, 72.6 million immigrants abundantly offset a natural decline of 13.6 million. WAP is, therefore, forecasted to increase by 59 million (+20.3 per cent). Finally, in the third group of countries, a negative Migration balance of 3 million is compounded to a natural balance of –43 million to produce a total decline of 46 million (graph. 2).
The first group of countries accounts for 71.7 per cent of the natural decline and for 35.4 per cent of the migration balance; the second group for 6.8 per cent of the natural balance, and for 67.4 per cent of the total inflow of immigrants; finally, the third group of countries accounts for 21.4 per cent of the natural decline in WAP, but will export labor to the other countries (graph. 3 (4) ).


These surprising results are due to the fact that the future values of the migration balances are obtained extrapolating recent values and, therefore, without taking in to consideration the huge change in demographic trends that will take place in the period considered and the interrelationship between the demographic and the economic spheres. The end result of this approach, as shown by the following scatter diagram, is that no correlation exists between the forecasted values of the natural balance and of the migration balance.
For the moment the assumption of independence of the demographic trends from the economic sphere has not been questioned by economists, and the demographic projections proposed by the Population Division and by other Statistical Institutes, adopting the same methodology, have represented the starting point to intervene or plan interventions on the welfare system and to forecast labor market variables.
For instance, in a study of the European Union (Carone, 2005), labor force is projected to 2050 multiplying an estimate of WAP, obtained with a methodology similar to that of the Population Division, by the rates of participation obtained trough an extrapolation procedure. The rate of unemployment, derived from political assumptions,13 allows computing the level of unemployment. The difference between labor force and unemployment gives the level of employment. The end result of this, to say the least, anomalous procedure is that in EU25 countries employment is forecasted to decline from the maximum reached in the interval between 2003 and 2050 by more than 31 million, 24 million in EU15 and 7 million in EU10.
Also ILO forecasts labor force multiplying its proj ections of participation rates by the population estimates of the Population Division.14
The implication of these statistical procedures is that fertility not only represents the prime engine of demographic trends, but also a limiting factor of economic growth, determining the upper limit of the employment level and, implicitly, enterprise localization.
A simple model to explain net migration flows
The only way to avoid a mechanical approach to forecasting migration and its unrealistic consequences15 is to use a model. Demographic theory does not have formalized migration models, while economists have models that explain departures, but not arrivals. In substance, at the moment, we do not have theoretical tools allowing:
• To identify which countries are or will become countries of departure and which countries are or will become countries of arrival.
• To explain, and therefore forecast, the level of net migration in destination countries.
The model we propose16, while identifying countries of potential departure and country of potential arrival, aims to provide an explanation of migration balances and therefore a theoretical basis to forecasts immigration flows. The model is based on the following definitions and assumptions. We will say that a country presents.
• A Structural lack of labor supply, when is characterized by a long–lasting and relevant negative difference between generational entries17 into the labor force and generational entries in to employment.
• A Migratory potential, when such long lasting and relevant difference is positive.
The basic hypothesis is that the countries characterized by a structural lack of labor supply are countries of potential arrival, while the countries characterized by migratory potential are countries of potential departure.
A structural lack of labour supply explicit itself in the fact that, in a given interval, a share of the jobs available in the country, that we define as the Total Manpower Needs (TMN), cannot be covered by the local labour supply. The model assumes that the Migration Balance (MB) is determined by the Total Manpower Needs. In symbols:

Total Manpower Needs are given by the difference between the increase in the level of Employment (ΔE) and the change in the level of the local labor supply (ΔLLS) taking place in a given interval:

In its turn, the absolute change in local labor supply is the sum of two components. The first, of demographic origin, is given by the product between the Natural Balance of WAP (NBWAP) and the rate of employment at time t (roet). The level and the sign of this variable are determined by the trend of WAP in the period considered. The second is determined by the change in participation behavior taking place during the interval. Therefore, it can be computed as the product of the absolute change in the employment rate18 and the level of the local WAP at the end of the interval:

In order to test the model, we have computed the MB and the TMN for 29 countries, characterized by positive migration balances during the 2000–2005 period. The sample includes Australia, Canada, the USA, the 15 EU countries, Cyprus, the Czech Republic, Hungary, Malta, Slovakia, Slovenia, Switzerland, Norway, Russia, Belarus and Japan.
In 2000 the WAP of these 29 countries amounted to 691 million. In the following five years twelve countries registered positive natural balances (+8.4 million) and sixteen negative natural balances (–7 million), producing an overall slightly positive natural balance of 1.4 million. During the same interval, the employment level of the same countries has increased by around 19 million, and the total contribution of the local labor supply has been of around 7.2 million. The interaction between the growth in the number of jobs and the response of the local labor supply has resulted in
Total Manpower Needs of around 11.7 million. As a response, the countries in our sample have imported 17.3 million immigrants.
We have first tested a linear model with the regression constant.

The intercept aims to verify the presence of immigration for TMN=0 and, therefore, of an immigration component not pulled by demand, but pushed by the presence of a migratory potential or, more simply, by poverty. The regression analysis has shown the constant to be very small and statistically not significant.

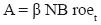
We have, therefore, run the regression without constant with the following result:

As expected β, that measures the reactivity of foreign migration potential to the structural lack of local labor supply, is greater than 1 since immigrants workers take with them or are followed by some family members. It must also be underlined that the reciprocal of β (in our case 0.683 per cent) provides an estimate of the employment rate of the immigrant population and, therefore, of the impact of immigration on the total employment rate.
Forecasting models and scenarios
The model
Demographic projections are based on the hypothesis that the three main variables that determine population trends (births, deaths and migrations) can be forecasted independently from each other and independently from the economic sphere and, therefore, from the dynamic of the labor market.
The logical system I propose is based on a different perspective. Fertility and mortality rates determine the trend of WAP. In the medium run (20–25 years) the upper limit of the local labor supply depends on past demographic trends, labor demand and social customs. The model postulates, in fact, that all capable men will end up participating in the labor market since for them to work is not a choice, but a social right and duty, while women participation is determined by the level and trends of the employment rate, by social customs and the availability of services for children and elderly (Bruni 2008 and 2009). The growth in production and productivity, and therefore in employment, are determined by aggregate demand. In the medium run population size does not have a relevant impact on the rate of economic growth that depends on aggregate spending and not on population size. The presence of a structural lack or of a structural excess of labor supply is, therefore, the result of the interaction between population long–run trends and economic trends, between the demographic sphere and the economic sphere, given the laws, the social customs and the organizational structure that characterize the local labour market.
Figure 2 provides a general outline ofthis alternative forecasting system, while Figure 3 presents a more detailed description of the computational procedure.19
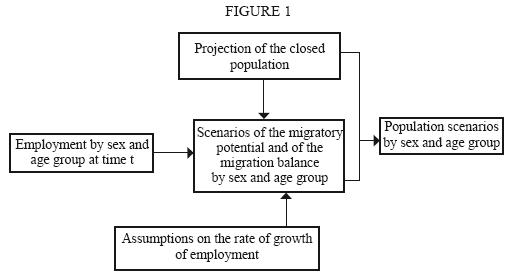

The model is articulated into two parallel paths: the first relates to the demographic side, the second to the labor market side. The two paths will then converge to produce demographic scenarios. In its complete form the procedure is based on a stock–flow model of the labor market that allows estimating demographic and labor market variables by sex and age groups.
The demographic side of the model provides a forecast of the closed WAP based on generational entries and exits. Generational entries are equal to the number of young people reaching the lower limit of working–age. Exits are determined by deaths in working age and by generational exits, i.e. by the exits due to the people who reach the upper limit of working age.20
On the labor market side, the employment data by sex and age group allow estimating generational exits that are then summed to additional demand (the increase in the number of jobs) to compute the labor demand in terms of flow, i.e. total first time entries in to employment. The increase in the number of jobs represents the main scenario variable and its values are established in such a way as to cover a realistic range.
Labor demand in terms of flows and entries in the closed WAP allow estimating Total Manpower Needs in alternative scenarios of employment growth and labor market participation (the second scenario variable).
The following step consists in estimating the employment level, the migration balance and the working age population by sex and age group. These data can then be used to compute the labor market indicators characterizing each scenario and compare the impact of alternative rates of employment growth and participation rates. Finally, the model can be used to simulate the impact of alternative demographic and labor market policies defined in a large perspective and inclusive of the policies affecting the educational and vocational training system, on one side, and retirement, on the other.
A by–product of the data on WAP is the level and structure of women in fertile age by nationality. Assumptions on the specific fertility rates by age group and nationality allow computing the number of births. On the other side of the age ladder, exits from WAP and mortality rates allows computing the number of elderly by sex and age group. All necessary information is then available to compute total population by sex, age group and nationality in various scenarios of employment growth and labor market participation.
In conclusion, the model adopts demographic tools (a generational approach to the construction of labor market variables defined as populations) and economic relationships to jointly produce labor market and demographic scenarios.
A simplified forecasting procedure
This full–fledged model allows forecasting population and labor market variables by sex and age group. It cannot be a goal of this paper to produce such scenarios for all the countries that are going to be interested by declining natural balances of WAP in the first half of this century, a task that requires statistical information and computational resources available only to National and International Statistical Institutes.
The more limited, but still ambitious goals of this paper are:
• To identify a simplified version of the model proposed in the previous paragraph allowing to derive a series of relevant analytical conclusions and policy recommendations.
• To apply this simplified procedure to a limited number of areas and countries.
• To compare the future trends in migration and population forecasted by our model with those published by the Population Division.
• To analyze their different economic and social implication using economic indicators of structural burden.
• To derive some general conclusions on such topics as the future demographic trends of below replacement fertility countries, the relationship between employment growth, migration and structural burden, and the inversion of the sign of migration balances in transition countries.
• To discuss the policy implications of the different vision of the future demographic trends produced by the model.
• To analyze the interrelationship between the theory of demographic transition and immigration and the possible role of immigration in bringing fertility back to replacement level.
According to the model previously proposed, net immigration is determined by the Total Manpower Needs (TMN) generated by the trend in local working age population and by the rate of growth of employment, while increases in the participation rate can partially offsets the lack of local labor supply. Therefore, given the natural trend in WAP, the Migration Balance (MB) is a function of the rate of employment growth (x) and of the absolute variation in the participation rate (z).
In a scenario perspective, the TMN can be computed as the algebraic sum of three components:
The Demographic Manpower Needs (DMN) generated by the Natural Balance of WAP (NB); this component is equal to the product of the forecasted natural balance and the employment rate at time t; it measures the number of jobs that can or cannot be covered by the local WAP, assuming the rate of employment constant

The Manpower Needs determined by the increase in Employment (EMN); we can express this variable as the product between the employment level at time t (Et) and its rate of growth over the time interval chosen for the scenario (x):

The contribution of local labor force to cover employment needs through an increase in its rate of participation (PC); it can be expressed as the product between local WAP21 at time t+1 and the absolute change in the rate of participation (z)

Therefore

Since in any given interval and for any given country, the natural balance is known and the roe is a datum of the problem, the migration balance determined by DMN is a constant (A).
Therefore

This formulation shows that the Total Manpower Needs have a demographic component and a labor market component. The demographic component is determined by the change in WAP, while the labor market component is a direct function of the rate of growth of employment and an inverse function of the increase in the rate of participation of the local population in working age.
The forecasting exercise
In order to capture the implications of the forecasting model we have just proposed, we have build scenarios for two countries, Japan and Russia, and for two large areas, the first including Australia, Canada and USA (the New World Countries), the second the countries in EU15. The choice of Japan and Russia is justified by their demographic and economic relevance and by the fact that they will be affected by a very pronounced decline of WAP.
Tables 2 and 3 presents the demographic and labor market data for the 1985–2005 period and for the last five years of this time interval for the same22 countries.23 This allows setting a comparative background for the scenarios and choosing the parameters required by the model, paying attention not only to long–term tendencies, but also to the most recent evolutions of the relevant variables.
Between 1985 and 2005, the natural balance of WAP has been positive in NWC, EU14 and Japan, negative in Russia. The sharp decline in fertility affecting EU countries, Japan and Russia is reflected by an increase of the natural balance yearly average in the last five years of the interval considered. The NWC, where the number of births has notably increased since 1975, shows the opposite trend.
Between 1985 and 2005, the rate of employment growth presents the maximum value in NWC (22 per cent); EU15 countries follow with 13 per cent. In Japan employment has increased by five per cent. Russia, that went trough a transition phase from a command economy to a market–based economy, registers a long run negative rate of employment growth. In the last five years, the rate of employment growth has been similar in NWC, EU 15 and Russia (around 5 per cent), while in Japan employment has declined by one per cent, as a consequence of the 2001 and 2002 economic crisis.
The changes of the rate of employment are directly related to the rates of employment growth, the largest expansion being, however, registered by Japan. After a large drop registered at the beginning of the '90s, Russia's rate of employment has recovered and in 2005 it was higher than in EU15 countries.
As a result of these tendencies, between 1985 and 2005, the two areas have registered Total Manpower Needs respectively of 22 and 8.6 million that were paralleled by the net inflow of 31 and 13 million immigrants (table 4). Between 2000 and 2005 in NWS the yearly average migration balance has been similar to that of the longer interval, while in EU15 countries, whose natural balance has become negative, it registers a notable increase. Japan shows a trend similar to that of the EU15 countries with a negative value over the 20 years interval and a slightly positive value in the last five years, notwithstanding the decline in employment growth and a small increase in the employment rate. Finally, Russia has registered relevant manpower needs in the long run that have been countered by more than six million immigrants; immigration has however slowed down in the last five years.
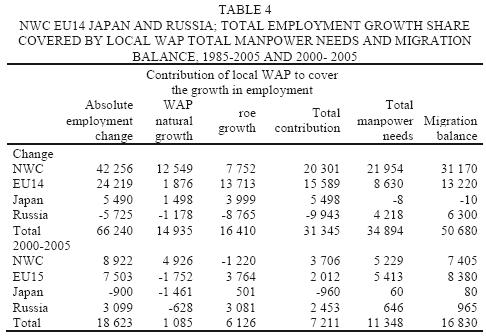
It must also be underlined that:
1. Between 1985 and 2005 the four countries taken together had an average yearly migration balance of 2.5 million and immigrants accounted for 69.1 per cent of the increase in WAP.
2. Between 2000 and 2005 the yearly migration balance has been equal to 3.4 million and has accounted for 93 per cent of WAP growth.
3. Migration has been above replacement level in all the cases in which the natural balance has been negative, the only exception being Japan between 2000 and 2005. However, in this period Japan has lost 900 000 jobs, while its WAP has declined by around two million.
The overall picture is coherent with the model proposed, net immigration inflows responding to the changes in employment needs in all the four cases we have taken in to consideration.
Equation [8] provides a simple formula for forecasting the level of immigration as a function of the rate of growth of employment and of the absolute change in the rate of employment. The table below reports the explicit form of equation [8] for each of the four countries we are considering.

The constant term represents the amount of migration required to keep both the employment level and the employment rate constant. NWC are the only case registering a positive natural balance in the 2005–2025 interval and, therefore, a negative value of the constant.
On the basis of the previous equations we have computed five scenarios. The first 4 refer to two possible values of employment growth:
• Zero employment growth.
• A growth equal to the one registered during the 1985–2005 period.24 And two alternative changes in the rate of employment:
• An increase equal to the one registered between 1985 and 2005.
• Zero increase.
We have also built an intermediate scenario (Sc. 3) assuming an employment growth equal to half of that registered between 1985 and 2005 and an increase in the employment rate of the local population equal to half of the value registered in the previous 20 years.25 The following prospect shows the values of the parameters used for each of the five scenarios for the four countries.
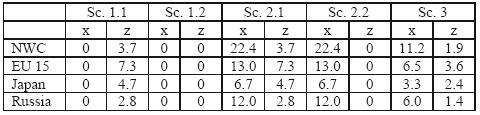
The five scenarios aim to provide a large range of Total Manpower Needs as function of employment growth and labor market participation. Scenario 1.1 depicts the situation that would prevail if the economic system would present periods of crisis and recovery bringing to an employment level equal to the initial one, while the participation of the local labor force increases to avoid immigration. It aims to provide the lowest possible migration estimate. In Scenario 1.2 we assume the same employment situation, but in this case the local population does not find any stimulus to increase its presence in the labor market. The manpower needs expressed by this scenario are equal to the Demographic Manpower Needs.
Scenarios 2.1 and 2.2 differ from the previous ones with respect to the employment trend that reflects what has happened in the previous twenty years. Scenario 2.1 is a trend scenario, and measures the total manpower needs in the case in which history would repeat itself, both for what relates to employment growth and change in the rate of employment. Scenario 2.2, in which local labour force participation is kept constant, aims to provide an estimate of the maximum possible value of immigration in the 20 year period of the scenarios.
Finally Scenario 3, that assumes a rate of employment growth and an increase in the rate of employment both equal to half of the values registered in the previous 20 years, provides a conservative estimate of what could happen in the four our countries if the global economy would register moderate economic growth and labour market participation would continue to expand, although at a lower rate.
Table 5 reports the values of the TMN for each scenario and country. The table also reports:
• The Manpower Needs generated by the Natural balance (A).
• The Manpower needs generated by the growth in employment (B).
• The manpower needs offset by the increase in local WAP participation (C).

The range of theTotal Manpower Needs of the four countries is very large, expanding from aminimum of –8.7 million in SC. 1.1 and amaximum of 108.3 million in SC. 2.2.
The NWC, on one side, and of Japan, on the other, represent the extreme cases.
As we have already noted, between 2005 and 2025, the natural balance of the NWC is expected to be positive. This implies negative Demographic Manpower Needs equal to –1.2 million (Sc. 1.2). If the labour market participation of the local WAP would increase, the TMN would be equal to –10.2 million (Sc. 1.1). The NWC are also those that are assumed to present the highest rate of employment growth. As a consequence, the TMN are equal to 27.5 million in the trend scenario and reach a maximum of 36.4 million in the case of constant labor market participation (SC. 2.2).
At the other extreme we have Japan that is expected to pre sent the highe st percentage natural decline of WAP. Accordingly, Japan is characterized by relatively very high Manpower Needs of Demographic origin (9.6 million) and its Total Manpower Needs would remain positive even with an increased labor market participation (6.3 million). It must be underlined that Japan is the only country where SC. 1.1 presents a positive value. In the trend scenario, the TMN would be equal to 10.5 million and reach 13.9 million if labor market participation of the local labour force would not increase.
EU15 countries are characterized by the highest DMN (12.7 million), but also by the highest potential contribution of the local labor supply (17.3 million). Therefore the TMN are negative in Scenario 1.1, but present the highest value in SC. 1.2 (12.7 million). The same large difference characterizes the scenarios with employment growth (17.4 million SC. 2.1 and 34.7 million SC. 2.2).
The case of Russia is similar to that of EU 15, with a very high DMN and a very strong compensatory power of the local labor supply.
Table 6 reports the migration balances implied by the TMN we have just commented. The intermediate scenario provides an interesting point of reference. In this scenario total net migration averages around 3.6 million per year, an amount in line with the 2000–2005 period. Given the increase in the rate of WAP decline that will characterize the 2005–2025 period and the conservative hypothesis on employment growth, the intermediate scenario does most probably indicate the minimum level of migration that we can expect in the interval we are considering. The values are obviously much higher in the scenarios with employment growth, both in the case of constant and increasing employment rate of the local WAP (around 8 million per year in the first case and almost 5 million in the second).

In evaluating these data it should be reminded that in Japan the 15–64 employment rate is already very close to the physiological level, while the margin of expansion in the other countries can be considered marginal, also in consideration of the fact that the employment rate of the 15–24 age group can not be expected to increase. In conclusion, these data suggest that, keeping everything else constant, the most probable average value of the total migration balance in the 2005–2025 interval will amount to six, seven million per year.
Table 7 reports the level of WAP in each scenario for the four countries. With the exception of the highly improbable case of constant employment and increased participation, WAP will increase. The increase will positively related to the rate of growth of employment and inversely related to the increase in local WAP presence in the labour market.

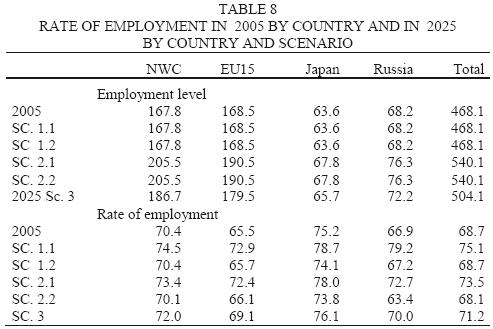
The previous WAP data and the employment levels, derived from the hypotheses on the employment rate of growth, allow computing estimates of the rates of employment (table 8). The rates of employment are directly related to those of the local WAP and inversely related to the reactivity of the migration balance to the TMN (β).
As final step of our procedure, we have computed for each country and scenario rough estimates of total population. In order to do so we have taken the estimates of the population 65 and older published by the Population Division. This choice is justified by the fact that over a twenty years interval different migration levels will affect the number of the elderly is aggregate only in a marginal way.
For what relates to the 0–14 age group we have adjusted the Population Division forecast multiplying it by a proportionality factor obtained dividing the number of immigrants of the scenario by the number of immigrants forecasted by the Population Division.26
As shown by table 9, total population increases in every country and in every scenario with some minor exceptions, Russia in scenarios 1.1 and 1.2 and EU15 in scenario 1.1.

In conclusion we can state that a consistent and prolonged decline of fertility below the replacement level will determine an increase in WAP and in Total population.
A comparison with the forecast of the Population Division
The results presented in the previous paragraph differ sharply from those of the Population Division.27
In the first place, according to the Population Division, the total migration balance of the four countries is expected to average only 2.3 million per year (a value lower than that registered between 2000 and 2005) and equal to less than half of the value we have suggested as the most probable, considering a realistic rate of employment growth and a limited increase in the participation of the local WAP (table 6).
In the second place, 58.3 per cent of the total migration balance would be absorbed by NWC, while EU15 would account for 37.5 per cent, Russia and Japan for 2 per cent each. In our intermediate scenarios, EU15 countries are the most important port of arrival, while the immigration share of NWC is not expected to be much larger than those of Japan and Russia. The scenarios 2.1 and 2.2 provide different percentage distributions of the total migration balance, but the common element is a rather large role of Russia and Japan (graph. 5).

These different forecasts of the migration balances end up producing very different demographic trends. According to the Population Division, in the next 20 years the total WAP of the four countries will remain basically constant (table 7) due to an increase of almost 29 million in the NWC and a similar decline in the other three countries (EU15 –1.9 million, Japan –11.9, Russia –14.4) (table 7). Total population is forecasted to expand by 70 million (table 9). Also in this case the increase is largely due to the NWC, whose Population is expected to increase by 67 million (18.8 per cent). Also the total population of the EU15 countries is forecasted to increase, although in a much more limited way (+19 million equal to five per cent), while Japan and Russia will loose, respectively, two and 14 million inhabitants (table 9).
Finally we must point out that, according to our interpretation of migration flows, these forecasts, far from being neutral, imply well–defined future trends of the main labor market variables, extremely different from country to country. In the case of NWC, for instance, the migration balance proposed by the Population Division corresponds to an employment growth of 11.1 per cent in a constant employment rate scenario, and to an employment growth if 5.8 per cent if we assume a growth of the employment rate in line with that registered in the previous 20 years. For EU15 countries the migration balance proposed by the Population Division corresponds to a 2.8 per cent growth in employment, assuming a rate of employment constant, and to a growth of two percentage points of the employment rate assuming no growth of the employment level. Finally, in the case of Japan and Russia, the forecasted migration balance would cover only less than 10 per cent of the demographic manpower needs.
Demographic and economic indicators of social burden
Demographic indicators
Between 1960 and 2005 the percentage of the elderly has more than doubled in all the countries we are considering. At the same time, the percentage of the young has strongly declined. According to the Population Division medium variant, between 2005 and 2050, the percentage of the young will remain substantially constant, while the percentage of the elderly will continue to increase, although at a lower rate. These data take a very dramatic look when filtered through the standard indicators of structural burden.
The indicators normally used to measure the structural burden generated by ageing are strictly demographic in nature: the Potential Support Ratio (PSR) is obtained dividing the Working Age Population by the number of elderly; the Age Dependency Ratio (ADR) is the reciprocal of the PRS. Table 10 reports the total and specific values of the ADR, expressed for thousand people in WAP for four years: 1960, 2005, 2025 and 2050.

Between 1960 and 2005, the value of the total ADR has declined in all four countries due to a decrease of the relative weight of the young more pronounced than the increase registered by the elderly. Therefore, according to this indicator, developed countries have registered a notable decline of the structural burden particularly pronounced in the NWC and in Russia. In 2005 the values are included between a minimum of 406 in Russia and a maximum of 509 in Japan.
The situation presents a dramatic change in the following 45 years. All four countries register dramatic increases of the structural burden, particularly pronounced in Japan (from 509 to 963), in EU15 (from 508 to 772) and in Russia (from 406 to 656), the NWC being the less affected (from 492 to 576). As shown by graph 6, the increase of the ADR is determined mainly by the dynamic of the elderly and this explains why Japan, that will register the most pronounced ageing process due to a dramatic decline of its WAP, is expected to be the country most affected by the phenomenon.

The economic indicators
The employed produce the income that sustains themselves and the remaining population, while the WAP includes a percentage of people (students, retiree, housewife's) that do not support, but are supported. It is, therefore, evident that purely demographic indicators can be totally misleading.
The choice of WAP as the denominator or the numerator of the demographic indicator of structural burden reflects a historical phase characterized by an almost total coincidence between active population and WAP and in which information on employment levels were absent or were collected only every ten years by censuses.
Therefore, while the use of demographic indicators can still be justified in countries that do not have reliable employment data, it is totally inappropriate when considering developed countries where:
• Only one part of WAP, often less than 60%, has a formal job.
• Estimates of the level, structure and tendencies of employment are available almost in real time.
• The duration of the training phase of life has greatly increased and, on the average, the age of entry in the working phase of life is above 20.
• Differences in education laws, economic and social development, productive specialization and technologies cause different percentages of students, housewife's and unemployed.
An economic indicator of structural burden that does not have the shortcomings indicated above and can therefore capture the socio–economic characteristics of modern societies, can be computed substituting WAP with employment.28 Such an indicator allows:
• To articulate the structural burden by the typology of the dependants: students, non labor force in working age, unemployed, and retirees.
• To verify how much the changes in the structural burden are due, on one side, to demographic tendencies and, on the other, to the capacity (or lack of capacity) of the economic system to generate additional employment.
• To estimate the growth of employment, and therefore of production, needed to obtain a given level of structural burden.
Table 11 reports the economic indicators for the four countries in 2005 and in 2025 in the five scenarios presented in the previous paragraph. In order to avoid the complex task of forecasting the number of students, we have chosen to use the data for the 0–14 age group. Therefore, a large portion of students is included in the inactive in working age.

According to the economic indicators, in 2005 the relative situation of the for countries was radically different from the one depicted by the demographic indicator. Japan, with the highest employment rate, was the country with the lowest economic structural burden, 1000 Japanese workers having to sustain only 1005 dependent. EU15 countries presented the worst situation with 1301 dependents per one thousand workers. Russia and NWC occupy an intermediate position with 1,118 and 1,126 dependents per 1000 workers, respectively.
Coming to the forecasts for the single countries, the intermediate scenario is sufficient to better the economic indicator in EU15 and Russia. In EU15 countries the increase in the number of the elderly is more than offset by the decline of the young and inactive in working age. In Russia a moderate increase of the young and of the elderly is more than counterbalanced by a decline of the inactive. In both countries the trend scenario would bring to a strong decline in the total structural burden, while an increase in employment not accompanied by an increase in participation slightly worsen the 2005 situation
In NWC all scenarios determine a slight worsening of the 2005 situation, mainly as a consequence of a notable increase of the elderly. However in the trend scenario the worsening is marginal (16 points).
In Japan the increase in the number of the elderly is really massive determining an increase in the structural burden of 115 points. However, if the trend scenario would prevail in all countries, in 2025 the structural burden of Japan would remain slightly lower than that of Europe and NWC, while Russia would notably better its situation and become the country with the lowest structural burden.
In conclusion the use of a correct indicator suggests that:
• The dynamic of the structural burden must not be seen as a purely demographic phenomenon, but also and mainly as an economic problem.
• The increase in the percentage of the elderly, and more generally of the dependants, can be offset by an analogous increase in the level of employment.
• The increase in the structural burden can also be partially offset by an increase in the rate of employment that generates a decline in the percentage of the inactive in working age.
The transition from departure to arrival country: a foreseeable phenomenon
In the first half of the 1970s Portugal, Spain, Italy and Greece registered an inversion in the sign of the migration balance. This historical event came as a big surprise not only to the citizens and the politicians of these countries, but also to demographers and economists that had not foreseen the phenomenon. Since immigration started to take place in the presence of unemployment, the prevailing explanation offered at that time were based on ad hoc considerations and modifications of the immigration laws in arrival countries. With only a few exceptions29 this way of explaining migration flows has continued to prevail in the following years contributing to produce wrong immigration and demographic forecasts, to justify restrictive immigration policies and, as a final result, to provoke illegal immigration.
Using the model we have just presented we can argue that the inversion of the sign of the migration balances of the countries in the Northern shore of the Mediterranean was due, on one hand, to the exhaustion of their migration potential and, on the other hand, to the appearance of a lack of labour supply in occupations with low professional content and of a labor demand aimed to exploit cheap illegal foreign labour in agriculture and construction (Bruni, 2008).
If we focus on the future, our model brings us to argue that numerous countries that have registered below replacement fertility for at least 15 years and whose WAP will therefore decline at an increasing rate in the near future will witness an analogous phenomenon, sometime in the next 25–35 years.
Table 12 reports the demographic evolution of five countries that are going to be interested by a massive natural decline of WAP and for which the Population Division forecasts a negative migration balance for the 2005–2050 period. The overall decline of the WAP of these five countries is expected to be of around one third, with a maximum of 44.2 per cent in Bulgaria and a minimum of a little less than 30 per cent in Korea and Cuba. At the same time, according to the Population Division forecast, these countries are expected to generate 1.5 million migrants. The right section of the table shows the labor market implications of such a decline in the following three alternative scenarios:
• S1 – Constant rate of employment.
• S2 – Constant level of employment.
• S3 – 10 per cent increase in employment and convergence of the employment rate to 70 per cent.
In order to keep the rate of employment constant (S1), these countries would have to destroy a percentage of jobs equal to the percentage decline in WAP, for an overall total of almost 19 million (7.5 of which in Ukraine and 6.8 in Korea). It is evident that such a scenario implies a prolonged and devastating economic crisis.
Alternatively, in order to keep the level of employment constant (S2), the rates of employment would have to increase above the physiological level. It must also be underlined that a constant employment level requires a growth in productivity equal to the growth in production, a result that no developed country has registered in the last 60 years and appears unattainable in post industrial economies, characterized by the presence of a service sector weighting around 2/3 of total employment.
Finally, a more realistic situation of moderate long run employment growth (10 per cent in 45 years) paralleled by the convergence of the employment rate to 70 per cent (S3), generate a positive migration balance of 31 million, 12 million of which in Ukraine and 12.7 million in Korea.
In conclusion, outside a scenario of catastrophic economic crisis, in the next 25–30 years, the sign of the migration balance of these countries will have to turn from negative to positive. The same conclusion applies to other transition countries like Bosnia and Herzegovina, Croatia, Latvia, Lithuania, Macedonia and Moldova that will face consistent declines in WAP and for which the Population Division has forecasted negative migration balances.
In the other transition countries affected by a pronounced WAP natural decline and for which the Population Division forecasts a zero or slightly positive migration balances, the third scenario shows that net immigration flows will necessarily be much more pronounced.
In conclusion, according to our model, all European transition countries will start to register positive migration balances between 2025–30 and the whole European region will become an area of massive immigration.

Migration flows and demographic transition
In his monumental work on transition theory, Chesnais observed that migration "is silent about the regulative role of external migrations" (Chesnais, 1986). Chesnais did, however, point out the correspondence between the intercontinental migration flows of the XIX century and the peak in population growth in European countries. More recently, demographic analysis has, on the contrary, failed to take notice of the correspondence between the increase in migration flows that has taken place starting at the end of the '80s, and the ongoing decline in fertility below replacement level affecting numerous industrialized and developing countries. This is not surprising since the observation of Chesnais was in line with the explanation of migrations flows from the supply side, privileged by demographers, while a correct interpretation of the second event requires an interpretation of migration from the demand side, an interpretation that has never found much credit neither between demographers nor economists and even less between politicians.
Historically, migration has represented a major topic of demographic analysis and demographers are still the leading authority in the field. However, coherently with the mainly descriptive nature of their discipline, demographers have never proposed full–fledged migration models, analyzing migration flows mainly from the supply side, great attention being given to the reasons determining departures and very little to the choice of the country of destination. Moreover, given the hypothesis of equilibrium underlining transition theory, the labor market consequences of a structural decline in WAP have been considered only very recently and generally cast aside with rather superficial considerations.
Economists have discovered migration only at the end of the '50s (Lewis, 1954). The atomistic, hedonistic and rationalist nature of the neoclassical model (Ward, 1972), and more specifically of the human capital theory on which economic migrations models are based, has brought also economists to analyze mainly the supply side of the problem and to propose models that define under which conditions migration outflows take place and which people are more affected by it. Moreover, economists have been prevented from considering the case of a structural lack of labor supply by the hypothesis, underlying the neoclassical labor market model, that the real wage equates labor demand and supply. It should also be reminded that economic theory, and more specifically growth theory, was developed in periods of demographic growth when the core problem was unemployment and the idea of a structural lack of labor supply was almost unconceivable.
In conclusion, although for different reasons, both demographers and economists have never seriouly considered the possibility that a country could face a structural lack of labor supply due to the decline in fertility.
This paper has suggested that the decline of fertility well below replacement level for a prolonged period of time determines a structural lack of labor supply that will necessarily provoke immigration flows above replacement level. In a larger vision this approach suggests that the passage from a regime of high fertility to a regime of below replacement fertility provokes the passage from a situation of potential structural excess to a situation of potential structural lack of labor supply. It therefore suggests that the fertility transition originates the necessary, although not sufficient, conditions for sustained international migrations.
In a first phase of the demographic "transition" the decline in mortality, mainly children's mortality, provokes a progressive increase in the number of people who enter the working phase of life. The resulting increase in the number of women in fertile age contributes, in its turn, to increase the number of births. In due time, as a consequence of these two subsequent phenomena, the natural balance of WAP acquire positive and increasing values and WAP enter a long phase of expansion, generally above the attainable rate of employment growth. Therefore, the normal outcome of this phase of the demographic transition is the creation of a migratory potential of increasing size that represents the necessary precondition for migratory flows.
During the XIX century and up to the Great Depression the fast economic growth of Australia, North America and South America and the work possibilities they offered attracted the migratory potential that was accumulating in the countries that had first entered the demographic transition and whose economic development had not been sufficient to generate a rate of employment growth coherent with the growth in potential labor supply. This is the phenomenon noticed by Chesnais.
As a consequence of the decline in fertility that characterized the period after the Great Depression, of the death toll paid in WW2 and of the economic boom of the '50s and '60s, also Belgium, France, Germany and Switzerland and later on Northern Italy started to present a structural lack of labor supply and joined the countries of the New World as areas of arrival, attracting mainly the migratory potential present in Southern European countries and Southern Italy where a still large and underdeveloped agricultural sector provided a relevant reservoir of excess supply of labor.
This new emigration wave progressively exhausted the migratory potential of the countries in the Northern shore of the Mediterranean. Moreover, during the '70s and the beginning of the '80s the entries in WAP of the large cohorts born during the baby boom that characterized the second part of the '50s and the beginning of the '60s, together with the economic downturn determined by the oils crises, greatly reduced the need of foreign labor in many countries of arrival. The lack of models positing an interaction between the demographic sphere and the labor market, both in departure and arrival countries, prevented, as we have already seen, demographers to foresee the change in the sign of the migration balances that took place in all South European countries in the first half of the '70s. Later on, both economists and demographers attributed the phenomenon mainly to the introduction of the first restrictive migration laws in Europe and in the United States.
Starting at the end of the '80s, the accelerated decline in fertility that took place after 1965 began to affect the entries in to WAP in an increasing number of developed countries. The great articulation of occupations induced by technological innovation and the increase in the educational level of the generations entering the labor market provoked the appearance of a structural lack of labor supply for non qualified jobs, even in a situation of relevant unemployment. This gave support to the prevailing and mainly ideological position that immigration was determined by the supply side, an interpretation that was supported by the lack of job opportunities and growing poverty that characterized developing countries.
The role played by the demographic transition in creating the simultaneous presence of situations of structural excess of labour supply and structural lack of labour demand in different areas of the world is illustrated by the evolution and forecast of WAP in developed, developing and underdeveloped countries over the 1950–2050 period.
The world WAP will continue to increase up to 2050, but the yearly average increase is expected to progressively decline from a maximum yearly value of almost 70 million, reached between 2000 and 2005, to less than 10 million between 2045–2050. This represents by itself an extraordinary change. While, at present, to keep the world employment rate constant total employment should increase by 1.8 per cent per year, between 2045 and 2050 the same result could be reached with an employment growth of 0.2 per cent. This could largely increase the probability to find a job for the generations entering the working phase of life in that period, if the free circulation of the world WAP would be allowed.
The situation is, however, much more articulated. If we limit ourselves to consider the standard aggregation of countries according to the level of economic development, we observe that Developed countries are now entering a phase of declining WAP, Developing countries have reached the point of maximum increase (55 million per year), while in the least developed countries the natural balance will be characterized by increasing values until around 2045 when it will peak at 15 million.

Also this picture is too aggregate to fully capture reality since a large number of developing countries including China, India, Bangladesh, Iran, Indonesia, Thailand, Vietnam and Turkey in Asia, Cuba, Brazil and Chile in Latin America, Algeria, Lybia, Morocco and Tunisia in Africa, are expected to enter the Area of Potential Demographic Decline before 2050. According to the medium variant, in 2050 this area will include 98 countries, totaling 2/3 of the world WAP. Between 2045 and 2050 in this area the total natural balance of WAP is expected to amount to around –14 million per year, while the WAP of the remaining countries will increase at a yearly average rate of around 24 million.
Therefore, these data strongly suggest that, before the second half of the century, the Total Manpower Needs of the countries with declining WAP will tend to correspond to the marginal structural excess of labour supply of the poorest countries. Moreover, we can expect that present arrival countries will progressively loose their relative weight, some departure countries will became arrival countries, while countries that at present do not produce migrants will become the new labour reservoir of the world.
Table 14 report some very suggestive data. Between 2045 and 2050, 47 per cent of the natural decline in WAP will be located in Asia, around 20 per cent in Europe and around 11 per cent in America.

China leads the ranking with a weight of almost 36 per cent (table 15); Brazil and Russia are second and third and the three countries taken together account for more than 50 per cent of the total natural decline of WAP. Of the twenty–two countries, whose absolute value of the yearly natural balance exceeds 100,000, only eight are in Europe; the United States rank seventh, immediately before Indonesia, but after Iran; Canada is at the 16th place preceded by Bangladesh and Turkey; the situation of France is similar to that of Algeria, while Myannar, the last of this group, precedes the UK.

From a long term perspective, the basic point is that the different periods in which the decline in fertility has been taking place in different part of the world has determined, is determining and will determine the simultaneous presence of countries characterized by a structural lack of labour supply and of countries characterized by the presence of a structural excess oflabour supply, putting the necessary conditions30 for migrations flows of increasing size to take place.
At pre sent, the negative natural balance registered by numerous European countries, and other developed countries is paralleled by the presence of a huge migratory potential in developing countries. In the second half of the century the structural lack of labor supply will spread, as we have just seen, in a growing number of developing countries, first of all China, while a large excess of labor supply will be concentrated in a declining number of developing and underdeveloped countries.
Some summary considerations
The main thesis of the paper is that the positive and increasing migration balances that are affecting numerous developed countries are provoked by a structural lack of local labour supply, in the presence of an unlimited supply of labour in developing and underdeveloped countries. We have shown that both the structural lack of labour supply and the structural excess of labour supply are the consequence of the decline in fertility that is affecting, although with different timing, almost all the countries of the planet.31
A simple econometric test has provided strong evidence that migrations are, in fact, explained by demand, and that the migration balances of arrival countries tend to be in excess of their manpower needs since migrant workers move with or are followed by family members.
The utilization of a new forecasting logical frame, specifying the interrelationship between the demographic and economic spheres, has then allowed to jointly build demographic and labour market scenarios. A series of relevant conclusions have been derived from this exercise.
The most important one is that the catastrophic decline in WAP forecasted by the main international and national institutions will not take place; on the contrary, the WAP of the countries characterized by below replacement fertility will increase. Since the size of the migration balance is directly related to the decline in WAP and to the increase in employment, the rate of growth of WAP will also depend on the rate of economic growth. The increase in WAP, together will the increase in the number of births brought about by migrations and the natural process of ageing, will then produce an increase in total population.
In conclusion, the Area that at the beginning of the paper we have called the Area of the Potential Demographic Decline (APDD) can now be defined more correctly as the Area of Potential Demographic Growth (APDG).
The scenarios have also suggested that in the next 50 years the total number of people that will migrate for economic reasons will be at least around 250–300 million, a much higher figure than the around 100 million forecasted by the United Nations. Moreover, according to our model, in the next 20–30 years, numerous countries (including Eastern European transition countries, Korea and Cuba) will switch from the group of departure countries to the group of arrival countries. Finally, we have seen that, before the middle of the century, a large number of countries will enter the Area of Potential Demographic Growth.
This obviously implies that the structure of migrations flows by origin and destination will also register numerous and relevant changes. The new pattern and its timing will depend not only on demographic trends, but also and mainly on the economic growth that will be registered by developed and developing countries.
The implicit message of the standard demographic projections is that the future they present is inevitable, since it depends only on past trends and is not connected to the economic sphere. As we have already underlined, up to now politicians, and unfortunately also economists, have not questioned the realism of these projections and are using them to plan economic policies.
The explicit message of this paper is that if it is true that the level and structure of a population are strongly influenced by past trends in fertility, there is large space for migratory, social and economic policies aimed to shape the demographic structure of a country.
Policies suggestions
The picture of the future demographic trends of our planet presented in this paper brings to the forefront new problems, while shedding a different light on others. Past experience shows that migration flows can offset the lack of local labour supply. However, migration flows alone will not be sufficient to solve all the problems created by the decline in fertility. More specifically, we have to analyze, together with the appropriate migration policies necessary to correctly face the lack of local labour supply, the problems of structural burden and demographic unbalance.
Structural lack of labor supply and immigration flows
An interpretation of migration largely based on the supply side and accompanied by the fear of an invasion of foreign workers, together with the lack of instruments to estimate the need of foreign labour has brought arrival countries to approve and try to enforce yearly migration quotas far below the manpower needs of the labor market. However, manpower needs cannot be cancelled by law. These measures have, therefore, determined illegal immigration, followed by expensive and politically–difficult to promote procedures of legalization only once the market had clearly shown that in fact those illegal immigrant were already employed and needed by the productive system.
This approach has obvious advantages for some economic actors. In the first place, it allows the labour intensive sectors, like construction and agriculture, to exploit cheap labour. Moreover, as the present global crisis is showing, immigrants, and especially illegal immigrants, represent a buffer for local workers in period of recession. It also allows governments to take a conservative standing on the migration issue necessary not to loose the consent of large shares of the population ideologically adverse to immigration. However, it also has numerous drawbacks. In the countries of arrival it can reduce the incentive to technological innovations allowing companies to pay wages far below the market value. It implies the high cost of trying to prevent illegal entries and expel illegal immigrants, often needed by the labour market. It has, moreover, an extremely large human cost represented by an unknown, but certainly extremely high numbers of deaths of young people and children trying to illegally cross the borders, the annihilation of small fortune accumulated by family and clans in order to allow a family member to open the road for a better life in a new country, the destruction of dreams and hopes.
The first action that the countries with below replacement fertility should, therefore, undertake is to establish migration quotas coherent with the manpower needs of their labor markets. The methodology proposed in this paper represents a possible starting point to build more refined models capable to evaluate the level of net migration required by each country and its structure by educational level and occupations.
The problem is however more political than methodological and technical. The solution we are suggesting requires understanding, on one hand, that the decline in fertility makes migrant workers indispensable to the functioning of the labour market and to economic growth, on the other, that many solutions proposed up to now can not solve the problem. More specifically, the structural character of the natural decline of WAP rules out the possibility that an increase in productivity or a larger participation of the secondary labour force could reduce or annul the need for foreign workers.
The first solution would imply an increase in productivity in excess of the increase in production equal to the decline in WAP. Taking the extreme case of Japan, in the next 40 years the growth in productivity would have to exceed the increase in production of around 41 per cent, a result totally out of reach in a post industrial economy, even if as tachnologically advanced as Japan. The increase in the level of participation of women and older age groups, a solution proposed over and over by demographers and International organizations,32 could represent a temporary solution only for countries with low participation rates. Even in this case very simple computations can show that the need of foreign labour could be offset or reduced only for a few years and then migration would again become unavoidable. Moreover, in order to increase the participation of the secondary labor force, and especially of women, it would be necessary to implement programs extending the social services for children and for the elderly, programs that not all countries are willing or capable to adopt.
Therefore, although increases in productivity and participation should be actively pursued, immigration represents the only long run possible solution33 to the structural lack of labour supply, while the existence of an unlimited excess supply of labor in many developing and underdeveloped countries ensure that this solution will find no bottlenecks in the international labor market.
Structural burden
The implication of the decline in fertility that has more attracted the attention of economists and politicians is represented by ageing and by its consequences on the welfare systems. We have argued that the perception of the gravity of this problem has been enhanced and in certain cases totally distorted by the use of wrong indicators.
The choice of an economic indicator "measuring" the structural burden in relation to employment has allowed showing that, contrary to the normal perception, the present values are included in an acceptable range. Moreover, the specific ADR values show that the most relevant contributions to the total structural burden do not come from the elderly, but from the students and the inactive.
An intuitive implication of the economic indicator is that the structural burden is not generated only by demographic trends, but also by economic trends. In fact, according to this indicator, the structural burden increases only if the rate of growth of the dependant population is higher than the rate of increase of the employment level and this is obviously true also for the specific indicator associated to the elderly. Moreover, an increase in the employment rate has an indirect positive impact on the structural burden since it reduces the number of inactive.
Given these general indications, we must however remember that the higher the rate of growth of employment, the higher the net inflow of immigrants and larger their future impact on the number of elderly. This suggests that the dynamic of the structural burden should not be considered as a variable to be forecasted, but as a policy target to be defined together with the rate of employment growth, using forecasting models allowing to relate employment growth to immigration and immigration to the change in the population structure.
Inside this frame a relevant reduction in the structural burden due to the elderly can derive from a redefinition of working age. The present definition of working age between 15 and 64 is already out of touch with reality and its use to analyze the structural burden in 2050 totally unrealistic. In all developed countries the average age of entry in the working phase of life is already above 20. At the same time, life expectancy is expected to notably increase. Although there is no scholarly agreement on the question whether human life does have a physiological upper limit, it would seem realistic to assume, on the basis of the most recent trends, that it will continue to increase in the next 50 years. My personal guess is that around 2050 working age will be defined between 25 and 75. This does imply that at that moment the most relevant group of dependant will be represented not by the elderly, but by the young people in the training phase of life.
The demographic disequilibrium
A fertility rate below replacement level does necessarily lead to the progressive decline of a closed population and eventually to its disappearance (Bourgeois–Pichat, 1988: 9–44). If the immigration model we have proposed is correct, the ultimate result of fertility decline will be totally different: the WAP and the total population will increase due to the inflows of immigrants. The inevitable byproduct will be a progressive expansion of the population born abroad and the creation of a multiethnic society.
This event has been evaluated in very different ways by different authors. Some have stressed the danger of a complete disappearance of the indigenous population and the consequent loss of the original identity (Coleman, 2002 and 2000). Others have argued that this process will also have positive effects since it will reduce cultural provincialism giving to the host country a cosmopolitan dimension and promote a healthy self–criticism. Moreover, with time immigrants, no matter what the official position of the host country regarding integration is, will end up identifying themselves with the country in which they live and with its history, inclusive of the enrichment process brought about by migratory flows. It has also be pointed out that in order to properly assess the effects of mass migration we have to consider not only the percentage of people born abroad, but also the cultural distance of the immigrants, the level of tolerance of the country due to its immigration history, the indifference to the problem generated by individualistic liberalism or by the concentration of immigrants only in a few areas of the country (McNicoll, 2000). On this respect, our analysis has shown that the origin of the immigration flows will drastically change, probably in the direction of increasing cultural distance.
It would seem, therefore, probable that even discounting for possible positive long–run effects, the social, cultural and political impact of mass migration will represent a serious issue that developed countries should start to consider immediately in order to devise and adopt suitable polices.
To put this problem in a correct perspective we have also to consider the probable duration of mass migration for the countries with below replacement fertility. One important implication of our model is that positive migration balances will continue to be needed not only as long as the natural balance of WAP will be negative, but as long as the natural balance will not be sufficient to cover the manpower needs determined by the growth in employment. In other words, to avoid the social and political tension created by a structural need of foreign labour and at the same time allow for economic growth, the number of entries in to WAP has to become and remain higher than the number of exits, due to death and ageing, the size of the difference depending on the rate of employment growth. This seems to me the main long–run problem that the countries characterized by below replacement fertility will have to face.
At present there is an almost total agreement between demographers that the TFR of developed countries will not substantially increase.34 This assumption does, however, discount, on one hand, the hypothesis that the fertility of migrant women does immediately converge to the fertility of the local women and, on the other, the fact that migration flows are largely underestimated by the standard model.
If our approach is correct, the great majority of developed countries will be affected by migration flows much more relevant than those presently forecasted. For what attain to the assumption of fertility convergence, it is interesting to remember the justification given by the population Division:
The projection methodology also assumes that, after immigrants arrive in a country, they experience the average fertility and mortality conditions of that country. While this is typically not the case, especially when immigrants come from a country that differs greatly in a demographic sense from the receiving country, this assumptions permits computations to be more straightforward and also facilitates comparisons between countries (Population Division, 2000: 15).
In fact, as the growing literature on the subj ect has shown, the relationship between migration and fertility is a complex one. The prevailing idea is that migrants' fertility will tend to converge to that of the local population. A series of alternative, although not conflicting, hypotheses, have been advanced to explain this process the most important ones being selectivity, adaptation, socialization and disruption.35 It has also be maintained that the fertility differential does not depend on the nationality, but on the different socio–economic composition of the two groups, i.e. on the fact that women migrants are in general less educated and qualified than national women.
The different interpretations of the fertility pattern of migrant women imply different timing of the convergence, but the fact remains that for a certain period of time, possibly up to a generation, the contribution of immigrant women to the number of births does normally largely exceeds their demographic weight. Although comparative international data are lacking, the phenomenon is clearly signalled by many national statistics and local studies36 and it is evident that the contribution of foreign women to the level of the TFR, limited up to now because of the dimension of immigration flows, could become critical. An evaluation of this phenomenon is complex and largely exceeds the possibility of a single researcher since it involves for every country not only scenarios more sophisticated than the ones presented here, but also hypotheses on the structure of immigrants by nationality, sex and age, and on the fertility rates and patterns of the single ethnic groups.
However, a possible outcome of our model, one that would seem to deserve special attention, is that countries characterized by a strong demographic decline and high employment growth would receive immigration flows large enough to provide a substantial contribution to reach the number of births necessary to annul the structural need of immigrants.
In conclusion, a possible implication of our analysis is that the demographic transition could after all bring to a demographic regime of equilibrium. However this would not derive from the impact of socioeconomic factors, but from immigration.
A world labour market
A major implication of the model presented in this paper is that this century will witness migration flows of unprecedented size made necessary and unavoidable by fertility decline and economic growth. In other words that the XXI century will be the Century of the Great Migration.
It will be up to the governments and hopefully to International organizations to decide if such a process will take place inside a well–planned and legal framework or illegally. It has been correctly argued that illegal migrations are the result of the functioning of the labour market and that the restrictive policies enacted by the governments of developed countries are expensive and useless efforts to try to prevent it (Harris, 2004 and 2002). However, to imagine that the principle of free circulation of labour could be accepted today is unrealistic, but we can hope that the necessities and the logic of the market will end up imposing themselves and that the next generations will learn to live in a world characterized not only by the free circulation of products, but also of people.
Conclusions
The arguments presented in this paper can be divided in to three main groups.
The first group includes statements that it will be easy to falsify or corroborate in not too far a future. This group includes the relationship between net migration and manpower needs and the related question whether a decline in fertility below replacement will produce a decline or an increase in WAP and, therefore, in total population. It belongs to the same group of propositions also the rough estimate of the level of international migrations I have suggested, together with the indication that the number of arrival countries will progressively increase so that entire continents like Europe, and large parts of Asia, America and Oceania will become and continue to be for a number of years, at present impossible to forecast, areas of arrival.
If my argument is correct, as I strongly believe, the procedures adopted to produce demographic forecasts should be changed along the line of the logical system proposed here. The question is extremely relevant because the social, economic and demographic policies to be adopted in the two events are obviously very different, but both situations require structural and long run interventions.
For what relates to international migration, if my estimates will prove to be correct, the problem of forecasting manpower needs, establishing coherent quotas and define correct migration procedures deserve to become a relevant international issue to be confronted together by arrival and departures countries, on the basis of international scenarios that only Institutions like the Population Division and the International Labour Office could provide. This seems, at present, the most rational way to face the problem of illegal immigration and exploit the convergence of interests that the simultaneous lack and excess of labour supply will create, providing arrival countries with the labour force indispensable for their economic growth and departure countries with relevant amount of remittances that could play a key role in promoting development while emigration could notably reduce labour supply pressure.
A second group of statements relates to issues that need to be confronted much more thoroughly both at the historical and local level and through the development of formal models. It has been shown that employment growth is the key factor to keep the structural burden under control, but also that employment growth generates net migrations above replacement level and will therefore contribute to notably increase the number of the elderly. At the same time, a selective mass migration policy could contribute to increase the number of births and therefore reduce, in due time, the unbalance between entries in to and exits from WAP, and therefore the manpower needs of demographic origin. This complex set of relationship should represent a relevant area of theoretical and empirical analysis greatly needed to connect development policies, migration policies, the reforms of the welfare system and the restructuring of the phases of life that will be imposed by the prolonging of the training phase and the lengthening of life expectancy.
The third group of arguments involves the relationship between fertility decline and what I have suggested to be its by–product, the migration transition, in order to evaluate and eventually reformulate demographic transition theory. In 1982 Caldwell remarked "Classical demographic transition theory assumed that replacement level was the end product of the transition ... Yet there is nothing in (my) analysis to suggest any reason why there should be such a floor to fertility decline... My best guess... is for declining population in all (Western) countries by the early 21st century... and in the world as a whole... by the end of that century (Caldweel, 1982).
In a similar vein in 1997 Caldwell, Jones and Douglas (1997: 3) stated:
... the convenient assumption that the end point of the demographic transition can be marked by replacement–level fertility has now been replaced by great uncertainty over whether there is indeed any endpoint. The low population growth rate attained at low levels of fertility and mortality may represent not an endpoint, but rather a transition zone en route to massive population decline resulting from well below replacement–fertility.
I am personally convinced that at present developed economies lack self–regulating mechanisms capable of bringing the demographic system toward a situation characterized by similar values of births and deaths. In modern societies fertility is more and more the result of choices made by the couples in relations to their goals and values. Social and economic considerations strongly support the hypothesis that below–replacement fertility represents the most obvious and reasonable outcome of this situation. At the same time, life expectancy depends in a crucial way on scientific progress. In a moment in which genetic is at its beginning and the production and utilization of spare parts is becoming more and more relevant, to suppose that the growth in life expectancy we have witnessed in the XX century will decline appears unreasonable.
The question we have raised is whether and in which measure mass migration could contribute to face the demographic unbalance of developed countries. Given the present estimates of future migration and the political overtones of the argument no analysis of this subject has yet been undertaken. It seems to me that such a topic should deserve more attention both at the national and international level.
It is possible that in around 50 years the growth of the world WAP and therefore of the potential labour supply will be matched by global employment growth. However, according to our analysis, an increasing number of countries will need the excess labour generated by a progressively decreasing geographical area of the world. The final question to which the future will have to answer whether this hard fact will be sufficient to reverse the present trend toward more and more repressive migration policies, if the imperatives of the market will prevail over wrongly perceived national interests and their by–products, racism and exploitation of the immigrants.
Bibliography
BIJAK, J., D. KUPISZEWSKA, M. KUPISZEWSKI y K. SACZUK, 2005, Impact of international migration on population dynamics and labour force resources in Europe, Working paper, 1, Central European Forum for Migration Research. [ Links ]
BONIFAZI, C. y G. GESANO, 1994, "L'immigrazione straniera tra regolazione dei flussi e politiche di accoglimento, in A. GOLINI, Tendenze demografiche e politiche per la popolazione, Terzo Rapporto IRP, Bologna, Il Mulino. [ Links ]
BOURGEOIS–PICHAT, J., 1988, "Du XX au XXI siecle: l'Europe et sa population apres l'an 2000", en Population, 1. [ Links ]
BRUNI, M., 1988, "A stock flow model to analyse and forecast labour market variables", en Labour, 1. [ Links ]
BRUNI, M., 2008, Il boom demografico prossimo venturo. Tendenze demografiche, mercato del lavoro ed immigrazione: scenari e politiche, Dipartimento di Economia politica, Universita' di Modena e Reggio Emilia, Materiali di discussione. [ Links ]
BRUNI, M., 2009, Demographic and labour market scenarios for Moldova: 2008–2023, Working Paper, Budapest, ILO. [ Links ]
CALDWEEL, J. C., 1982, Theory of fertility decline, Academic Press. Nueva York. [ Links ]
CARONE, G., 2005, Long–term labour force projections for the 25 EU Member States: A set of data for assessing the economic impact of ageing, European Commission, Directorate–General for Economic and Financial Affairs, Economic papers, 235. [ Links ]
CHESNAIS, J. C., 1986, La transition demographique. Etapes, forms, implications economiques, PUF, Paris. [ Links ]
COALE A. J., 1986, "Demographic effects of below replacement fertility and their social implications", en Davis K., M BERNSTAM, R. RICARDO–CAMPBELL, Below–replacement fertility in industrial societies. Causes, consequences, policies, Cambridge University Press. [ Links ]
COLEMAN D, A., 2002, "Replacement migration, or why everyone is going to have to live in Korea: a fable for our times from the United Nations", en Philosophical Transactions of the Royal Society B, 357. [ Links ]
COLEMAN, D. A., 2000, "Who's afraid of low support ratios? A UK response to the United Nations Population Division report of 'Replacement Migration", paper presented at the Expert Group Meeting on Policy Responses to Population Ageing and Population Decline, United Nations Population Division, New York, 16–18 October. [ Links ]
DAVIS, K., M. BERNSTAM,y Ricardo CAMPBELL, 1986, Below–replacement fertility in industrial societies. Causes, consequences, policies, Cambridge University Press. [ Links ]
FUÀ, G., 1986, Conseguenze economiche dell'evoluzione demografica, Il Mulino, Bologna. [ Links ]
GOLINI, A., 1986, "Panorama dell'attuale evoluzione demográfica", en G. FUÀ, Conseguenze economiche dell'evoluzione demografica, Il Mulino, Bologna. [ Links ]
GOLINI, A., 1988, "La popolazione italiana. Una visione d'insieme", en CNR e IRP, Secondo Rapporto sulla Situazione Demografica in Italia, Roma. [ Links ]
GOLINI, A., 1994, Tendenze demografiche e politiche per la popolazione, Terzo Rapporto IRP, Il Mulino, Bologna. [ Links ]
GOLINI, A., 1999, La popolazione del pianeta, Il Mulino, Bologna. [ Links ]
HARRIS, N., 2002, Thinking the unthinkable, I.B. Tauris & Co Ltd. Londres. [ Links ]
HARRIS, N., 2004, "Migration is the factor which makes economic growth possible", en SHS newsletter 05. [ Links ]
ILO, 2008, Estimates and projections of the economically active population: 1980–2020. Methodological description. [ Links ]
ISTAT, 1997, Previsioni della popolazione residente per sesso, eta' e regione –Base 1.1.1996, en Informazioni, núm. 34. [ Links ]
ISTAT, 2001, Previsioni della popolazione residente per sesso, eta' e regione dal 1.1.2001 al 1.1. 2051. [ Links ]
ISTAT, 2004, Natalita' e fecondita' della popolazione residente: caratteristiche e tendenze recenti. [ Links ]
ISTAT, 2006, Previsioni demografiche nazionali, 1 gennaio 2005 – 1 gennaio 2050, Nota Informativa , 22 marzo. [ Links ]
ISTAT, 2009, Previsioni demografiche 1 gennaio 2007–2051, http://dema.istat.it/uniprev/note.html. [ Links ]
JONES, G. W., R. M. DOUGLAS, J. C. CALDWELL y R. M. D'SOUZA, 1997, The Continunig demographic transition, Clarendson Press, Oxford. [ Links ]
LEWIS, A. W., 1954, Economic development with unlimited supplies of labor", The Manchester School of Economics and Social Studies, núm. 22, 139–191. [ Links ]
MCNICOLL, G., 2000, "Reflection on replacement migration", en People and Place, 4. [ Links ]
OECD, 2004, Ageing and employment policies, Paris, Italy. [ Links ]
POPULATION DIVISION, 2000, Replacement Migrations, is it a solution to declining and ageing population?, United Nations, Nueva York. [ Links ]
POPULATION DIVISION, 2007, World fertility pattern, United Nations, Nueva York. [ Links ]
POPULATION DIVISION, 2009, World Population Prospects: the 2008 Revision. Highlights, Department of Economics and Social Affairs United Nations, Nueva York. [ Links ]
TAPINOS, G., 2001, "The role of migration in moderating the effect of population ageing", en Migratio, 2. [ Links ]
WARD B., 1972, What's Wrong with Economics?, Basic Books, Nueva York. [ Links ]
1 The sign of the migration balance became negative in Italy in 1972, in Portugal in 1974, in Spain and in Greece in 1975.
2 Together with the Malthusian theory, the theory of demographic transition is, according to Chesnais, the only theoretical body of demography, "a science in which general theories are rare"; (Chesnais, 1986: 3).
3 After having acknowledged that "International migration is the component of population change most difficult to measure and estimate reliably" and that "the movement of people across boundaries is subject to a great deal of volatility" the last World Population Prospects conclude that "projections of future international migration levels are the least robust part of current population projections and reflect mainly a continuation of recent levels and trends in net migration"; (Population Division, Department of Economic and Social Affairs, 2009: 40).
4 Population Division, 2007; the survey covers 195 countries and territories with more than 100
000 inhabitants.
5 According to the same source in the 1970–1975 period only 14 countries were characterized by a fertility rate at or below 2.1. All of them, but Macau were in Europe.
6 The reason of term "probable" will become clear in the last part of the paper..
7 In 2008 the Population Division has produced eight different demigraphic scenarios: five differ only with respect to fertility trends (low, medium, high, constant, instant–replacement fertility). The other three are based on the medium variant scenario: the "constant mortality" variant differs with regard to the path followed by future mortality, the "no change" variant differs with respect to both fertility and mortality, the "zero migration" variant only with regard to the path followed by future international migration; (Population Divisionn, 2009).
8 In the case of countries with fertility above replacement, if fertility falls to 1.85 children per woman before 2050, it is then held constant until 2050. For countries with fertility below 1.85 children per woman in 2005–2010, it is assumed that after a transitional period of 5–10 years in which it will follow recent trends, fertility will increase at a rate of 0.01 children per woman per year; (Population Division, 2009).
9 The decline of fertility below replacement level was clearly written in the long–term tendencies of this variable and the failure of demographers to forecast this Copernican change is to be imputed only to ideological reasons, i.e. the deeply rooted conviction that equilibrium would represent the end point of the demographic "transition".
10 See note 4.
11 What has happened in Italy provides a very good example of the consequences of this methodological approach. The first population projections made in 1984 by IRP (Institute of Population Research) assumed a zero migration balance. The same assumption was made in the projection proposed by IRP in 1988. In 1994, a long term projection exercise proposed by the Director of IRP, on the line of a similar exercise made by Coale for the United States (A.J. Coale, 1986:. 203–216) assumed constant values of 50 000 and 80 000 over a 100 year horizon. In the 2001 in the projections published by the Italian Statistical Institute (ISTAT) the migration balance was raised to 125 000 a value that has been brought to 200 000 in the last update published in June 2008. The last two projections cover the period up to 2050. In conclusion, in 24 years the Italian demographers have moved from a position that excluded that Italy would have received immigrants to forecasting the presence in the country of 11 million people born abroad in 2050.
12 Population Division, 2009.
13 The hypothesis is that the unemployment rates will converge in all countries to the Nairu values estimated by the European Commission, DG–ECFIN for the year 2008.
14 ILO provides estimates of the labor force for the period 2007–2020 covering 191 countries and territories. The data are available at the ILO main website on labour Statistics (http://laborsta.ilo.org.). while for the methodology see ILO, 2008.
15 A parallel in weather forecasting would be to predict that tomorrow will rain because yesterday it was raining, in the moment of transition from the rainy season to the dry season.
16 For a full description of the model see M. Bruni, 2008 and 2009.
17 Generational entries are first time entries; generational entries in to the labour force do therefore originate from the non labour force and are represented mainly by passages from the training phase of life to the labour market; generational entries in to employment come from the population of first job seekers.
18 For simplicity, we assume that changes in participation of the local labour force will translate immediately in an analogous change in the rate of employment. This assumption is justified by the fact that, in general, we can expect that a situation of structural lack of labour supply will be characterized by a situation of frictional unemployment.
19 The model has already been applied to Italy; see M. Bruni (2008) and to Moldova M. Bruni (2009).
20 If the time horizon is fifteen years long, the only parameters needed for the first step of the exercise are mortality rates, since all the young people who will become fifteen during the period are already born.
21Local labour force must be understood as the labour force present in the country at the beginning of the period.
22 The retrospective data for the European Union refer to 14 countries since homogeneous data were not available for Germany.
23 For simplicity of exposition from now on we will refer to both areas and countries as "countries".
24 Given the large difference between the long and short–term values of ÷ and z, the values for Russia have been taken equal to the average values of the four countries in the 20 year interval.
25 The data necessary to build the scenarios are:
1. WAP at time t.
2. The natural balance of WAP between 2005 and 2025.
3. The employment level at time t.
For homogeneity, demographic data have been taken or computed using the database of the 2008 World Population Prospects; employment data have been taken from the database of ILO. The value of β is assumed equal to the value estimated with the regression.
28 A similar suggestion has been advanced by Tapinos who, however, does not underline the change in perspective and vast implications brought about by employing this indicator, (G. Tapinos, 2001). A recent paper of the Central European Forum for Migration Research has proposed to build indicators of structural burden using labour force as a measuring rod; this would however leave the unemployed between those who maintain, (J. Bijak, D. Kupiszewska, M. Kupiszewski, K. Saczuk, 2005). This indicator has also been used by OECD (OECD, 2004), and by the UE (Carone, 2005).
29 For the Italian case see Bonifazi C. and G. Gesano, 1994.
30 As we have already pointed out, the natural decline of WAP does not necessarily coincide with the appearance of foreign labour needs. Foreign labour needs can appear before the natural balance of WAP becomes negative if the exits from the training phase of life are not qualitatively coherent with the labor demand in terms of flows. On the contrary, in a situation in which such coherence exists, they can appear after WAP has started to decline for natural reasons if the lack of labour supply in terms of flows can be offset by the presence of unemployed, by an increasing participation of the secondary labour force, by internal migrations. At the same time, the presence of even a very large migratory potential does not mechanically generate migrations flows. To migrate is a difficult, risky and costly endeavor and consistent migration flows can take place only if a minimum level of economic and cultural development has been reached. According to United Nations data, between 2000 and 2005, less than half a million migrants did originate every year from the 30 poorest countries of the world, a value equal to only around two per cent of the young people who entered the working phase of life in these countries (Population Division, 2009).
31 It must be pointed out that situations of structural lack of labour supply and of structural excess of labour supply can also be generated by economic trends. Moldova provides a good example of a country where the economic collapse and the consequent dramatic decline in the employment level provoked by the transition from a command economy to a market–based economy has generated a structural excess of labour supply; (M. Bruni, 2009). An example of structural lack of labour supply in the presence of positive natural growth of WAP is provided by the United States where between 1970 and 2005 employment grew by 75 million, while the natutral growth of WAP has been of only 45 million.
32 This was the main policy suggestion contained in the volumes on ageing published by OECD.
33 This was the main thesis of the Population Division controversial report on replacement migration, a conclusion that I totally share. In my opinion the weak point of the report was represented by the choice of targets (keeping constant total population, keeping constant WAP keeping constant the PRS) that do not have any economic meaning (Bruni, 2008).
34 This is clearly shown by the hypothesis on fertility on which the projection of the Population Division are based (see note 8).
35 In the case of selectivity the convergence is explained by the psychological and demographic characteristics of the migrants. The adaptation model is centered on the physical, economic and social constraints of the new environment. The socialization model postulates that the decline in fertility is the result of a gradual process of acculturation at the end of which the migrants will adopt the local cultural models. This model does, therefore, postulates that the change will span over a long period of time and that it will be completed only with the second generation. The disruption model explains the decline in fertility on the basis of numerous factors that determine a perturbation in women reproductive behavior such as the temporary separation of the couple, the migration stress, and the socio–economic problems of the first year in the new environment.
36 In Italy, for example, in 2005 the total fertility rate of Italian women was 1.24 while the TFR of foreign women was 2.41.
About the Author
Michele Bruni. Ph. D. en Economía por la University of Berkeley. Se desempeña laboralmente en la Università di Modena e Reggio Emilia (Italia). Ha ocupado los cargos: Senior consultant at ILO in Budapest y vicepresidente de la European Society for Population Economics (año 1994).

