


 text new page (beta)
 English (pdf)
 Article in xml format
 Article references
 Send this article by e-mail
 Cited by SciELO
  Similars in
SciELO
Similars in
SciELO 
 Permalink
1 Introduction
Security is a critical component of a country's long-term stability. For the good of society, it is the obligation of a country's law enforcement institutions to regulate criminal incidences and threats. Crime is a threat to humans posed by other people that is penalized by government legislation [18]. Crime has always been a persistent and troubling issue in society, resulting in social disparities. Since the evolution of the human race, one of the most serious breaches has remained unsolved is crime.
Crimes have an impact on a country's foreign reputation as well as its economy by putting a financial strain on the government in terms of recruiting more police officers [26]. The government must adopt an optimum approach [25] and long-term e-governance information systems to eradicate crime. Crime has shown intricate relationships with place, time, and surroundings as a long-term worldwide concern.
Extracting effective features to disclose such intertwined links in order to anticipate where and when crimes will occur is becoming a hot topic for researchers as well as a bottleneck [5]. Law enforcement deployment in high-risk areas can be aided by this developed algorithm that are predicting the frequency of crimes with regards to the location-based and time [13].
The number, volume, and coverage of archives news channel and online newspapers are examples of web-based news resources, which has exploded, and they now contain both relevant and authentic data [20]. However, because the data in the archives is not well organized and categorized, extracting relevant information about specific or intriguing criminal incidents might be difficult [26]. The news archives are an excellent source of knowledge.
It has a lot of useful and interesting stuff that has been meticulously recorded by experts and depicts some key characteristics of the specific article [33]. Daily Independent, The Guardian, Nigerian Tribune, The Nation, Daily Trust, The Punch, Blueprint, Leadership, New Telegraph, This Day, Vanguard, Daily Sun are the most popular and authentic newspaper archives in Nigeria. The goal of this study is to use freely available data from news archives to conduct a spatiotemporal analysis for bandit crime prediction.
In a nutshell, the viability of employing geospatial methodologies and a novel deep learning approach called “DeCXGBoost” to predict bandit crime/criminal activities using data from online archives in Nigeria is presented in this work. The experimental assessment results suggest that the approach is successful, with good accuracy in spatial and temporal bandit crime prediction in Nigerian villages.
We also compare the results acquired via our technique to those obtained through other algorithms published in the research, proving that the suggested algorithm is more accurate than other ways suggested as seen from the literature. In order to avoid ambiguity, this research makes numerous original contributions such as the bandit crime dataset gathered from Nigerian online news archives, a proposed new framework dubbed the DeCXGBoost, and a qualitative study of crime as a type.
2 Review of Related Literature
Accurate crime forecasting can aid police resource allocation for crime reduction and prevention. There are two widely used methods for predicting criminal activity: one is based on past crime patterns, and the other is based on environmental characteristics linked to criminal trends [30]. A Convolutional Neural Network (CNN) combined with a Long-Short Term Memory (LSTM) network (hence CLSTM-NN) is proposed in a study by [6] to forecast the existence of criminal events over Baltimore (USA).
The model is used for two different sorts of crimes: larceny and street robbery. The suggested neural network's prediction performance is evaluated using several common metrics in a variety of controlled plausible scenarios (Accuracy, AUC-ROC, and AUC-PR). However, if the model was used used on a single type of crime, a better prediction accuracy will be obtained, never the less our study will adopt the CNN for feature extractions. In a study by [9], the approach of supervised learning was employed to improve the accuracy of crime prediction.
In order to foresee crimes, the proposed system analyses a data collection of crimes previously committed with tendencies as contains in récords. The decision tree and k-nearest neighbour algorithms are the foundations of the system. To improve prediction accuracy, the Random Forest method and Adaboost were utilised. Finally, to improve accuracy, oversampling was applied.
The proposed system was fed a twelve-year criminal-activity data collection from San Francisco. However, more advanced machine learning algorithms can be used, which will involve a smaller number of algorithms for a better result. In a study by [3], a prediction technique focused on auto-regressive models and spatial analysis was developed to find dangerous crime hotspots in urban regions automatically.
The technique generates a forecasting model of spatiotemporal crime, which consists of crime-dense regions sets and associated predictors of crime, which each is a predictive model for number of crimes estimated predicted to happen in its connected zone. New York City and Chicago crime datasets were experimentally evaluated on this model.
According to results, the suggested technique has high accuracy in spatiotemporal crime predictions over rolling time horizons. However, machine learning would have produced a more accurate result.
[19] used a Long Short-Term Memory (LSTM) for identifying episodes of crime as regards to safety of the public in the crime prediction context. They were able to achieve 87.84 percent accuracy by employing only five elements from dataset supplied by police from municipal of Chicago.
A Feed Forward Neural Network (FFNN), a Recurrent Neural Network (RNN), a Convolutional Neural Network (CNN), and a combination of Recurring Networks with Convolutions (RNN + CNN) were used in a study by [23]. RNN + CNN was shown to be the best neural network for prediction using data from Chicago, with 75.6 percent and 65.3 percent accuracy for Portland.
The study [32] employed algorithms of machine learning of five different types to forecast the type of crime most likely to occur at specific times and locations (locations) in Chicago.
The best result was achieved by a decision tree model, which had a precision of 99.88 percent. In a study by [29], YD county crime events were looked at, ranging from 2012 upto 2015 and several predictions models were used. This included Random Trees, Bayesian networks, and Neural networks. Random Trees had accuracy of 97.4 percent which was the best among the used models in the research.
Several ways to crime prediction have been developed to discover crime patterns and trends, according to the literature. However, because crime is a worldwide issue that is on the rise, there is a pressing need for research that forecasts location-based crimes in Nigeria's neighboring areas using free data from news archives.
Natural language processing methods can be used to turn publicly available data into usable information, and supervised and unsupervised learning can be used to make predictions. Such research can aid in the detection of future crimes in emerging and underdeveloped countries with limited financial resources.
3 Methodology
The new proposed framework called “DeCXGBoost” seen in figure 1, has been proposed with the aim of using deep learning [8] technique and an ensemble learning [31, 28, 11, 35, 7, 14, 21, 27] for the intelligent analysis of crime. It encompasses a convolutional neural network (CNN) which is used for feature extractions with xgboost algorithm which is a very strong classifier is used in the top layer of the CNN for final predictions. We want to be able to use deep learning to predict crime rates and likely hotspots, as well as for proactive policing and prevention efforts, by offering this new framework.

3.1 Data Collection
Data was crawled from the news archives of practically popular and credible newspapers using a Data Miner Tool. These newspapers include Daily Independent, The Guardian, Nigerian Tribune, The Nation, Daily Trust, The Punch, Blueprint, Leadership, New Telegraph, This Day, Vanguard, and Daily Sun.
The data miner tool was chosen for crawling since it collects data from a website and displays it in tabular form.
This further categorizes the news by title, description, date, and URL, among other factors. Crime type, description, location, latitude, longitude, number killed, number abducted, property destroyed, arrest made, and date were among the characteristics of news records used for this study as seen in Table 1.
Table 1 Attributes of the crime dataset
| Attribute | Data Type | Description | Example |
| CrimeType | String | News title | Niger: 20 killed in an attack |
| Description | String | News description | Army arrest bandits |
| Location | String | Place of attack | Benue community |
| Lat | Float | Latitude | 10.215539 |
| Long | Float | Longitude | 5.393955 |
| Number Killed | Integer | Number of people killed in the attack | 5 people lost their lives in Kaduna bandit attack |
| Number Abducted | Integer | Number of people abducted by the bandits | 100 students abducted in Zamfara bandits attack |
| Property Destroyed | String | Destruction caused during the attack | 10 houses burnt in Sokoto bandits attack |
| Arrest made | Boolean | Bandits arrested by security agency | 10 bandits’ members arrested by the Nigerian Army |
| Date | Date | Date of attack | 12 October 2021 |
3.2 Preprocessing
At first, all of the instances were combined, and extraction of properties from the description was carried out. Cleaning of data was done afterwards, thereafter, Description element was eliminated because it was not needed for prediction.
Because there was no requirement to lower the parameter, attributes were chosen based on vast literature, and data reduction techniques were not used. According to the input of our proposed model, RF, KNN, NB, and CNN algorithms, an acceptable format for the bandits data preprocessed and their attributes were presented.
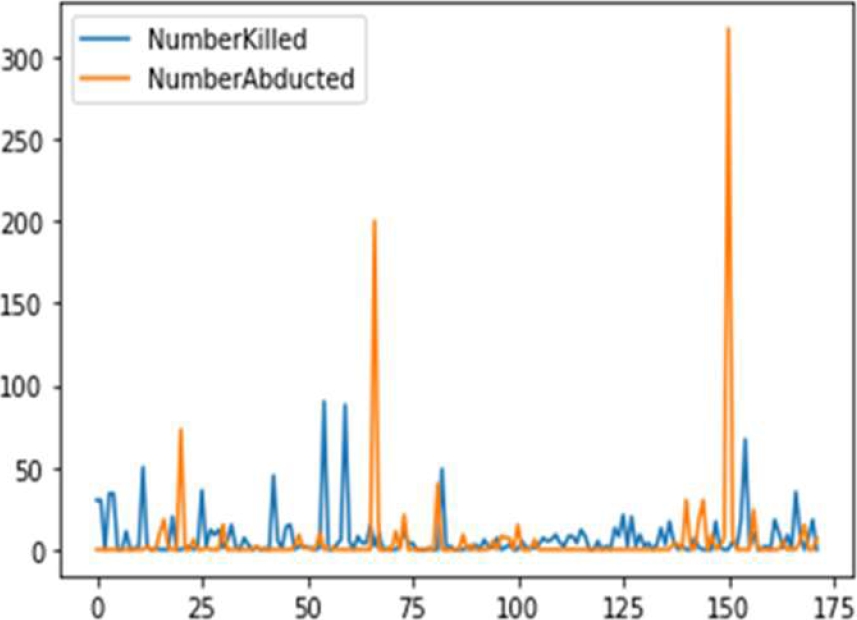
With this in mind, additional data transformations and discretization stages were unnecessary. To convert category qualities to numerical values, we used one-hot encoding. Figure 2 shows the features used in the bandit crime prediction, also Figure 3 shows the frequency of Number of people killed and abducted during the study time.

3.3 Dataset Training and Testing
Avoiding overfitting and to obtain realistic accuracy more, division of the dataset into two parts is done: training and testing dataset. The training dataset includes all features as well as the target label. The testing dataset only contains the information that a machine learning model uses to predict the target label.
The selection module of Scikit-model learn separates the original dataset into testing and training datasets using a class test train split. The size of the test dataset is set to 20% of the main dataset. The value was utilised in all the trials. The partition of the dataset into train and test data sets is shown in Figure 4.
3.4 Bandits Crime Data Visualization and Hotspot with ArcGIS
For visualising spatial datasets, ArcGIS is a popular application. In this study, the Nigerian shapefile is loaded into ArcGIS along with the extracted bandits crime dataset to display records of bandits crime depending on the coordinate (latitude & longitude). ArcGIS representation of the bandits crime dataset in Figure 5 demonstrates that the bolded points have been particularly prone to banditry offences.

As shown in Figure 5, a hotspot indicates places with a high crime rate and a high likelihood of crime. It refers to the concentration of crime in a certain location [10, 2] as determined by a count that identifies hotspots and cool spots in every aggregation place across the investigative area.
Hotspots creation on maps assists security or law enforcement organisations in identifying areas with high crime rates, thereby forecasting the causes of crime in that region also preventing further crime by raising awareness of the need for security in the region [22, 24].
4 Crime Spatial Analysis
Analysis of crime is described as been the process of identifying trends and patterns of crime from criminal dataset in order to aid in the deployment of plans and strategies for future crime prediction [4].
In order to analyse crime patterns spatially, we conducted a spatial analysis of crime with the spatial data derived from news archives from the web. The term spatial crime analysis means the study of the spatial distribution of the crime rate, which might be clustered, random, or dispersed.
It depicts the spatial relationship between crime feature sites and analyses trends in crime patterns.
4.1 Clustering with k-Means Algorithm
A data mining approach that divides items into groups with similar features or properties, each of which behaves differently is called clustering [1]. It can help forecast crimes based on spatial distribution by analysing clusters [12].
We utilised the k-Means approach to cluster a crime dataset in this study because it is suitable to large datasets and has a lower complexity than other clustering algorithms [24].
In this study, the Weka tool is utilised to conduct k-Means clustering. Based on the nearest mean, k groups are created from n observations in k-Means clustering. The following steps are involved in the k-means clustering process:
k is the number of clusters declared.
Decide on the cluster's centres.
The cluster with the least distance between them is assigned to each instance.
The cluster centroids are recalculated.
The procedure is repeated several times.
The centroids of each cluster produced using the k-Means approach are shown in Table 2.
Table 2 Bandits crime clusters in Nigeria using k-Means algorithm
| Clusters | Data Points | Location | LAT | LONG | Date |
| Centroid | 172.0 | Kaduna Community | 10.0192 | 6.9944 | 15th May 2021 |
| Cluster 0 | 102.0 | Kaduna Community | 10.937 | 7.5816 | 25th April 2021 |
| Cluster1 | 70.0 | Niger Community | 8.6819 | 6.1387 | 30th Sept. 2021 |
The data is separated into two clusters with numbers ranging from 0 to 1. Table 3 depicts the distribution of clusters based on bandit crime locations.
Table 3 Description of our selected feature
| Cluster# | Location |
| Cluster 0 | Kaduna Commuity |
| Cluster 1 | Niger Community |
The centroid determines the name of the cluster. Figure 6 shows the crime clusters in terms of their latitude, which was created using the Weka tool.

5 Bandits Crime Prediction
In this section the proposed DeCXGBoost method is used to make predictions from the extracted bandits crime dataset from Nigeria. The results obtained are then compared with other preditions algorithms used in this studies namely random forest, Naïve bayes, and bagging algorithms.
Any algorithm's performance is measured using a variety of evaluation matrices. F-measure, Accuracy, Recall, Precision, ROC curve, Root Mean Square Error (RMSE), Absolute Error, and other performance criteria are used in evaluations. The capacity to anticipate categorical class labels is defined as accuracy.
This means it estimated the fraction of events that were accurately anticipated [26]. The evalution matrices used for this study are accuracy, precision, recall, and F-measure.
The formula in Equation (1) was used to calculate the accuracy of the measurements:
Precision is the percentage of true positives among all documents that have been positively assigned. It's calculated as given in Equation (2):
Recall is the total number of true positives out of the total number of actual positive documents. It's calculated as shown in Formular (3):
As seen in Equation 4, the F-measure is computed by taking the weighted harmonic mean of the precision and recall:
We have:
− If the dataset contains a positive record but the classification output is negative: False Negative (FN).
− If the dataset contains a negative record but the classification outcome is also negative: True Negative (TN).
− If the instance is positive, but the categorization result is also positive: True Positive (TP).
− A data record that is negative but has a positive categorization outcome: False Positive (FP).
5.1 Predictions with DeCXGBoost
The preprocessed bandits crime dataset is feed into the framework. The implementation was done using python 3.7, tensorflow, keras, and jupyter notebook used as the coding editor. The framework was trained with set parameters as shown in figure 7. Figure 8 (a) shows the loss function from the novel model. Figure 8(b) is the accuracy of both thr train and test dataset.


5.2 Using Random Forest (RF) for Prediction
Well-known strong supervised machine learning technique is the RF algorithm. Several decision trees are created within a forest by the RF algorithm [15]. Forest with more trees echoes more accurate and reliable predictions. New class are predicted based on prior old tree classes features. Each tree votes for a new tree that is added and the forest chooses the categorisation that receives the most votes from all of the current tres [17].
We used the Weka program to predict bandits crime using RF on the obtained dataset. The following stages were used to implement random forest algorithms [34]:
It selects k features at random from a total of m features, where m > k.
It uses the best split point approach to find the node d among the k characteristics.
It uses the best split method to split the node into daughter nodes.
It repeats steps 1–3 till the number of nodes reaches l.
It creates a forest by repeating steps 1 to 4 for n number of times, resulting in an n number of trees.
It takes the test features and predicts the outcome using the rules of each randomly generated decision tree, then saves the projected outcome (target).
The votes are calculated for each anticipated class.
Using the random forest approach, final predictions are created based on the most popular projected class.
5.3 Prediction Using K-Nearest Neighbour (KNN)
The KNN algorithm predicts the test data using the nearest neighbour approach [16]. The Weka tool was utilised in this research to train KNN using a bandits crime dataset, and our test dataset was used to predict the crime occurring at the said location. The distance between features of the training and testing is determined, since distance is a factor in KNN. The KNN was put in place in the following way [26]:
Load the data into the program.
The value of k has been determined.
Data points are iterated from 1 to the total amount of training to generate the projected class.
Using the Euclidean distance metric, which measures the distance between the pair of samples p and q in an n-dimensional feature space, calculate the distance between each row of testing data and each row of training data.
Sort the calculated distance values in ascending order.
The top k rows of the sorted array are returned.
The most often used class for the specified rows is returned.
The outcome of the prediction is returned.
5.4 Prediction Using Naive Bayes (NB)
The Bayes Theorem is used to build the Naive Bayes statistical categorization approach. It's one of the most straightforward supervised learning algorithms on the market. The Naive Bayes classifier is a simple, reliable, and fast approach. Naive Bayes classifiers have high accuracy and speed on huge datasets. The steps that were taken were as follows:
Input the dataset.
Calculate the prior probability for the provided class labels in step one.
Calculate the Likelihood Probability for each class using each attribute.
Use the Bayes Formula to calculate the posterior probability of these values.
Given that the input belongs to the higher probability class, determine which class has the greater probability.
Return results.
6 Results and Discussion
The most challenging task is crime prediction, especially when the dataset available from crime reports is insufficient. On bandits crime dataset obtained from archives, we employed our proposed DeCXGBoost model and four other machine learning algorithms that is RF, KNN, NB, and CNN to predict criminal events in this study. With regards to accuracy and prediction, results from the four algorithms used in this study were compared with the proposed model.
The average accuracy of the DeCXGBoost, RF, KNN, NB, and CNN, respectively, was found to be 99.9999%, 91.2791%, 85.4651%, 79.6512%, and 97.1429%. As a result, when compared the proposed novel model to other algorithms used in this study, the proposed novel model prediction remained high and efficient. The outcomes of both algorithms, as well as the parameters, are shown in Tables 4, 5, and 6.
Table 4 RF results
| Trees | Precision | Recall | F-measure | Accuracy |
| 10 Trees | 0.843 | 0.913 | 0.877 | 91.2791 |
| 20 Trees | 0.843 | 0.913 | 0.877 | 91.2791 |
| 30 Trees | 0.843 | 0.913 | 0.877 | 91.2791 |
| 40 Trees | 0.843 | 0.913 | 0.877 | 91.2791 |
Table 5 KNN results
| k | Precision | Recall | F-measure | Accuracy |
| 3-NN | 0.849 | 0.849 | 0.849 | 84.8837 |
| 5-NN | 0.839 | 0.855 | 0.847 | 85.4651 |
| 7-NN | 0.849 | 0.849 | 0.849 | 84.8837 |
| 9-NN | 0.839 | 0.855 | 0.847 | 85.4651 |
Table 6 NB results
| k | Precision | Recall | F-measure | Accuracy |
| 3-fold | 0.868 | 0.756 | 0.802 | 75.5814 |
| 5-fold | 0.895 | 0.797 | 0.834 | 79.6512 |
| 7-fold | 0.877 | 0.767 | 0.812 | 76.7442 |
| 9-fold | 0.874 | 0.744 | 0.796 | 74.4186 |
Table 4 compares precision, recall, F-measure, and accuracy values to varying KNN algorithm parameters. The findings show that as the number of trees increases, the matrices' values remain constant, and we get the same maximum values when the number of trees is equal to 40.
When the value of k was increased to 5, we were able to attain higher matrices values, as shown in Table 5. When k is equal to 7, however, it declines, and when k is equal to 5, it returns to the same matrices values.
The number of k folds is shown as a parameter in Table 6, together with precision, recall, F-measure, and accuracy values. We were able to achieve greater matrix values when k equaled 5, but the matrices values continued to plummet after that.
Table 7 shows the comparison of the best matrices values as obtained by each model with CNN performing poorly with respect to precision, recall, and F-measure. However, its Accuracy was higher as compared with RF, KNN, and NB as can be seen in Figure 9.
Table 7 Results of the proposed algorithm
| Model | Precision | Recall | F-measure | Accuracy |
| RF | 0.843 | 0.913 | 0.877 | 91.2791 |
| KNN | 0.839 | 0.855 | 0.847 | 85.4651 |
| NB | 0.895 | 0.797 | 0.834 | 79.6512 |
| CNN | 0.028 | 0.028 | 0.028 | 97.1429 |
| Ours | 1.0 | 1.0 | 1.0 | 99.9999 |

As seen in figure 9, we were able to achieve higher matrices using our proposed unique hybrid method called DeCXGBoost.
Most accurate result was predited by the novel DeCXGBoost since it was able to minimize negative consequences of incorrect feature categorization as well as classification mistakes. This was because CNN been a good feature extractor, did the extensive feature extraction and the xgboost ensemble algorithm which is a good a robust classifier did the predictions with great accuracy.
Furthermore, computerised geo-coding technologies for extracting accurate locations can pinpoint the crime's exact site. Such an integrated model can aid law enforcement organisations and decision-makers in predicting specific areas of crimes in order to achieve successful outcomes as see in Table 3, where more of the bandits crime clusters are seen around Kaduna and Niger communities in Nigeria.
7 Conclusions
This paper presents a novel hybrid deep learning frame work which encompassed CNN and xgboost algorithms for spatiotemporal prediction of bandit crime in Nigeria. The proposed DeCXGBoost frame work predicted the number of bandit crimes with good accuracy, according to an experimental evaluation conducted on news archives bandit crime datasets relating to bandit crime data from various parts of Nigeria. In addition, the study also provides fine grained information on where crime is likely to happen through spatial analysis.
We also presented a comparison with other algorithms, demonstrating that the achieved results (to the best of our knowledge) beat those of other systems suggested in literature thus far for crime predictions. Other study topics could be looked into in the future. In real time, we may go deeper into the projections.

