


 text new page (beta)
 English (pdf)
 Article in xml format
 Article references
 Send this article by e-mail
 Cited by SciELO
  Similars in
SciELO
Similars in
SciELO 
 Permalink
1 Introduction
In the medical field, visual tissue analysis is a frequent and complementary test for the diagnosis of diseases. Cancer is a disease of particular attention because it is one of the public health problems, whose diagnostic costs are high. Leukemia is one of the 10 most frequent types of cancer [11]. One test that is part of the diagnostic criteria for leukemias is a visual analysis of bone marrow or blood images.
Morphological recognition of the images is performed by a specialist and in practice, there is an error rate of at least
Commonly used approaches in computer visual recognition are handcrafted and automatic approaches. In the former, the process is performed manually by experimentation where the feature extraction process is guided by human reasoning [2, 1].
On the other hand, in automatic approaches, no prior knowledge of the problem is required for the extraction of features that are then used in the recognition phase [17, 16].
In this paper, we present an evolutionary vision approach for AML (Acute Myelocytic Leukemia) recognition that has been little explored as a form of automatic recognition, which is function-driven rather than data-driven, as in convolutional neural networks.
In the next section, we present the related works. Section 3 presents the theoretical concepts to address the proposed methodology. In Section 4, experiments and results are shown. Conclusions are drawn in Section 5.
2 Related Works
In the literature review, it is noteworthy that hand-craft approaches are better suited to the criteria used by medical experts than automatic methods.
This is because these approaches focus their attention on feature extraction from regions of interest in the image.
These regions correspond to the elements that human experts identify as relevant for the recognition and classification of blood smear images. It is noteworthy that detection and classification processes are generaly used in handcraft approaches.
Therefore, image processing and handcrafted feature extraction techniques are commonly leaded to the regions that provide the most information for recognition.
These regions correspond to the structural elements of cells such as the nucleus and cytoplasm. The features generally used are shape, color, texture, or combinations of these. Classifiers most commonly used are SVM, RF, KNN, MLP, and decision trees.
While the cell types most considered for classification are healthy cells, immature cells, and acute and chronic leukemia cells, as well as acute leukemia subtypes such as L1, L2, L3, M2, M3, and M5, belonging to the FAB classification.
Generally, the classification accuracy rates obtained by these models are higher than 90% [5, 6, 14].
On the other hand, some advantages of these approaches are that the size of the images is not a limitation for the performance of these techniques; and large amounts of images are not required for the training of the learning models or high computational resources as in the case of automatic approaches.
The most common drawbacks of these approaches relate to the need for time-consuming experimental adjustments that are often specific to the datasets used in their development.
Later, with the increasing availability of image datasets, the emergence of data augmentation techniques, and new learning approaches, the problem of blood cell detection and recognition started to be addressed with automatic learning approaches, particularly with deep learning techniques such as CNN.
However, the problem of leukemia recognition considering FAB classification criteria has been little addressed with these approaches, mostly limited to differentiating between healthy and leukemic cells [15, 17, 4], or in identifying maturation phases of cells [12, 16].
These CNN models are used as feature extractors or classifiers. Generally, they do not require any image preprocessing before feature extraction, although in some cases there is a performance improvement when applying these techniques [4].
Although these models reach adequate results, the process to obtain the features and their meaning is hidden to the user, whereby they are considered black box models.
Moreover, they requires a lot of computational resources and a great amount of images with medium or low resolution.
Since in the leukemia recognition is of utmost importance to know how the features are derived in a natural way, as well as their meaning for the recognition task.
In this research work, a evolutionary vision model begun to be explored in previous work [7, 8] is used to discern how the visual process is carried out for the automatic recognition of types of AML leukemia.
3 Automatic Recognition of Leukemia AML using Evolutionary Vision
Evolutionary vision is an approach that combines computer vision techniques and evolutionary computation in problem-solving. A representative model of this approach called Brain programming (BP) is explored in this work to realize the automatic recognition of AML leukemia.
Brain programming (BP) is an evolutionary computer vision paradigm in charge of finding a set of operations through an optimization process.
These operations are within a hierarchical process called the artificial visual cortex (AVC), where genetic programming (GP) allows the discovery of a set of visual operators (VOs) within the AVC [10].
These visual operators are functions for describing image classes, where for example, the sum operator denoted by
Table 1 Functions and terminals for the evolutionary visual operators
| Functions | Terminals |
|
Orientation ( | |
|
Color ( | |
|
Shape ( | |
|
Mental Maps ( | |
The problem of image classification from the point of view of data modeling through GP is how the BP performs image recognition.
In this way, the BP can be considered as a symbolic learning approach. The learning process of BP is defined since a minimization problem requires finding a solution
Since the direct mapping between the domain and codomain is unknown or not well defined, the model follows several stages.
Unlike traditional approaches to finding best-fit parameters, in this case, we fit the data by discovering functions that perform classification within BP. Thus, the classification problem through BP is defined as in equation 1:
where
The objective function that measures the model performance in arriving at the desired solution is given in quantitative terms of the multi-class classification through accuracy.
Hence,
The criterion for minimization in terms of a classification problem allows to discover an optimal solution to the problem.
The artificial visual cortex model and brain programming proposed by [10] and described in detail in [7] is used to obtain the descriptors that guide the evolutionary process for the automatic recognition process.
To determine the performance of the BP it is proposed to (1) use a form of knowledge transfer that consists of using the best solutions contained in previous experiments, and (2) increase the number of generations in the evolutionary process.
The general scheme of the proposal is presented in Figure 1. Section 4.1 contains a detailed description of this process.

4 Experiments and Results
The experiments were performed on a CPU i9, 64GB RAM, Windows10, and MATLAB.
Initialization values for the algorithm are: (a) Initialization.- Ramped half and half, (b) Tree depth.- Dynamic depth selection, (c) Dynamic max depth.- 50 levels, (d) Maximum length of genes.-10, (e) Selection.- Roulette wheel, and (f) Elitism.-Keep the best individual.
The evolutionary loop ends until the classification rate is 100% or the algorithm reaches the maximum number of generations
These values were selected considering they are parameters typically used in various genetic programming applications. The dataset is composed of bone marrow smear images from three types of acute lymphoblastic leukaemia (ALL): L1, L2, and L3, and four types of acute mieloblastic leukemia (AML): M2, M3, M4, and M5. The RGB images are in BMP format with resolutions of
The images are resized to
Figure 2 presents representative images of the leukemia types used in this work. The dataset was divided into three parts: a learning set, a validation set, and a testing set as in previous work [7].

To obtain reliable fitness values, each new individual is estimated by the average classification error rate with a classifier MLP (Multilayer perceptron) using five-fold cross validation. This classifier was selected from a previous work [8].
4.1 Results
The following is a description of the results using the datasets of leukemia types: a) L1, L2, and L3; b) M3, M4, and M5; c) M2, M3, M4, and M5. Each experiment was repeated ten times.
Furthermore, to make a more robust evaluation, the best solution is tested with two classifiers: MLP and random forest.
The outlier detection was done with the Grubbs statistical method using a significance level of 0.05 (two-sided) [3].
Table 2 shows the results for the experiments in which can be see that in datasets composed of three classes, although a similar behavior is exhibited in the recognition achieved, M-type leukemias are more difficult to recognize.
Table 2 Results of classification for three datasets
| leukemia typesLeukemia types | Leukemia types | Leukemia types | |||||||
| L1, L2, L3 | M3, M4, M5 | M2, M3, M4, M5 | |||||||
| Run | Val. accuracy | Test accuracy | Val. accuracy | Test accuracy | Val. accuracy | Test accuracy | |||
| MLP | Random Forest | MLP | Random Forest | MLP | Random Forest | ||||
| 1 | 85.12 | 74.38 | 80.33 | 85.64 | 78.89 | 79.78 | 77.30 | 72.76 | 75.55 |
| 2 | 88.20 | 79.94 | 81.99 | 84.61 | 76.64 | 80.19 | 73.46 | 64.82 | 69.43 |
| 3 | 89.74 | 77.48 | 78.89 | 86.66 | 81.10 | 82.33 | 72.69 | 72.45 | 74.52 |
| 4 | 92.82 | 84.56 | 82.87 | 69.74 | 59.20 | 60.28 | 81.92 | 78.62 | 79.59 |
| 5 | 91.28 | 77.15 | 84.65 | 82.05 | 76.16 | 79.08 | 80.00 | 73.37 | 75.80 |
| 6 | 92.30 | 86.66 | 86.43 | 81.69 | 80.98 | 76.66 | 71.92 | 68.84 | 72.16 |
| 7 | 90.25 | 81.73 | 83.79 | 83.07 | 83.97 | 84.56 | 78.07 | 76.00 | 77.13 |
| 8 | 85.12 | 78.33 | 80.45 | 81.02 | 78.49 | 79.15 | 75.38 | 73.32 | 73.64 |
| 9 | 89.74 | 82.48 | 84.02 | 83.07 | 74.12 | 80.53 | 73.07 | 70.88 | 73.31 |
| 10 | 92.30 | 79.47 | 83.37 | 88.71 | 82.95 | 86.59 | 80.38 | 75.29 | 77.90 |
| Minimum | 85.12 | 74.38 | 78.89 | 69.74 | 59.20 | 60.28 | 71.92 | 64.82 | 69.43 |
| Maximum | 92.82 | 86.66 | 86.43 | 88.71 | 83.97 | 86.59 | 81.92 | 78.62 | 79.59 |
| Average | 89.69 | 80.22 | 82.68 | 82.66 | 77.32 | 79.35 | 76.42 | 72.64 | 74.90 |
| Outliers Detected | 0 | 0 | 0 | 0 | 0 | 0 | 0 | 0 | 0 |
| Critical value Z | 2.28 | 2.28 | 2.28 | 2.28 | 2.28 | 2.28 | 2.28 | 2.28 | 2.28 |
The best solution of the experiments for classes M3, M4, and M5 is selected to show the behavior during the evolutionary process. In Figure 3 the diversity, complexity, fitness, and structure of the best solution are shown.
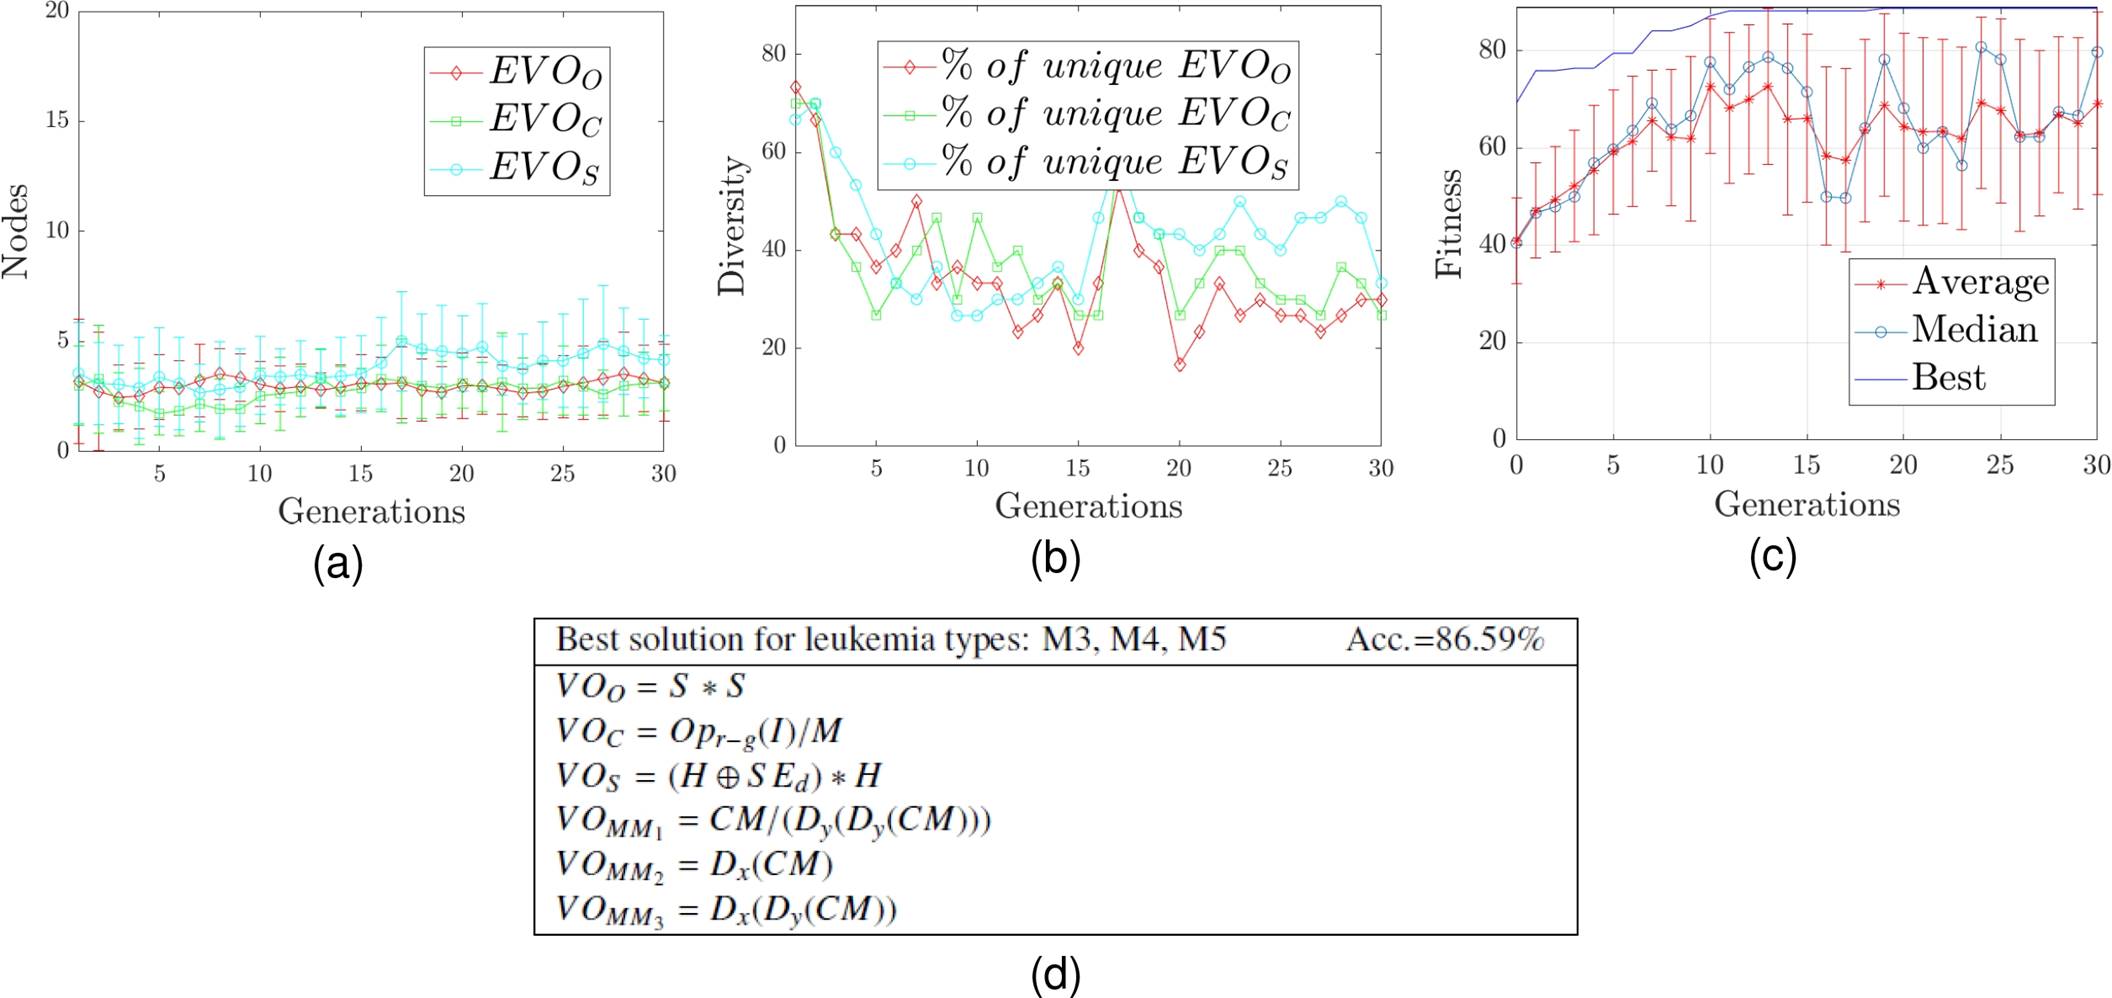
Diversity is defined as the percentage of operators’ uniqueness within the population, while the complexity is quantified through the depth and the number of nodes.
Results show that the best solutions discovered have low complexity because the number of nodes and depth of trees is minimum.
Since the model allows us to know how knowledge is derived to obtain the best solution, it is a significant advantage because human experts need to recognize leukemia types from the characteristics of an image, as well as to know the process for learning to recognize them.
From results in Table 2 it is to note that adequate performance is achieved when classifying sets of three classes, obtaining a maximum accuracy of
However, when including one class the accuracy achieved decreases to
Thus,
Since in group 1 experiments 10 runs were made for each dataset, then the three best solutions of each run are chosen to build an initial population of 30 individuals.
The population obtained for each dataset is used independently for the recognition of M2, M3, M4, and M5 leukemias. In this way, the knowledge that represents the learning achieved in previous experiments is used for the recognition of these 4 leukemia classes.
Table 3 presents the results of this group of experiments, in which it is worth to note that the best solutions from previous experiments for the 4-class classification are useful to improve the recognition accuracy in all cases.
Table 3 Results of classification using knowledge transfer
| evolutionEvolution from typesL1, L2, L3 | Evolution from typesL1, L2, L3 | Evolution from typesM2, M3, M4, M5 | |||||||
| Run | Val. accuracy | Test accuracy | Val. accuracy | Test accuracy | Val. accuracy | Test accuracy | |||
| MLP | Random Forest | MLP | Random Forest | MLP | Random Forest | ||||
| 1 | 78.84 | 70.06 | 69.53 | 76.53 | 70.63 | 73.90 | 81.92 | 77.47 | 79.49 |
| 2 | 77.69 | 76.55 | 81.13 | 75.38 | 71.41 | 75.77 | 83.84 | 80.29 | 81.14 |
| 3 | 76.92 | 74.32 | 78.18 | 78.07 | 73.07 | 77.33 | 84.61 | 80.64 | 80.86 |
| 4 | 78.84 | 78.80 | 81.43 | 75.38 | 72.24 | 73.59 | 81.53 | 77.22 | 79.94 |
| 5 | 77.69 | 71.26 | 73.75 | 84.61 | 83.63 | 82.96 | 83.07 | 73.07 | 76.71 |
| 6 | 75.00 | 73.96 | 78.33 | 77.69 | 75.62 | 76.54 | 81.92 | 76.90 | 79.91 |
| 7 | 79.23 | 76.64 | 80.59 | 83.46 | 77.26 | 79.69 | 81.92 | 77.66 | 79.47 |
| 8 | 78.46 | 79.07 | 81.57 | 77.30 | 75.06 | 80.49 | 81.92 | 76.42 | 80.21 |
| 9 | 82.30 | 78.18 | 79.66 | 78.07 | 71.03 | 81.28 | 81.92 | 76.18 | 80.06 |
| 10 | 76.15 | 76.26 | 76.94 | 80.76 | 75.78 | 81.82 | 82.69 | 76.26 | 78.81 |
| Minimum | 75.00 | 70.06 | 69.53 | 75.38 | 70.63 | 73.59 | 81.53 | 73.07 | 76.71 |
| Maximum | 82.30 | 79.07 | 81.57 | 84.61 | 83.63 | 82.96 | 84.61 | 80.64 | 81.11 |
| Average | 78.11 | 75.51 | 78.11 | 78.73 | 74.57 | 78.34 | 82.53 | 77.21 | 79.66 |
| Outliers | |||||||||
| detected | 0 | 0 | 0 | 0 | 0 | 0 | 0 | 0 | 1 |
| Critical | |||||||||
| value Z | 2.28 | 2.28 | 2.28 | 2.28 | 2.28 | 2.28 | 2.28 | 2.28 | 2.28 |
Although in one experiment the best solutions from the dataset were used with classes L1, L2, L3, which are different from the 4 classes to be recognized (M2, M3, M4, M5), the performance was higher than when the best solutions were not used as the initial population.
It can also be noted that in one case the best solutions of 3 known classes (M3, M4, M5) provided better results, reaching an accuracy of 83.64. However, the best average performance was achieved by using the best solutions of the 4 classes from previous experiments.
This suggests that features obtained for classes M3, M4, M5, M5 provide better knowledge for the classification of these classes.
To compare the model performance and to identify the advantage of knowledge transfer. This consisted of evaluating the case for the leukemia classes M2, M3, M4, and M5 that are shown in Table 2 during 30 more generations (now 60 generations).
The experiment was done for ten runs from Table 3, in which 30 generations were realized. Comparative results of model evaluation for 60 generations are shown in Table 4.
Table 4 Comparative results of classification for classes M2, M3, M4, M5
| 60 generations | 30 generations | |||||
| Run | Val. accuracy | Test accuracy | Val. accuracy | Test accuracy | ||
| accuracy | accuracy | accuracy | accuracy | |||
| MLP | Random Fores | MLP | Random Fores | |||
| 1 | 83.07 | 76.92 | 80.09 | 81.92 | 78.62 | 79.59 |
| 2 | 83.07 | 72.18 | 75.59 | 80.00 | 73.37 | 75.80 |
| 3 | 82.30 | 76.12 | 79.25 | 80.38 | 75.29 | 77.90 |
| 4 | 79.23 | 75.79 | 77.41 | 78.07 | 76.00 | 77.13 |
| 5 | 77.69 | 72.79 | 75.88 | 73.46 | 64.82 | 69.43 |
| 6 | 76.92 | 71.44 | 74.06 | 75.38 | 73.32 | 73.64 |
| 7 | 73.07 | 68.22 | 73.61 | 71.92 | 68.84 | 72.16 |
| 8 | 72.69 | 73.19 | 73.98 | 72.69 | 72.45 | 74.52 |
| 9 | 77.69 | 72.66 | 74.23 | 77.30 | 72.76 | 75.55 |
| 10 | 82.30 | 68.95 | 72.58 | 73.07 | 70.88 | 73.31 |
| Minimum | 72.69 | 68.22 | 73.61 | 71.92 | 64.82 | 69.43 |
| Maximum | 83.07 | 76.92 | 80.09 | 81.92 | 78.62 | 79.59 |
| Average | 78.03 | 72.83 | 75.67 | 76.42 | 72.64 | 74.90 |
| Outliers | ||||||
| detected | 0 | 0 | 0 | 0 | 0 | 0 |
| Critical | ||||||
| value Z | 2.28 | 2.28 | 2.28 | 2.28 | 2.28 | 2.28 |
The experiments performed by increasing the number of generations for the 4-class problem show that there is no significant improvement in performance over the experiments with knowledge transfer.
Although the difference in accuracy is minimal in both experiments, it is notable that in neither case is increasing the number of generations useful to increase the model performance. Thus, the use of the best solutions from previous experiments is useful to improve the classification results.
5 Conclusions
In this paper, an evolutionary vision model for automatic AML leukemia recognition has been presented. The evaluation of the model shows that the structure of the solutions obtained denotes which visual properties are relevant for the recognition.
These properties can be identified from the visual operators that, when applied to different image types, give rise to the appropriate descriptors for the recognition task.
A particular case is presented in Figure 3 d), which denotes the structure of the best solution obtained for the recognition of leukemia types M3, M4, and M5; in which it can be noted that the S, H, and M color bands of the HSV and CMYK color spaces are relevant properties for the detection of these leukemia types. This is because these color bands are part of the visual operators of orientation
The results of the experiments to determine the usefulness of knowledge transfer showed that its use slightly improved the classification accuracy in all cases, achieving accuracy rates of
While without using knowledge transfer a maximum accuracy of
On the other hand, even when doubling the number of generations in the model training, the results did not improve, as can be seen in Table 4.
In this regard, the case for the recognition of four types of leukemia, the maximum classification accuracy achieved was
Finally, the experiments performed have shown that the hierarchical structure of the model and, the evolutionary process give some degree of explainability to the process, while the solutions found are interpretable by a human expert, which is not possible with automatic recognition methods as the convolutional neural networks.
The first author thanks the Autonomous University of Tlaxcala, Mexico for their support. The authors also express their gratitude to the Applied Computational Intelligence Network (RedICA).

