


 text new page (beta)
 English (pdf)
 Article in xml format
 Article references
 Send this article by e-mail
 Cited by SciELO
  Similars in
SciELO
Similars in
SciELO 
 Permalink
1 Introduction
Currently, terms such as smart industry and Industry 4.0 paradigm are very common in the scientific literature related to the automation of industrial plants. They aim to obtain high productivity levels, more competitive final products, and excellent compliance of the industrial safety standards. To achieve these objectives, the industrial systems must be equipped with condition monitoring systems for early detection, isolation, and location of faults that cause safety problems, economic loss, and environmental effects. This goal has guided a large amount of research on the topic of condition monitoring in industrial plants in the last twenty years [10, 25].
The methodologies for condition monitoring are divided into two groups [25]. The first group encompasses the methods based on the process models [6, 8].
The successful use of these methodologies depends on a deep understanding of the process, its operational parameters, and operating modes. However, this is very difficult to achieve due to the high complexity of current industrial systems.
The second group includes the data-driven methods, which do not need an accurate mathematical model, and initial deep knowledge of the process parameters [15].
Among the most used techniques in this group are the computational intelligence tools based on: fuzzy logic [9], clustering [19, 22], statistical tools [24] and artificial neural networks [17, 18] just to mention some of them.
The data-driven methodologies are seriously affected by noise and missing variables in measurements, which is usual to find in industrial plants. This indicates the necessity to consider these factors for obtaining satisfactory performances of the condition monitoring systems [12, 13]. A review of the scientific literature shows that in most papers the robustness versus noise and missing variables in the observations are not analyzed together.
Missing data in the observations can be due to several causes as sensor faults and problems in the operation of the data acquisition systems, just to mention some of them.
Missing data can be very important to find deviations not allowed in the operation of an industrial process.
For this reason, it is recommended to use imputation methods for their treatment [2, 12]. The non-standard Pythagorean fuzzy sets were presented in [27, 26], where it is shown that the space of Pythagorean membership grades is greater than the space of intuitionistic membership grades.
This represents an important advantage in condition monitoring because it allows the insertion of the uncertainty in the specification of membership degrees as result of noisy measurements and the data imputation.
The aim of this paper is to propose a robust condition monitoring scheme versus noise and missing variables in the observations obtained from an industrial plant. For this, it is presented a hybrid scheme that combines simple and effective imputation algorithms with Pythagorean fuzzy set tools.
In the methodology, the imputation of the missing variables in the observation obtained from the industrial plant is performed online to later get classified. The Pythagorean Fuzzy C-Mean algorithm (PyFCM), and its kernel version (KPyFCM) are used.
The proposal presents a high performance in presence of noise and the possible deviations that can be introduced in the imputation of the missing data.
2 Materials and Methods
2.1 Missing Data Imputation
The information loss has been modeled according to three main mechanisms: Missing Completely at Random (MCAR), Missing at Random (MAR), and Missing Not at Random (MNAR)[11].
In this paper will be used MCAR mechanism which is the one mainly occurring in industrial plants [12].
In the scientific information, several techniques for data imputation have been presented [2].
However, all of them make the imputation using the entire data set or part of it without considering time requirements. In most control loops in industrial plants, the time requirements are very important.
For this reason, the imputation of the missing variables must be done online for each observation obtained from the plant satisfying strict time requirements.
Furthermore, it is necessary to take into account the noise that affects the measurements in most industrial processes.
The imputation methods used in this paper are the arithmetic mean and the mode [11]. Their effectiveness and easy implementation were considered for their selection.
2.2 General Characteristics of the Pythagorean Fuzzy Sets (PFS)
In [27, 26], the PFS were introduced. The membership grades associated with the PFS will be called Pythagorean membership grades (PMG) and they can be expressed as follow:
– Two values,
– If
– If
–
–
–
where:
and
Lemma:
Proof: Squaring Eqs. (1) and (2).
and, by adding both equations:
From the Pythagorean theorem, it is known that
and hence:
Thus, it is evident that
In a general form, a PMG is represented by a pair of values
In this case,
Considering the pair
This indicates that a PMG is a point of a circle of radius r. Intuitionistic membership grades are also represented by a pair
Theorem: The set of Pythagorean membership grades is greater than the set of intuitionistics membership grades.
Proof: See [1].
The most significant consequence of this result is the possibility of using Pythagorean fuzzy sets in more situations than intuitionistics fuzzy sets. For condition monitoring applications, this characteristic of the PFS is very important for reducing classification errors.
2.3 Pythagorean Fuzzy C-Means Algorithm (PyFCM)
Considering the theory of PFS, the objective function on the PyFCM algorithm is similar to the one obtained for the Intuitionistic Fuzzy C-Means algorithm (IFCM) [3] according to the equation:
where
and
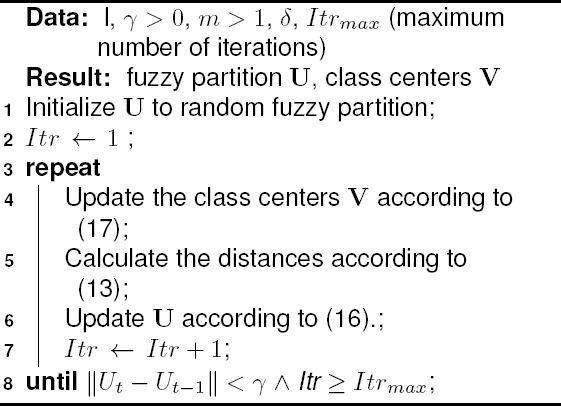
2.4 Kernel Pythagorean Fuzzy C-Means Algorithm
Kernel functions are used for mapping non-linear data from the input space to a higher-dimensional space.
This is very useful in classification tasks because it allows to achieve greater separability among classes, and reduce the classification errors.
In order to enhance the classification process, the kernel version of the PyFCM (KPyFCM) is obtained. In the KPyFCM algorithm the following objective function is minimized:
where
It is possible to find many different kernel functions in the scientific information. Nonetheless, the Gaussian kernel is one of the most popular.
In general, the choice of a function kernel depends on the application [5, 16]. If the Gaussian kernel function is used, then
where
where
KPyFCM algorithm is displayed in Algorithm 1.
2.5 Proposed Methodology
Figure 1 displays the proposed scheme in this paper for condition monitoring, which has two stages. The first stage is developed offline and the second one online.
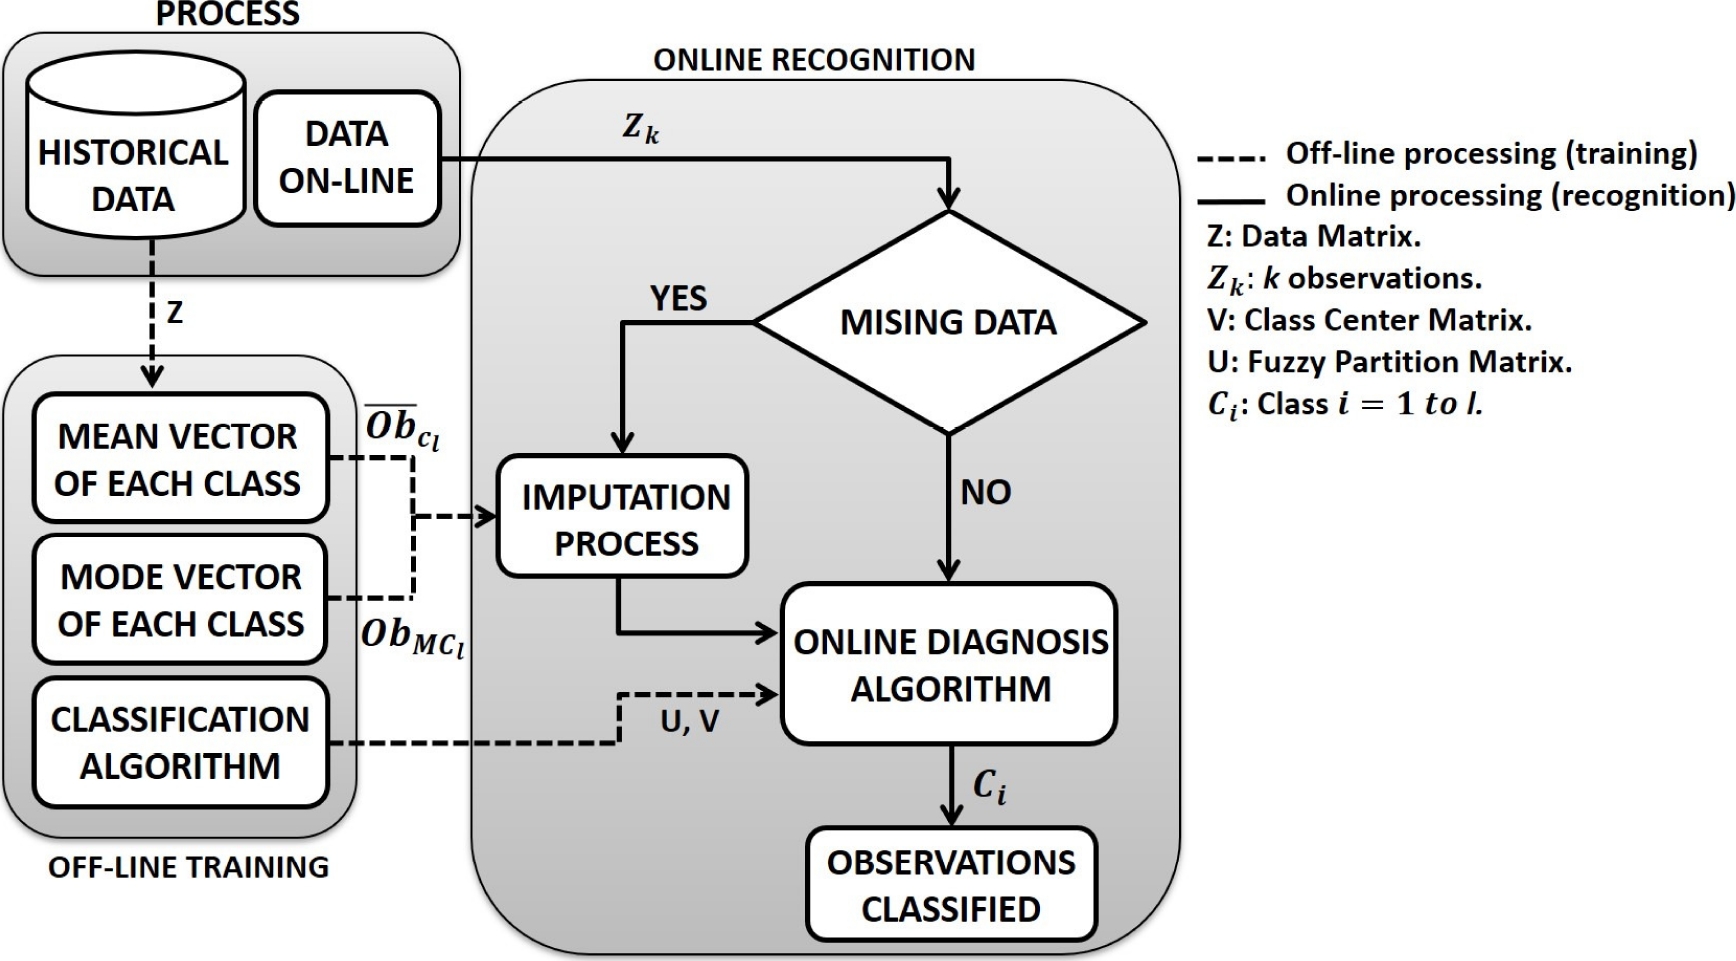
Fig. 1 Classification scheme for condition monitoring with noise and missing variables in the measurements
In the off-line stage, the fuzzy classifier is trained by using a training database with historical data representative of the l operation modes or classes of the process (normal operation and faults).
Also, the mean vectors
The training database must be preprocessed before its use to eliminate the outliers which affect the satisfactory obtaining of the mean vectors.
In the online stage, each received observation is analyzed to determine if it has missing variables.
In negative case, the classification process of the observation is carried out.
In affirmative case, the imputation process is executed and then the observation is classified.
Imputation process: If an observation with missing variables is received, the online imputation process is executed in the following form:
– An observation
The Euclidean distances from the observation
The observation is assigned to the class that corresponds to the minimum distance
– The imputation process is executed.
Classification process: If the observation has no missing variables or when the missing variables have been estimated, it is assigned to a class by the classification algorithm of the condition monitoring system.
If the degree of overlap among some classes is high, it is possible that the observation with the estimated variables will be classified in a different class than the one used for the imputation.
For the classification by using statistical classifiers, each observation is compared with the center of each class by using a measure of similitude to determine the class to which the observation belongs.
When fuzzy classification algorithms are used, the classification is made by using Eq. (18):
3 Study Case and Experimental Design
3.1 Case study: DAMADICS
To validate the proposed methodology, the DAMADICS (Development and Application of Methods for Actuator Diagnosis in Industrial Control Systems) test problem will be used.
It represents an intelligent electro-pneumatic actuator widely used in industries [4].
The information and the data sets related to this benchmark can be found in the URLfn. Table 1 shows the operation modes evaluated in the actuator and the measured variables used.
Table 1 Operation modes and measured variables in DAMADICS
| Operation | |||
| Mode | Description | Variable | Description |
| NO | Normal Operation | CV | Process control external signal |
| F1 | Valve clogging | P1 | Pressure on inlet valve |
| F7 | Critical flow | P2 | Pressure on outlet valve |
| F12 | Electro-pneumatic transducer fault | X | Valve plug displacement |
| F15 | Positioner spring fault | F | Main pipeline flow rat |
| F19 | Flow rate sensor fault | PV | Process value |
Selected faults occur in different parts of the actuator. In the case of faults F15 and F19, their patterns overlap, which makes difficult the satisfactory classification.
3.2 Design of Experiments
Table 2 shows the characteristics of the training database used, which is free of outliers, noise and missing variables.
Table 2 Characteristics of the training database
| Parameter | Description | Quantity |
| Operation Modes (Classes) | 6 | |
| Measured Variables | 6 | |
| Number of Observations per class | 1000 | |
| Number of Observation in the training database | 6000 |
K-cross-validation method was used in the training and validation.
The database used for the experiments related to the online stage had 400 new observations of each operation mode which were not used in the training for a total of 2400 observations.
Each experiment was repeated 100 times to ensure repeatability of results. The average of 100 results was considered as final result.
The data sets used in the experiments to evaluate the performance of the condition monitoring system had the following characteristics:
– Data set without missing information.
– Data set with 1 randomly missing variable per observation.
– Data set with a random number of missing variables between 0 and 2.
In addition, experiments for a) Observations without noise, b) Observations with 2 % of white noise and zero mean, and c) Observations with 5 % of white noise and zero mean were developed in each variant.
The values of the parameters used for the applied algorithms were: Number of iterations = 100,
4 Results and Discussion
4.1 Online Recognition Stage
It is very important to analyze the quality and the performance of a condition monitoring system. A widely used tool for this purpose is the confusion matrix (CM), which permits the analysis of the performance of classification algorithms.
The values
Then, all the necessary information to analyze the performance of a condition monitoring system can be obtained from the confusion matrix. In the paper, the metrics shown in the Eqs. (19), and (20) are used for studying the robustness of the proposed condition monitoring system:
where
Sensitivity is the proportion of observations of positive class (NOC) that are classified as positive (
The Receiver Operating Characteristic (ROC) curve is the graphical way of representing these values at a variety of thresholds. It shows the relation Sensitivity vs. (1-Specificity), in a two-dimensional graph.
The area under a ROC curve is greater when the separability among the classes is satisfactory. If the confusion among classes increases, the area under a ROC curve (AUC) decreases.
Figures 2-6 show the classification results for the faults 1, 7, 12, 15 and 19 by using the KPyFCM algorithm for DAMADICS process. They show a global classification percentage obtained for each data set.
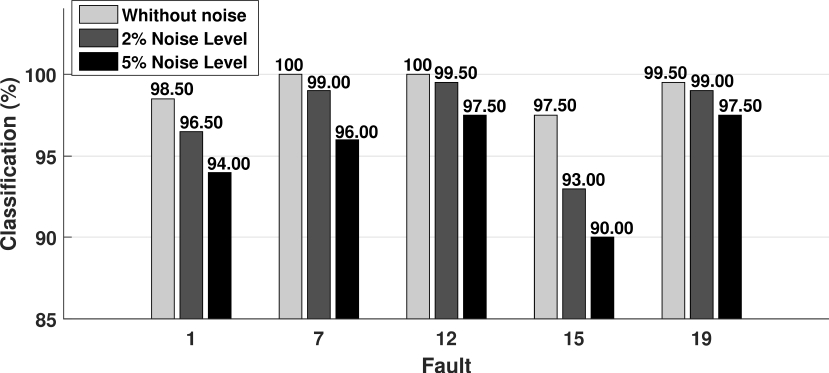
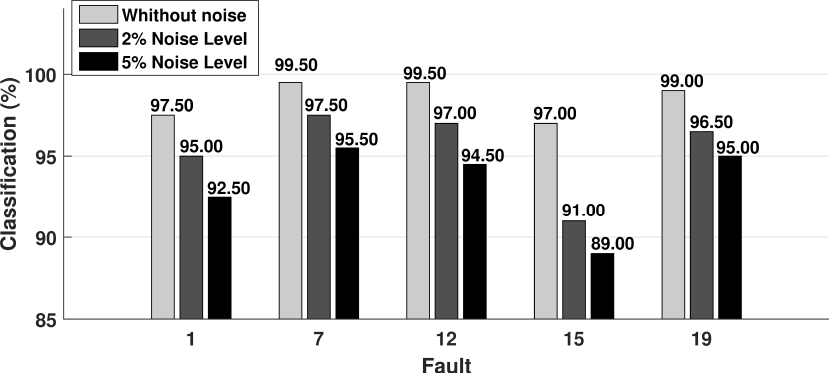
Fig. 3 Faults classification (%) for DAMADICS process (1 randomly missing variable, imputation with mean values)

Fig. 4 Faults classification (%) for DAMADICS process (Random number of missing variables between 0 and 2, imputation with mean values)

Fig. 5 Faults classification (%) for DAMADICS process (1 randomly missing variable, imputation with mode values)

Fig. 6 Faults classification (%) for DAMADICS process (Random number of missing variables between 0 and 2, imputation with mode values)
On the other hand, from the values of
Table 3 Values of TP, FN, TN and FP for each of the analyzed faults (random number of missing variables between 0 and 2; imputation with mean value
| Whithout noise | 2% Noise Level | 5% Noise Level | ||||||||||
| Fault | TP | FN | TN | FP | TP | FN | TN | FP | TP | FN | TN | FP |
| 1 | 193 | 7 | 785 | 0 | 186 | 14 | 754 | 4 | 183 | 17 | 737 | 9 |
| 7 | 198 | 2 | 780 | 6 | 193 | 7 | 747 | 10 | 188 | 12 | 732 | 15 |
| 12 | 198 | 2 | 780 | 3 | 191 | 9 | 749 | 6 | 185 | 15 | 735 | 10 |
| 15 | 192 | 8 | 786 | 9 | 180 | 20 | 760 | 23 | 177 | 23 | 743 | 27 |
| 19 | 197 | 3 | 781 | 4 | 190 | 10 | 750 | 16 | 187 | 13 | 733 | 20 |
The values displayed in the Table 4 are used to build the ROC curves associated to the analyzed faults.
Table 4 Results in % of the Sensitivity and (1-Specificity)
| Whithout noise | 2% Noise Level | 5% Noise Level | ||||
| Fault | Sensitivity | 1-Specificity | Sensitivity | 1-Specificity | Sensitivity | 1-Specificity |
| 1 | 96.50 | 0 | 93 | 0.53 | 91.50 | 1.21 |
| 7 | 99.00 | 0.76 | 96.50 | 1.32 | 94.00 | 2.01 |
| 12 | 99.00 | 0.38 | 95.50 | 0.79 | 92.50 | 1.34 |
| 15 | 96.00 | 1.13 | 90.00 | 2.94 | 88.50 | 3.51 |
| 19 | 98.50 | 0.51 | 95.00 | 2.09 | 93.50 | 2.66 |
The combination of high values of the Sensitivity metric and low values of the (1-Specificity) metric demonstrate a successful performance. Fig. 7 displays an example of the ROC curves for faults 1, 7, 12, and 15.
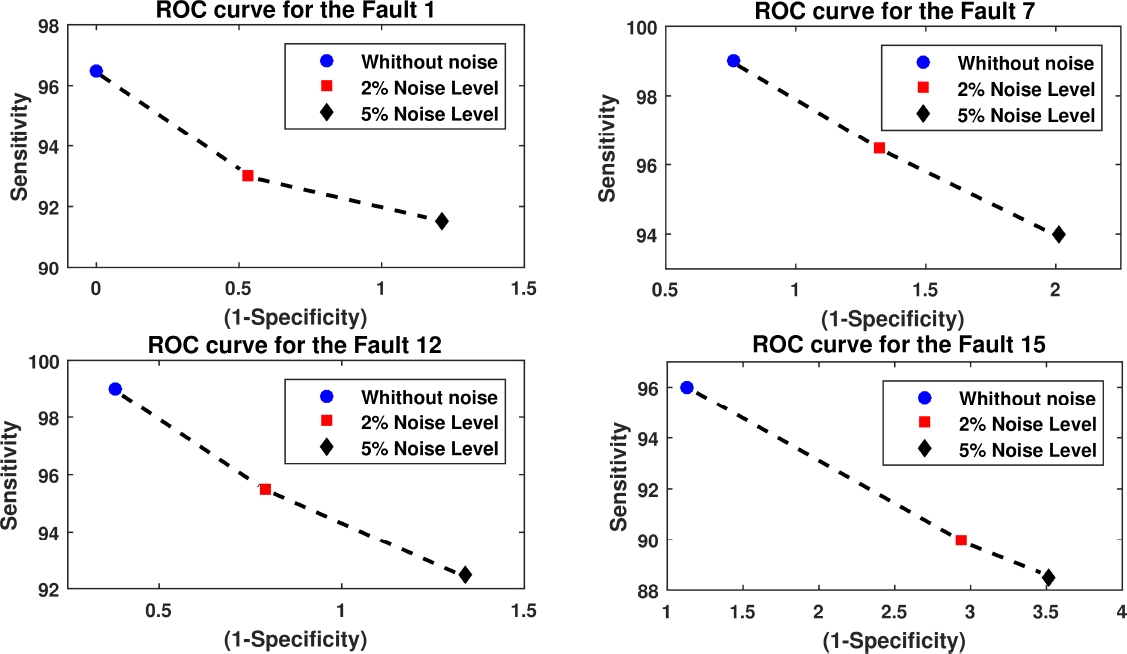
The excellent results obtained demonstrate the high robustness and validity of the proposed condition monitoring scheme, even when the process is disturbed by noise in the measurements and missing data.
4.2 Comparison with Other Similar Algorithms
Figure 8 shows the classification results by using the KFCM [21], KIFCM [23] and KPyFCM algorithms, considering a random number of missing variables between 0 and 2 using imputation with mean values and 5% of noise.
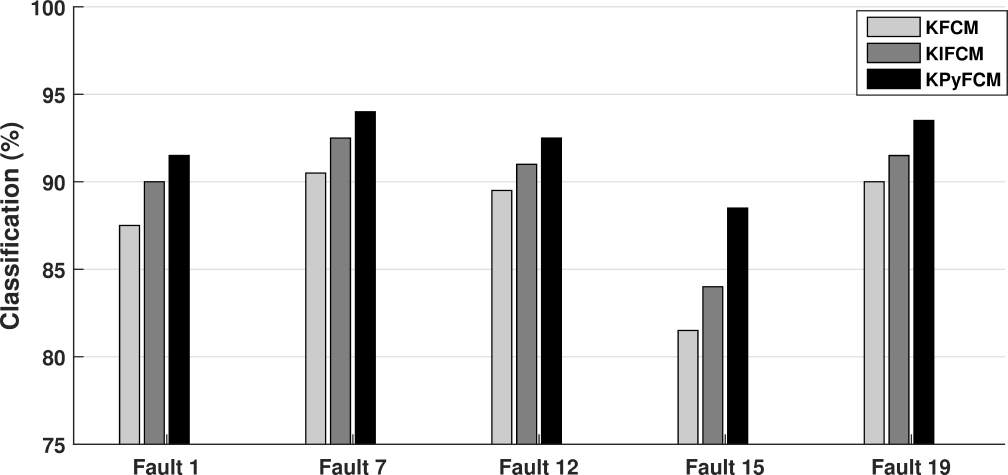
To establish if there are significant differences among the results of various algorithms, it is necessary to use statistical tests [7, 14].
4.2.1 Statistical Tests
First, the Friedman statistical test was applied, and as a result, the null hypothesis was rejected. This result indicates that at least one algorithm achieves results that are significantly different from the rest. Subsequently, the Wilcoxon test for a level of significance
5 Conclusions
This paper has presented a condition monitoring scheme for industrial plants characterized for its robustness versus noise and missing variables in the measurements.
In the experiments, different noise levels and distinct quantities of missing variables in the measurements obtained from the plant were combined. The high performance obtained in the classification shows the high robustness grade of the analyzed scheme. Another advantage of the proposal is to execute online the imputation process for each observation obtained from the plant that has missing variables.
This is a distinctive characteristic with respect to most proposals present in the scientific bibliography, which need to accumulate a group of observations before executing the imputation.
The implemented imputation methods are very simple so they have low computational complexity. This allows for their use in processes with short sampling times, which represents another advantage of the proposal.
For the classification process, the KPyFCM algorithm was implemented. In this algorithm, the capacity of the function kernel to achieve greater separability among the classes was combined with the possibility of the Pythagorean membership functions for using a larger set of numeric values for assigning the membership degree to an observation.
This provided an algorithm with high robustness that allowed the condition monitoring scheme to obtain high-performance levels versus noisy observations and with missing variables.
The proposed condition monitoring scheme was validated using the DAMADICS process benchmark where it obtained a high performance.

