


 text new page (beta)
 English (pdf)
 Article in xml format
 Article references
 Send this article by e-mail
 Cited by SciELO
  Similars in
SciELO
Similars in
SciELO 
 Permalink
1 Introduction
The detection and monitoring of violence related events is critical for security of people. Authorities often implement response strategies according to the occurrences of events in geographical areas. Nevertheless, they take actions mostly based on official data, which requires users to issue an official complaint about violent related events.
In some countries, the process involved in such complains is slow, tedious and discouraging, therefore most people avoid issuing such official reports in those places.
Social networks can serve to users as sensors for the monitoring of events happening in real timefn. In this context, social networks comprise a valuable information source for the detection and tracking of violent incidents, as people very often post publications notifying the occurrence of violent events in social networks as they occur.
This paper takes a first step towards using social media information for the monitoring of violent incidents. Specifically, we study the problem of recognizing posts associated to violent incidents in social networks starting from pure visual information.
This approach differs of most of related efforts, as they have traditionally focused on using textual information, see, e.g., [11, 7, 2], and Section 2.
The long term goal of our research is to build a map displaying the incident of violent events that could be useful for authorities, but mainly for users. In such a way that they can avoid risky zones.
In this first effort, we focus on the detection of violent incidents in Twitter using a convolutional neural network as feature extractor and several supervised learning models for classification.
We perform experiments in a recently released corpus for this task. Results obtained with the adopted methodology show that the detection of violent incidents is feasible when using only images.
Achieving performance that is even close with solutions based entirely on textual information.
However, recognizing the specific category of the incident (e.g., robbery or homicide) is a daunting task that requires further research and specialized methodologies. The contributions of this paper are as follows:
– We present the first study that aims at detecting violent incidents in Twitter by using only visual information.
– We show the feasibility of the task, but also show that this is an open problem that deserves further attention from the IA community.
– We report the first results obtained in the DA-VINCIs corpus when using visual information only.
The remainder of this paper is organized as follows. Next section reviews related work on the monitoring of violent incidents in social networks. Section 3 presents the DA-VINCIS corpus.
Section 4 describes the adopted methodology for solving this task. Next, in Section 5 we report experimental results. Finally, in Section 6 we outline conclusions and discuss future work directions.
2 Related Work
The monitoring and detection of violent incidents from social networks (e.g., Twitter and Youtube) has received increasing attention in the last few years.
Approaches for this problem are divided into automatic and manual methods, the latter usually being statistical studies (after the events) on manually labeled data and seeking to give a political, socioeconomic and/or psycho-physiological explanations for violent events and characteristics that can help detect the event, conditions that cause it or people that can produce it, see e.g., [9].
On the other hand, automatic studies aim to build predictive models for detecting and monitoring the occurrence of events of interests, where the models can work under different data modalities (e.g., text, images, audio, etc).
Textual models generally rely on the identification of textual elements related to violence such as keywords or expressions, in order to distinguish posts associated to violent incidents from general posts [11, 7, 2]. Other approaches target the more complex problem of recognizing fine-grained categories of violence incidents in users’ posts. For instance, Mata et al. considered the following categories: Theft, Crime, Theft with violence, Theft walking, Theft in car, Theft without violence [6]. Other works considering additional categories are those in [14, 3].
Although there are already several studies focusing on violent event detection from text, they have mostly focused on English (an exception is [6] focused on Spanish), and they have not considered additional information that is often available in social networks data.
Methods for processing visual information make use of feature extraction, either manually or with pre-trained models, and apply machine learning techniques to make the final decision.
For example, Weber et al. describes a system for the detection of natural disasters in the wild [4], where images downloaded from Google, Flickr and a specialized dataset were used to create an automatic detector of incidents of natural origin, its approach was based on capture photos uploaded by users in the process of an incident.
Other approaches have been proposed for the analysis of violent incidents in videos, however most of these are associated to video surveillance scenarios, see [13, 8, 12]. Despite there are some approaches relying visual information, they have not focused on violent incidents using information derived from social networks such as Twitter. This paper presents the first results dealing with this scenario.
3 DA-VINCIS Corpus
The dataset used for experimentation in this paper is the recently released DA-VINCIS corpus [1]. DA-VINCIS is formed by tweets in Mexican Spanish associated to reports of violent incidents and where each tweet is associated to one or several images.
It is formed by 5,000 tweets that were manually annotated by a platform developed by the DA-VINCIS’ team.
Each tweet was labeled by at least 3 annotators and the relevance of images to tweets has also been indicated by annotators. The following categories are considered in the corpus:
– Accident: Eventual event or action that results in involuntary damage to people or things.
– Homicide: Deprivation of life.
– Theft: Seizure or willful destruction of the property of someone else without the right and without the consent of the person who can legally dispose of them.
– Kidnapping: Deprivation of liberty.
– Non-violent: That does not belong to any of the previous classes.
The classes defined for the corpus were determined based on the matches of [14, 9] and multiple peace reports, see [1] for further details on the construction of the dataset. The original proportion of samples from each category is shown in Table 1.
Table 1 Percentage of samples from each class that were included in the DA-VINCIS corpus [1]
| Categories | % Total |
| Accident | 33.45 |
| Homicide | 7.75 |
| Theft | 5.31 |
| Kidnapping | 1.33 |
| Non-violent | 53.49 |
Since a single tweet can be associated to more than one category (e.g., tweets associated to a theft that also resulted in homicide) the associated pattern classification task is one of multilabel classification.
Additionally, a binary classification task can be defined as distinguishing between a sample being associated or not to a violent incident. In this setting, all of the categories associated to violent incidents are collapsed into a single one.
Table 2 shows samples of the considered dataset for each category, each sample is composed by an image and the original text description from the tweet it was extracted. It is important to mention that annotators took into account additional information in text when labeling the images.
Table 2 Samples from the DA-VINCIS corpus for the violent incident categories
| Categories | Image | Original text | Translation |
| Accident |
 |
#Ahora Reportan accidente de tránsito en el ingreso al municipio de Salcajá. Dos vehículos tipo pickup involucrados en el percances. Precaución al conducir por el sector. Ampliaremos la información. #Stereo100Noticias | #Now Car accident is being reported at the entrance of the Salcajá municipality. Two pickup vehicles involved. Caution when driving nearby. We will extend the information #Stereo100Noticias |
| Homicide |
 |
La violencia y las ejecuciones continúan cada día en la CDMX un hombre fue ejecutado a 2 calles de la alcaldía de Cuauhtémoc en la calle de Pedro Moreno | Violence and killings continue every day in CDMX a man was killed two blocks from Cuauhtémoc town hall in Pedro Moreno st. |
| Theft |
 |
Imágenes en las que un sujeto que ingresó a robar a un local ubicado en Av.Tonalá y Madero en la Cabecera Municipal. El hombre iba armado y después del robo huyó en un auto Kia color gris que lo esperaba afuera del local. | Footage in which a subject that entered to steal a facility in Av. Tonalá and Madero in the municipality. The man was armed, and after the robbery escaped in a gray Kia that was waiting outside the facility. |
| Kidnapping |
 |
Secuestraron a sujeto frente al palacio municipal de Coatzacoalcos A plena luz del día realizan acto delictivo; los detienen y desarticula UECS banda de plagiarios recién formada; se quedan en el Cereso Duport Ostión | A man was kidnapped infront of Coatzacoalcos’town all. The criminal actwas perfored duringdaylight; they were arrestedand the UECS dismantleda band of kidnappers justformed; they are staying in the Duport Ostión prision. |
4 Classifying Violent Incidents from Visual Information
As previously mentioned, we approach the problem of classifying images according to violent incident categories. Specifically, we approach the problem as binary and multi-label classification tasks.
On the one hand we aim to determine whether an image is associated or not to a violent incident (binary classification). On the other hand we aim to determine the violent incident(s) associated to the image (multi-label classification).
For approaching both tasks, we relied on convolutional neural networks (CNNs), because these are the established methodology for image classification.
Based on extensive preliminary experimentation, we adopted a methodology based on feature extraction with a pretrained CNN and used several classification models for prediction.
Specifically, we used a ResNet18 model [5] pretrained in ImageNet to represent images (we used the layer before the softmax as the representation for images) and then feed the representations to supervised learning methods.
As a preprocessing step, images are resized to
As classification models we consider the following: Multilayer Perceptron (MLP), Support Vector Machines (SVM), K-Nearest Neighbors (KNN) and Random Forest Classifiers.
A grid search process was applied on validation data taken from the training set partition in order to find the best parameters for the classifiers to improve the
– For the SVM classifier, “C” and gamma parameters.
– For the MLP classifier, the number of hidden layers and number of neurons in the hidden layer, and the alpha parameter.
– For the KNN classifier, the number of neighbors used for classification.
– For the Random Forest Classifier, the number of trees in the forest, the max depth of the trees in the forest and the max features parameter.
In the next section we report experimental results obtained with these classification models. We would like to emphasize that several other methodological variations were evaluated but we only report the one that obtained the best performance.
5 Experimental Results
This section presents experimental results obtained using the DA-VINCIS corpus.
5.1 Experimental Settings
Each sample in the DA-VINCIS dataset is formed by a text entry and the accompanying images (if any). For experiments reported in this section we only used visual information.
We used the official splits suggested by the authors of [1]. Under such partitioning, we obtained a training set of 3763 images, and a test set of 2318 images.
Please note that the total number of images varies from the original one, this is due to the fact that each Tweet often comes with more than one image and we have used every image associated to Tweets, the per-class proportions of the dataset of images is shown in Table 3.
Table 3 Percentage of samples from each class that were included in the multi-label classification task
| Categories | % Total |
| Accident | 33.46 |
| Homicide | 3.60 |
| Theft | 6.85 |
| Kidnapping | 3.19 |
| Non-violent | 52.88 |
It can be seen that the class imbalance ratio is maintained and there are only minor variations with respect to the original dataset (see Table 1).
The training partition was further divided to perform grid search. The test partition was only used for evaluation purposes.
Please note that since we are using exactly the same partition as the organizers of the DA-VINCIS@IberLEF shared tasks, our results are directly comparable with those of the participants.
With the clarification that participants for such shared-task used only textual information.
We used as evaluation measure the macro average of precision, recall and
For the binary classification task we report precision, recall and
5.2 Detection of Violent Incidents
As previously mentioned we approached two subtasks using the same corpus. A binary classification problem consisting in distinguishing between images depicting violent incidents or not, and a multi-label classification task that consisted of recognizing the categories of violent events. In the following we report experimental results for both formulations.
Table 4 shows the classification performance obtained by the different models that we considered in the multi-label classification task. The parameters used for each classifier were:
– SVM: (C: 10, gamma: 0.1, kernel: rbf).
– MLP: (alpha: 0.1, hidden_layer_sizes: 4, max_iter: 7000, solver: lbfgs).
– KNN: (n_neighbors: 1).
– Random Forest: (criterion: gini, max_depth: 6, max_features: auto, n_estimators: 500).
Table 4 Performance of the proposed methodology in the multi-label classification task
| Methodology | Accuracy | Precision | Recall |
|
| SVM | 0.67 | 0.49 | 0.33 | 0.33 |
| MLP | 0.59 | 0.31 | 0.32 | 0.31 |
| KNN | 0.59 | 0.35 | 0.34 | 0.34 |
| Random Forest | 0.67 | 0.26 | 0.31 | 0.28 |
It can be seen from this table that performance is rather low in terms of
Even when it is a 5-class classification task,
The obtained accuracy values seem to confirm this hypothesis. Figure 1 shows the confusion matrix for best model (SVM) in the multi-label classification problem.

It can be seen that the most problematic class is Non-violent event.
In fact the matrix suggests that the SVM model is predicting the majority class most of the times. The second most frequent class, Accident, is also confused with several other classes.
To further illustrate the errors made by the multi-label classification model, Table 5 shows some samples that were miss classified and that correspond to common mistakes according to the confusion matrix in Figure 1.
Table 5 Confusion Matrix of SVM in the multi-label classification task
| Image | Values |
 |
Predicted value: Accident, Actual Value: None |
 |
Predicted value: Accident, Actual Value: Theft |
 |
Predicted value: Accident, Actual Value: homicide |
 |
Predicted value: None,Actual Value: Theft |
Some images are blurred due to explicit content. From this figure it can be seen that the presence of certain objects bias the classifier to make a wrong prediction.
For instance the presence of cars make the classifier to predict accident in most of them. Experimental results for the binary classification task are shown in Table 6. The parameters used for each classifier were:
– SVM: (C: 1, gamma: 0.1, kernel: rbf).
– MLP: (alpha: 1e-07, hidden_layer_sizes: 3, max_iter: 7000, solver: lbfgs).
– KNN: (n_neighbors: 30).
– Random Forest: (criterion: gini, max_depth: 6, max_features: auto, n_estimators: 500).
Table 6 Performance of the proposed methodology in the binary classification task
| Methodology | Accuracy | Precision | Recall |
|
| SVM | 0.73 | 0.72 | 0.69 | 0.71 |
| MLP | 0.69 | 0.68 | 0.62 | 0.65 |
| KNN | 0.72 | 0.68 | 0.73 | 0.71 |
| Random Forest | 0.71 | 0.70 | 0.68 | 0.69 |
This time, performance looks more competitive, since the number of samples depicting or not violent events are comparable, class imbalance is not a problem now.
This is also evidenced by the closeness of values between accuracy and
Figure 2 shows the corresponding confusion matrix for the binary classification task. Interestingly, false positive and false negative rates are comparable.
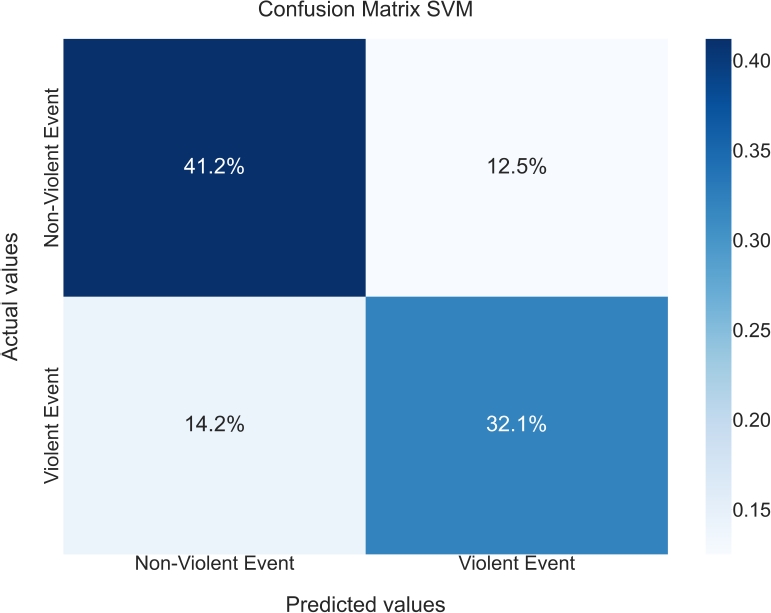
5.3 Comparison with Text Based Approaches
As previously mentioned, the same partitioning of the DA-VINCIS corpus that we considered, was used in the context of the DA-VINCIS @ IberLEF shared tasks [1].
The same binary and multi-label classification tasks were considered but participants had access to text information only.
From a modeling perspective, the use of text data provides more valuable and discriminative information to build predictive models.
Still, wanted to evaluate the performance gap between methods using either textual or visual information only.
Therefore, we compare in this section the performance obtained by our models and those from participants of the aforementioned shared tasks.
The results for multi-label classification considering 5 classes compared with IberLEF 2022 results in Table 7.
It can be seen from this table that the performance of our solution achieves slightly lower behavior than the lowest ranked participant (row 3).
Despite this looks like a negative result, we think this is encouraging: we are using only visual information with a standard image classification pipeline and we achieve performance close to that of models based on transformers and GAN-networks as in [15].
The corresponding comparison for the binary classification task is shown in Table 8.
Table 8 Results for binary classification compared with IberLEF 2022
| Results | Precision | Recall |
|
|
|
0.775 | 0.750 | 0.803 |
| Average | 0.754 | 0.745 | 0.763 |
|
|
0.726 | 0.742 | 0.710 |
| Ours | 0.72 | 0.69 | 0.71 |
A similar pattern can be observed, this time the proposed method achieves virtually the same performance as the lowest ranked text based method.
This is again encouraging, using visual information only we are able to obtain competitive performance with strong text based classification models that were based on transformers, see [1].
6 Conclusions
We have described a study that aims at detecting violent events in tweets by using visual information only. A standard classification methodology was adopted and experimental results for two experimental settings were reported.
Our results are promising: the performance of a model considering visual information only is able to match the performance of sophisticated models that rely on textual information. This is remarkable as text undoubtedly provides more clues for the classification of Tweets.
We found that detecting images associated to violent incidents is feasible, but the recognizing the specific type of violent incident is a much more complicated task. Our study will motivate further research on the subject for sure. Perhaps the main conclusion of this work is that it is very difficult to classify images into multiple classes using only visual information.
This is because often it’s hard to tell the difference between different classes of images, especially when the classes are very similar.
Additionally, there may be a lot of noise in the data that can make it difficult to learn a good classification model.
The lack of context can radically change the meaning of an image, just like an ambiguous image such as memes, which with the correct description can represent and transmit a different and sometimes contrary range of emotions, images related to violent incidents are ambiguous and difficult to classify due to the similarity of some classes (even for humans, the kappa coefficient reported in [1] is 0.57).
This work is a first approximation to evaluate how context-free images could perform, the results, although fine-grained are not excellent, in binary classification are competitive, demonstrating that images have important information that can be leveraged for social network monitoring.
As future work, the idea of experimenting with a larger dataset, and the addition of less frequent classes such as sexual crimes is proposed, the application of the model for prediction in real time geographically and its performance, and finally the use of generative networks to have a perspective of the representations learned by the model, also the use of other architectures.

