


 nueva página del texto (beta)
 Inglés (pdf)
 Artículo en XML
 Referencias del artículo
 Enviar artículo por email
 Citado por SciELO
  Similares en
SciELO
Similares en
SciELO 
 Permalink
1 Introduction
Neurological disorders are diseases that attack the central nervous system, that is, the brain, spinal cord, as well as their respective peripheral nerves, cranial and peripheral nerves, nerve roots, the autonomic nervous system, neuromuscular plate, and muscles [15, 12].
Figure 1 shows a scheme from the World Health Organization (WHO), in which the bottom bar corresponds to a approximation of the number of deaths worldwide that occurred in the year 2019, being approximately 19 million people. The second bar represents the estimated number of worldwide deaths for each year caused by cardiovascular accidents, which is more than 6 million people. Above the third bar represents the total number of people suffering from epilepsy, with a total of 50 million. And the top bar represents the total number of people suffering from dementia worldwide, which is 47 million people.
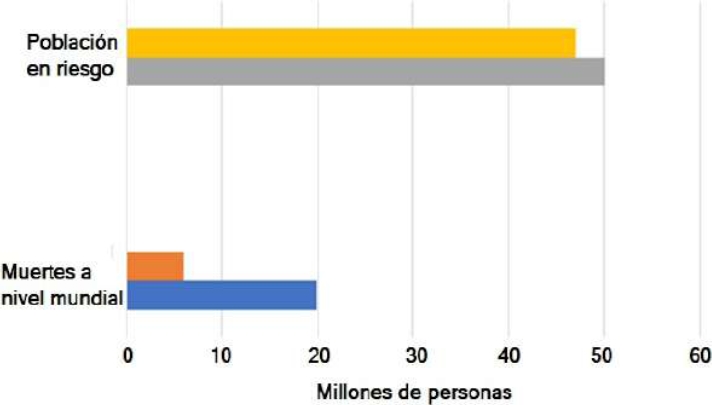
Fig. 1 Population at risk contrasted with the number of total deaths worldwide in the year 2019 [15]
This last figure will increase with 7.7 million new cases each year. Of all these, a large majority is due to Alzheimer’s [15]. Finally, to a lesser extent, but still important, 10% of the world population suffers from migraine. These types of diseases are more common than you think, or that is recorded.
Figure 2 shows projections for the percentage of total deaths in the world, attributed to neurological disorders by WHO in collaboration with other institutions, for past and future years.
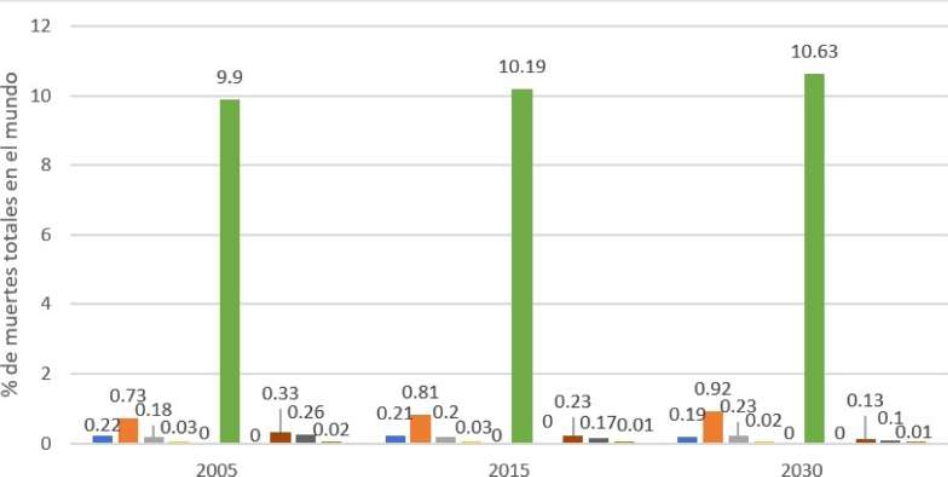
Each year the main neurological diseases are listed by bars, being Epilepsy, Alzheimer’s and other dementias, Parkinson’s disease, Multiple sclerosis, migraine, cerebrovascular diseases, Poliomyelitis, Tetanus, Meningitis and Japanese Encephalitis, respectively [1].
While most diseases are estimated to cause as few deaths as they do today, Alzheimer’s and other dementias stand out. Not to mention diseases and cerebrovascular accidents, causing almost 10% of total deaths in the world, and is already considered one of main causes of death and it is estimated that this figure is only increasing [15, 16]. Just as there are various pathologies that attack the central nervous system, there are also various therapies for each specific disease, these therapies seek to minimize or offset the consequences that this type of pathology and disorder produces in the patient.
For which, comprehensive neurological care is carried out that, in addition to including drugs, also includes neurorehabilitation therapies, which aim to improve the quality of life of the patient and facilitating its performance in society [14, 26]. The knowledge of these therapies focused on motor and cognitive functions is dynamic. Since 1970, with the observations of John Lilly about the intelligence of dolphins and their interaction with the human being, we constantly seek to improve and find new, more effective techniques that produce an improvement in the patient [25]. Dolphin-Assisted Therapy (DAT) is carried out as part of the treatment of people suffering from:
– Epilepsy.
– Attention Deficit Hyperactivity Disorder (ADHD).
– Nervous problems.
– Down syndrome.
– Motor, hearing and speaking problems.
– Autism Spectrum Disorder (ASD).
– Among other conditions.
In addition, improvements have been observed in the interaction between the patient’s neurons, an induction to a state of relaxation, stimulation of brain activity, strengthening of motor movements and improvement in coordination, improvements in the emotional state and in the immune system, Among other benefits that have also been observed are more effective in children [25, 5, 2].
It is important to point out that the experimental part of the present study was developed at the facilities of Delfiniti de México SA de CV, Boulevard Ixtapa SN Lot Annex 6 B Hotel Zone 1, 40880 Ixtapa Zihuatanejo, Guerrero, Mexico.
Under the supervision and direction of Víctor Hugo Calderón Morfín. The present work is based on the analysis of Dolphin-Assisted Therapies, resulting from the interaction between these cetaceans with humans.
Therapy that presumably positively affects the patient’s central nervous system through its echolocation, which is a biosignal. Biosignals are those waves that are produced by a living being in its physiological system.
In this sense, electroencephalographic biosignals are the result of electrical interaction between cells in the brain.
There are also non-electrical biosignals known as bioacoustics, which are interactions that by means of a sound wave emitted by a living being, modify the pressure in a medium such as air or water. To capture bioacoustic signals in such media, a microphone or a hydrophone is used respectively.
For the analysis of the signals captured by the hydrophone, the Welch method is used, which is a technique that allows obtaining the statistical distribution that represents the power spectral density of the signal, with less noise compared to other techniques, but reducing the frequency resolution.
The case of the present work, the power spectral density refers to the average noise per unit of bandwidth. Thus, this work is divided into six sections. Section 2 explores the differences, advantages and innovations of this proposal.
Subsequently, in Section 3 the theoretical concepts that make up the general panorama of this work are exposed. In Section 4 regarding the methodological framework, the procedure carried out for the elaboration of the present analysis proposal is explained. Section 5 presents the experimental cases carried out to test the operation of the proposal, as well as the results obtained in them. Finally, Section 6 expresses the conclusions that were reached based on the results obtained.
2 Related Work
Application of Deconvolution to Improve Signal Quality in Processing of Wild Dolphin Signals in [24] has several similarities with the proposal described in the present work, doing a study with dolphins, in its particular case the Chinese white dolphin, focusing on the frequencies emitted by these.
In this way, they make use of a hydrophone to capture the signals, non-parametric techniques to process them and a power spectral analysis as a fundamental part for their visualization.
However, unlike the present proposal, it does not have a therapeutic nature nor does it use EEG to measure brain activity, since it does not study the effects that the frequencies emitted by dolphins have on humans.
Fractal dynamics of time series fluctuations for estimating the efficiency of dolphin-assisted therapies on children with trisomy 21 in [13] forms an important part of this proposal, being the antecedent to achieve the objectives sought.
Therefore, there are several similarities, since he makes a study of the effects that bottlenose dolphins produce in humans during the interaction given in an assisted therapy.
For which they measure the patient’s brain electrical activity by EEG, as well as using non-parametric techniques to process the results.
However, unlike the present proposal, they do not make use of a hydrophone since their focus is on the effects of the frequencies, and not the frequencies emitted by the dolphin themselves, therefore, they do not make a spectral analysis of power to determine the specific relationship of the frequencies emitted by the dolphin and the changes in electrical activity in the patient’s brain.
Emotion Classification from EEG Signals in Convolutional Neural Networks in [6] as its name implies, makes a classification of emotions from the analysis of EEG signals generated by the brain activity of various test subjects.
For which, it makes use of a stimulus other than a dolphin, which is a video generated in another work with the purpose of specifically producing the emotions studied. Therefore, it does not use a hydrophone, since it does not use frequencies emitted by dolphins and therefore also does not use a power spectral analysis, unlike the present proposal in which the stimulus is a dolphin during the therapy process assisted.
The analysis of the brain activity of a human being during a stimulation process partially coincides with the present work, however, this is done in order to measure the efficiency of the proposed method, thus lacking a therapeutic purpose.
Marine Mammal Sound Anomaly and Quality Detection Using Multitaper Spectrogram and Hydrophone Big Data in [21] like the present proposal performs a processing of the signals produced by aquatic mammals in general, without specifying dolphins, by using non-parametric techniques and a power spectral analysis to generate the multitaper spectrogram, the main contribution of this work.
However, despite the fact that the signals used are part of a database generated by a hydrophone, they do not use it as such, unlike the present proposal in which the direct use of the hydrophone is a fundamental part to generate the results.
In addition to this, the purpose of the multitaper spectrogram and the detection of anomalies is aimed at the future study of marine mammals in general, without considering the therapeutic properties in humans that the frequencies emitted by dolphins bring with them, an approach whose study is the main objective of this proposal.
Thus, the present proposal is the only one that contains all the factors considered, when doing a study with dolphins focused on an assisted therapy, observing their emitted frequencies and considering the effects on the human being through an EEG, it also uses a Brüel & Kjær hydrophone model 8103 for the capture of bioacoustic signals, non-parametric techniques for their processing and a calculation of the power spectral density for their analysis.
3 Theoretical Framework
DAT is a process with which benefits have been observed for the health of the patient and a considerable improvement in the treatment of neurological diseases.
Since the first experiments with animals, among these dolphins, with patients in mental institutions in England in the 19th century and later the observations of Dr. John Lilly in the mid-1970s [2], various studies and hypotheses have been carried out that seek to explain the capacities of this type of mammal, as well as the way in which they come to positively affect the human nervous system [25, 5]. Bottlenose dolphins, Figure 6 are considered the second most intelligent animals on the planet.


His brain is large in proportion to his body, surpassing the human being. They are able to recognize themselves in a mirror, a use of tools has been observed in their habitat, as well as a transmission of this knowledge for generations.
They communicate with each other by hissing and clicking, producing frequencies between 200 Hz and 150 KHz. In addition, they generate clicks with which it uses its echolocation to guide itself, which are on a frequency between 1KHz to 25 KHz.
Its hearing frequency spectrum is approximately 100 Hz to 150kHz [2]. Figure 3, shows a comparison of the auditory frequency spectrum of some animals compared to the human being and the hydrophone 8103 [22, ?, 20].
The positive stimulations to the patient are generally attributed to a synchronization of the frequencies emitted by the dolphin with the human brain, during the interaction with these cetaceans [25].
To obtain more information about this process, it is necessary to measure the factors that intervene during it and the reactions resulting from them.
The present work carries out an analysis of the frequencies produced by the dolphin, for which the development of the software tools necessary for the visualization of the analysis of the frequencies is carried out.
In the study of marine life, various tools are used to capture the behavior of living beings that inhabit this ecosystem. The fundamental tool for the present work is the Brüel & Kjær miniature hydrophone model 8103.
Manufactured for industrial and marine fauna research purposes, with a high frequency response, capable of measuring in a range of 0.1 Hz. at 180 KHz [3], which is suitable for the research purposes of this work.
To perform the analysis of the signal captured by the hydrophone, the Welch method is used to calculate the power spectral density or Power Spectral Density (PSD). Said method is used to determine the behavior of the energy or power, as the case may be, of the signal for each of the frequencies that make up it. In the case of the present work, the PSD is the average noise power per unit of bandwidth.
Acoustic power is expressed in units of watts. In audio measurements, power is commonly expressed in logarithmic terms with respect to a watt, that is, decibels (dB), while the unit of bandwidth is 1 Hz. Therefore, PSD is expressed as dB/Hz.
Additionally, the Welch method provides better results than a standard periogram, in addition to being an improvement to the Bartlett method, used for estimating the power spectral density.
Using Welch’s method, a signal change is made in the time domain to the frequency domain, obtaining a periogram, Figure 4, with lower frequency resolution, but less noise in the estimation power density [7, 23].
A certain number of samples are extracted from the signal obtained to construct the spectrogram, a tool that allows the signal to be visualized in three dimensions in a single view.
Being the time, frequency and power characteristics of the signal quickly observable by means of this [10, 9]. The accessibility of the information represented in the spectrogram, Figure 5 (b), visually, allows a comparison with the naked eye with the electroencephalogram.
In animal-assisted therapies, two types stand out, the first is the basic therapy in which an emotional improvement of the patient is sought through the casual company of an animal [17]. The case study of the present work is the second, rehabilitation therapy, which serves as a complement to other therapeutic indications in various conditions. Dolphin-assisted therapy, Figure 7 is recommended as a method for the improvement of motor functions, positive stimulation that improves learning capacity in children and as a treatment for neuronal disorders [2, 25]; the latter having as a fundamental factor the effect of biosignals. Biosignals can be electrical or non-electrical, examples of the former are magnetoscephalograms.

They can also be electroencephalograms, which are an important reference to test the hypothesis raised, measuring the changes produced in the patient’s central nervous system.
While the non-electrical signals are comprised of the bioacoustic signals, such as the echolocation of the dolphin, Figure 8, being the possible trigger for the therapeutic effects [19, 4, 5, 25].

For the measurement of these bioacoustic signals it is essential to use a hydrophone, Figure 9, a transducer widely used for military purposes, research of natural phenomena, and being our main interest, the study of marine fauna [3]; measuring the frequencies emitted by the dolphin during the assisted therapy process.

During DAT, the resulting power spectral analysis is contrasted with an EEG in the patient. An electroencephalogram is used to observe the behavior of brain activity, there are different techniques to be performed depending on the diagnosed condition.
There are invasive EEGs that require placing electrodes directly on the surface of the brain, mainly used in patients with epilepsy. In this analysis, a standard non-invasive encephalogram is used, in which the electrodes are placed on the surface of the head [11, 8].
Its objective is to observe the changes in the patient’s brain activity, Figure 10, in certain time periods during the dolphin-assisted therapy process.

The comparison and visualization of the data obtained is carried out by means of a power spectral analysis, Figure 11, which is divided into two types of techniques. depending on the parameters that are had prior to the analysis of the signal. In cases where parametric techniques are used, there is a prior notion of the behavior of the signal for its estimation, with fixed parameters that define the probability distribution to follow; this scenario is not the case of the present work.
On the other hand, the bioacoustic signal emitted by the dolphin is studied, which is a random signal for which there are no previously established fixed parameters, since each interaction is different.
Therefore, a non-parametric technique is required, which does not require previous estimations, being in particular the Welch method, which allows us an efficient analysis of the process by reducing noise in the system [10, 9, 23].
4 Power Spectral Analysis of Bioacoustic Signals
During the DAT process the comfort of the patient is a fundamental factor, the relaxation of the patient is a crucial element for the positive effects of the therapy to occur.
Due to this, part of the therapist’s efforts are aimed at generating the necessary confidence of the patient and the latter feels relaxed in an environment different from the one they are used to, with an animal of imposing dimensions such as the bottlenose dolphin.
Thus, the system developed must be sufficiently respectful of the process by not obstructing the work of the therapist, being the system to be analyzed thus guaranteeing reliable results during the collection of the data to be analyzed.
To do this, the team is positioned next to the therapy site, introducing the hydrophone into the water enough to collect the bioacoustic signal emitted by the dolphin.
The process proposed in the present work is described in Figure 12, where it shows that the input is the bioacoustic signal emitted by the dolphin during the DAT process.

To which a power analysis is performed to determine the behavior of the frequency in a set time interval for the analysis of the therapy. The result is a spectrogram that shows the results graphically, facilitating the analysis.
The latter is carried out in conjunction with the previous phase of the project, that is, the result of the electroencephalogram performed on the patient during therapy.
Thus, the power analysis of the bioacoustic signal of the dolphin allows to analyze the relationship between the patient’s brain activity and the power of the signal emitted by the dolphin, observing the characteristics of both signals graphically in the same interval of weather.
During the DAT, participants who are fundamental for it intervene, who are the therapist, the dolphin trainer, the patient and the dolphin.
However, it is the latter two on which the measurements and the corresponding analysis are carried out to determine the effect-cause correlation between them.
The characteristics to be taken into account in this proposal are the following:
– Patient with some neurodevelopmental disorder such as PCI: Analysis of the cerebral electrical fields resulting from the interaction between neurons during the process of therapy assisted by the dolphin.
– Female Bottlenose Dolphin: Bioacoustic signal emitted for communication between frequencies of 200 Hz and 150 KHz. In addition to these, the clicks emitted for its echolocation, which are on a frequency between 20 KHz to 150 KHz.
The patient’s brain activity is obtained using the ThinkGear ASIC Module v1.0 (TGAM1) sensor shown in Figure 13, prepared by the NeuroSky company, measuring the frequency bands of the brain waves, generating series of Raw time, that is, signals are processed raw.

It is through this sensor that the time series that describes the behavior of the electrical activity of the patient’s brain is generated, which is compared with the spectrogram generated from the power analysis of the bioacoustic signal.
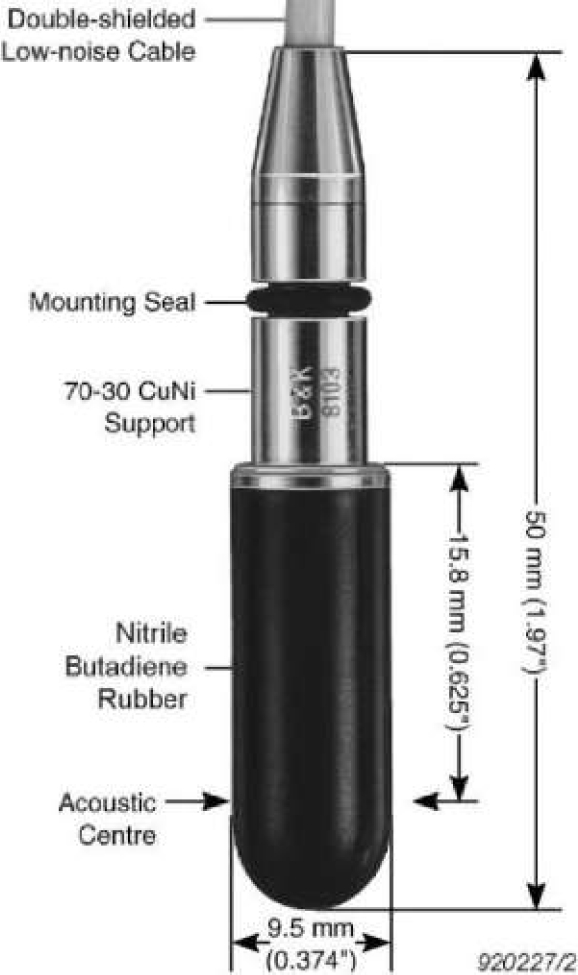
To collect the dolphin bioacoustic signal, a Brüel & Kjaer Hydrophone 8103 is used and its attachments to the sound card that allow communication with the computer equipment. This small size and high sensitivity transducer is used to perform absolute sound measurements in the frequency range from 0.1Hz to 180 kHz with a reception sensitivity of -211 dB referred to 1 V/µPa. It has a high sensitivity in relation to its size and good general characteristics, which make it generally applicable for laboratory, industrial and educational use. The high frequency response of the Type 8103 is especially valuable when conducting acoustic investigations of marine animals and in measuring pressure distribution patterns by ultrasound. It is also useful for cavitation measurements. Figure 14 indicates the main external characteristics of the type 8103 hydrophone. The analysis of the relationship between the bioacoustic signal emitted by the dolphin is carried out using software made in the MATLAB programming language, which is Matworks Inc.’s own programming language oriented to the design of scripts, that is, an interpreted language that has a set of predesigned functions for the execution of programs in mathematical language.
To carry out only the final stage of the program, that is, the analysis of the collected data, the minimum requirements of the MATLAB R2021a release are necessary:
– Operating System: Windows: Windows 7 SP1 onwards, Windows Server 2008 SP2 onwards.
– Mac: macOS 10.10 - 10.11
– Linux: Kernel 2.6 or higher, glibc 2.11 or higher.
– Processor: Intel or AMD x86-64 with AVX2 instruction support.
– Disk Space: 2 GB only for MATLAB, 4-6 GB for an installation of the most common libraries.
– RAM: 2 GB minimum.
– Graphics card: OpenGL 3.3 support.
– Bluetooth version: 4.0 or higher.
However, the ideal requirements of the equipment in which the MatLab R2020d version is installed for the software proposed in this work are:
– Operating system: Windows 10.
– Processor: Any Intel or AMD x86-64 processor with four physical processors and/or eight virtual processors.
– Disk Space: Solid state SSD or M.2 disk is desirable. For a complete installation of all libraries, 30.3 GB of space is required.
– RAM: 2 GB per virtual core.
– Graphics card: Support for OpenGL 3.3 with 1GB.
– Bluetooth version: 4.0 or higher.
In addition to this, the data acquisition process during dolphin-assisted therapy requires the following devices:
– Sensor ThinkGear ASIC Module v1.0 (TGAM1).
– 2 Web with Standard Resolution or SD, although it supports high definition or HD.
– USB-DAQ 8/2-ch Production Analysis Board.
– Delta Tron charge converter with integrated TEDS.
– BNC (male) to 10-32 UNF (female) adapter.
– Brüel & Kjær Model 8103 miniature hydrophone with 10-32 UNF cable (male).
Once the program is executed, the folders are created on the local disk of the computer equipment used for the analysis. These folders are intended to store the samples collected in each analysis.
Control over the procedure within the program is carried out through integrated development environments or IDEs for each part of the process in order to be intuitively managed by the user.
In this way, the execution of the program is divided into modules through which the user has graphical access to the control of the system.
Each module is divided into functions with specific purposes, in this way the execution of the program is carried out efficiently by dividing the process into sequential threads that, due to their short length, reduces the processing capacity necessary for the execution of the entire full process.
Each function is executed through indirect calls or handles, which allow its sequential execution as well as the passing of data between them.
5 Experimental Results
In order to test the operation of the system, a data capture was made using all the sensors. The test was carried out with a duration of 5 minutes, with the dolphin present to capture the bioacoustic signal through the use of hydrophone 8103.
Additionally, the help of a control subject without any diagnosed condition was requested, who was positioned to one side tank for EEG analysis.
Once the data acquisition process was completed, the Analyze option corresponding to the FFT option was selected in the Analysis IDE.
This action checks if the use of the hydrophone is part of the saved configuration. Since this is the case of the test carried out, an indirect call is made to a function that allows graphing the raw data, both from the hydrophone and from the EEG.
In the case of the hydrophone, first the sensitivity of the same is established, as well as the total sample, the analysis time, 5 minutes in this case, and the folder created for the patient is established as the destination path for the results.
Also, the collected raw data is plotted, thus generating the time series corresponding to the Volts referred to Pascals (V/Pa) captured by the hydrophone in every 1/
Additionally, the images generated by the webcams are saved as image files in the patient folder. Subsequently, through an indirect call to a function, the estimate of the power density is obtained.
For this, the minimum frequency to which the hydrophone is sensitive is adjusted corresponding to
The pwelch function within the MATLAB Signal Processing Toolbox is used to obtain the Welch transform using a kaiser window of size
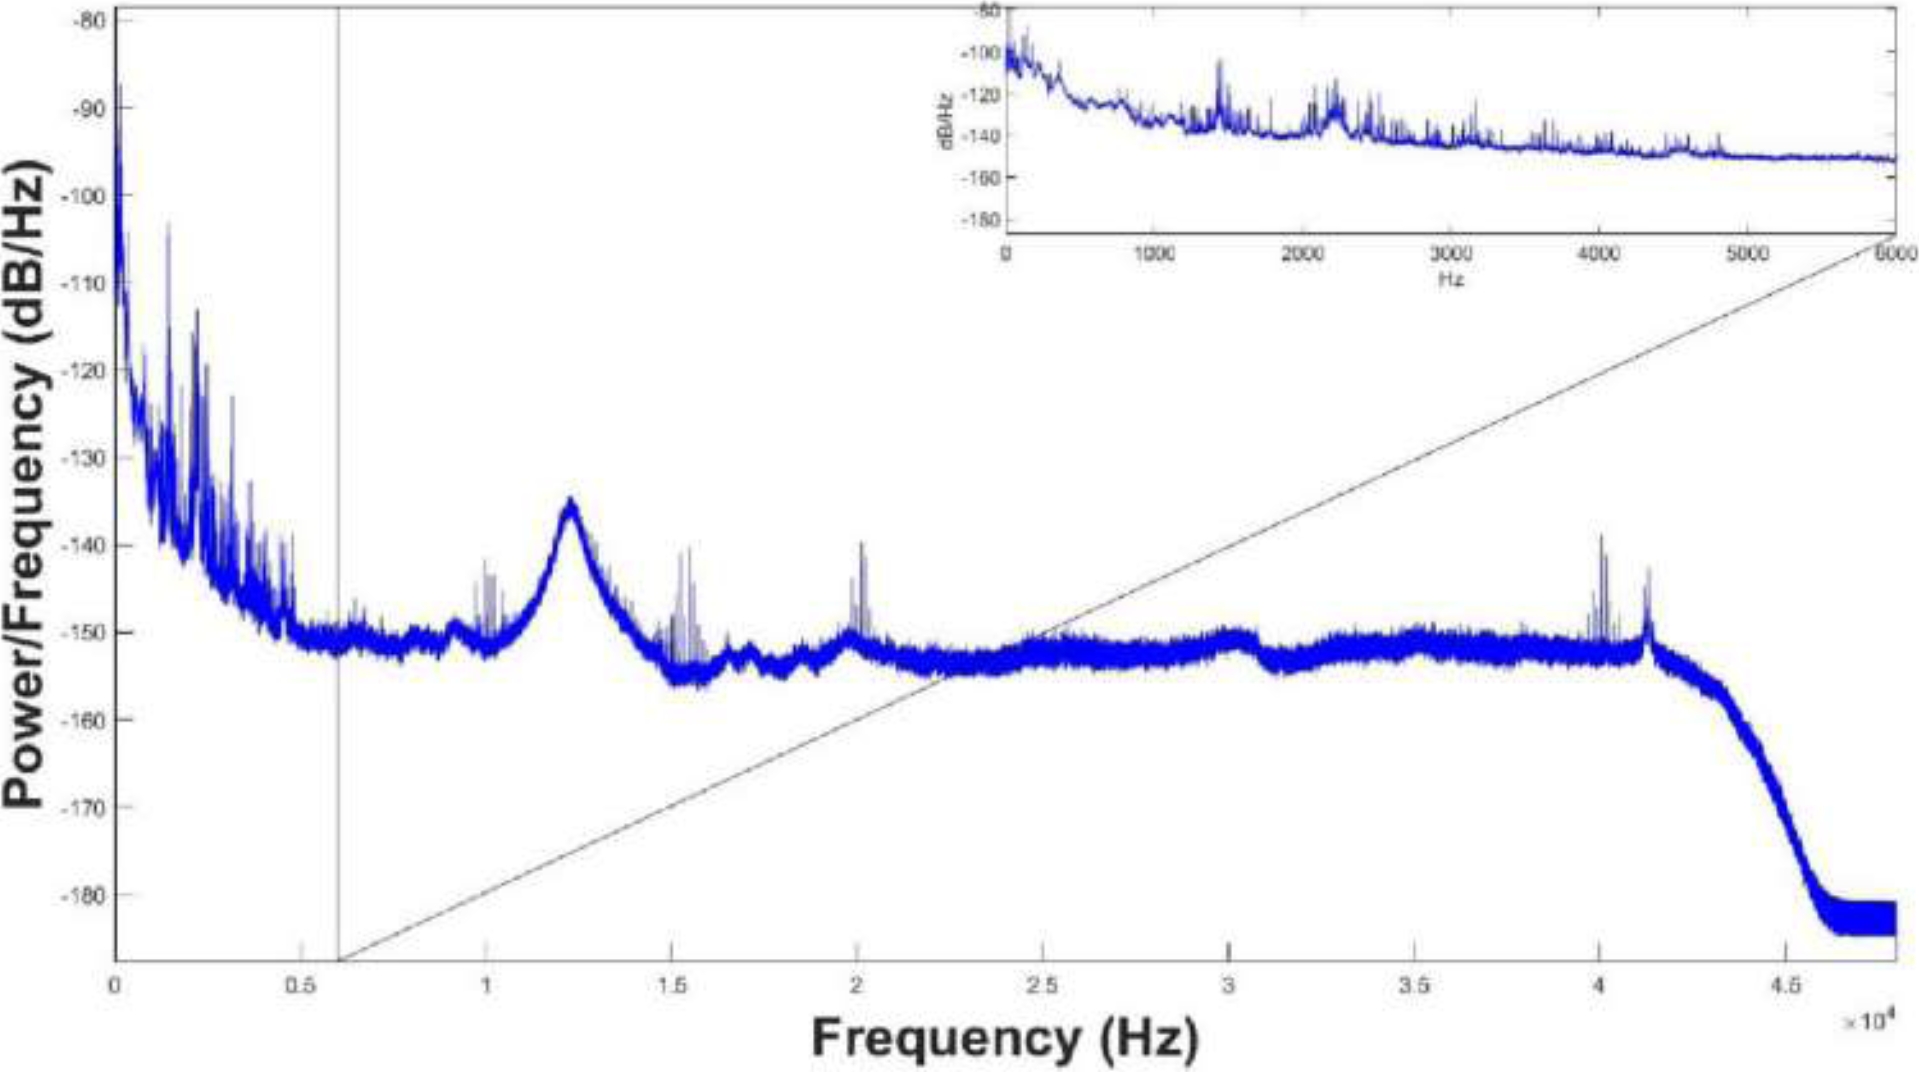
In Figure 16, the graph resulting from the estimation of the power density expressed in decibels (dB) referred to Hertz (Hz) is shown, for each of the frequencies (Hz) captured by the hydrophone 8103 during experimentation.

Next, the spectrogram function is used within the MATLAB Signal Processing Toolbox with a kaiser window of size (2/0.1) x
It calculates the short-time Fourier transform of the frequencies captured every 1/fs second, for this, a normalized vector is defined at the maximum frequency estimated by the hydrophone.
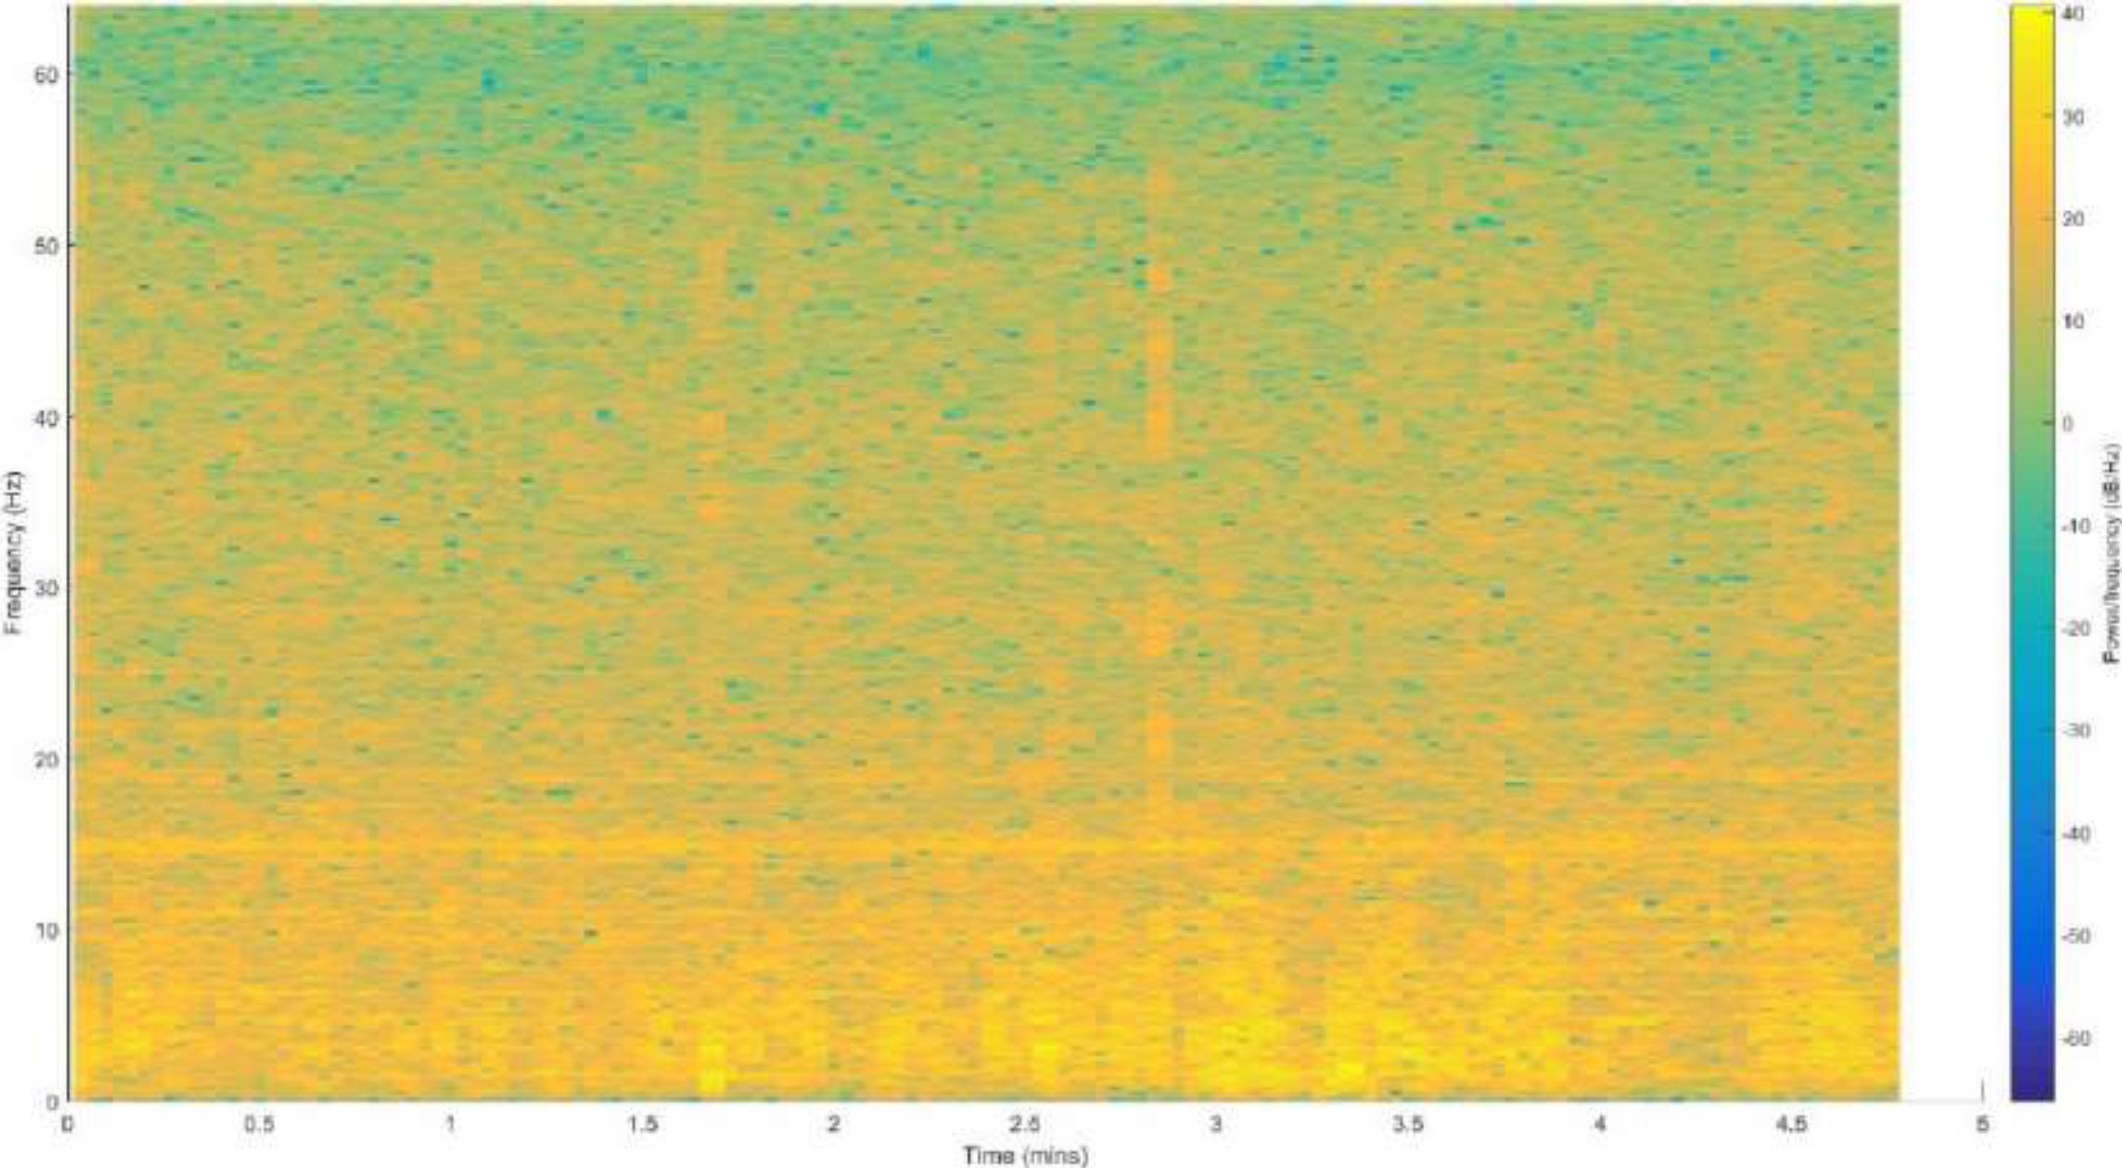
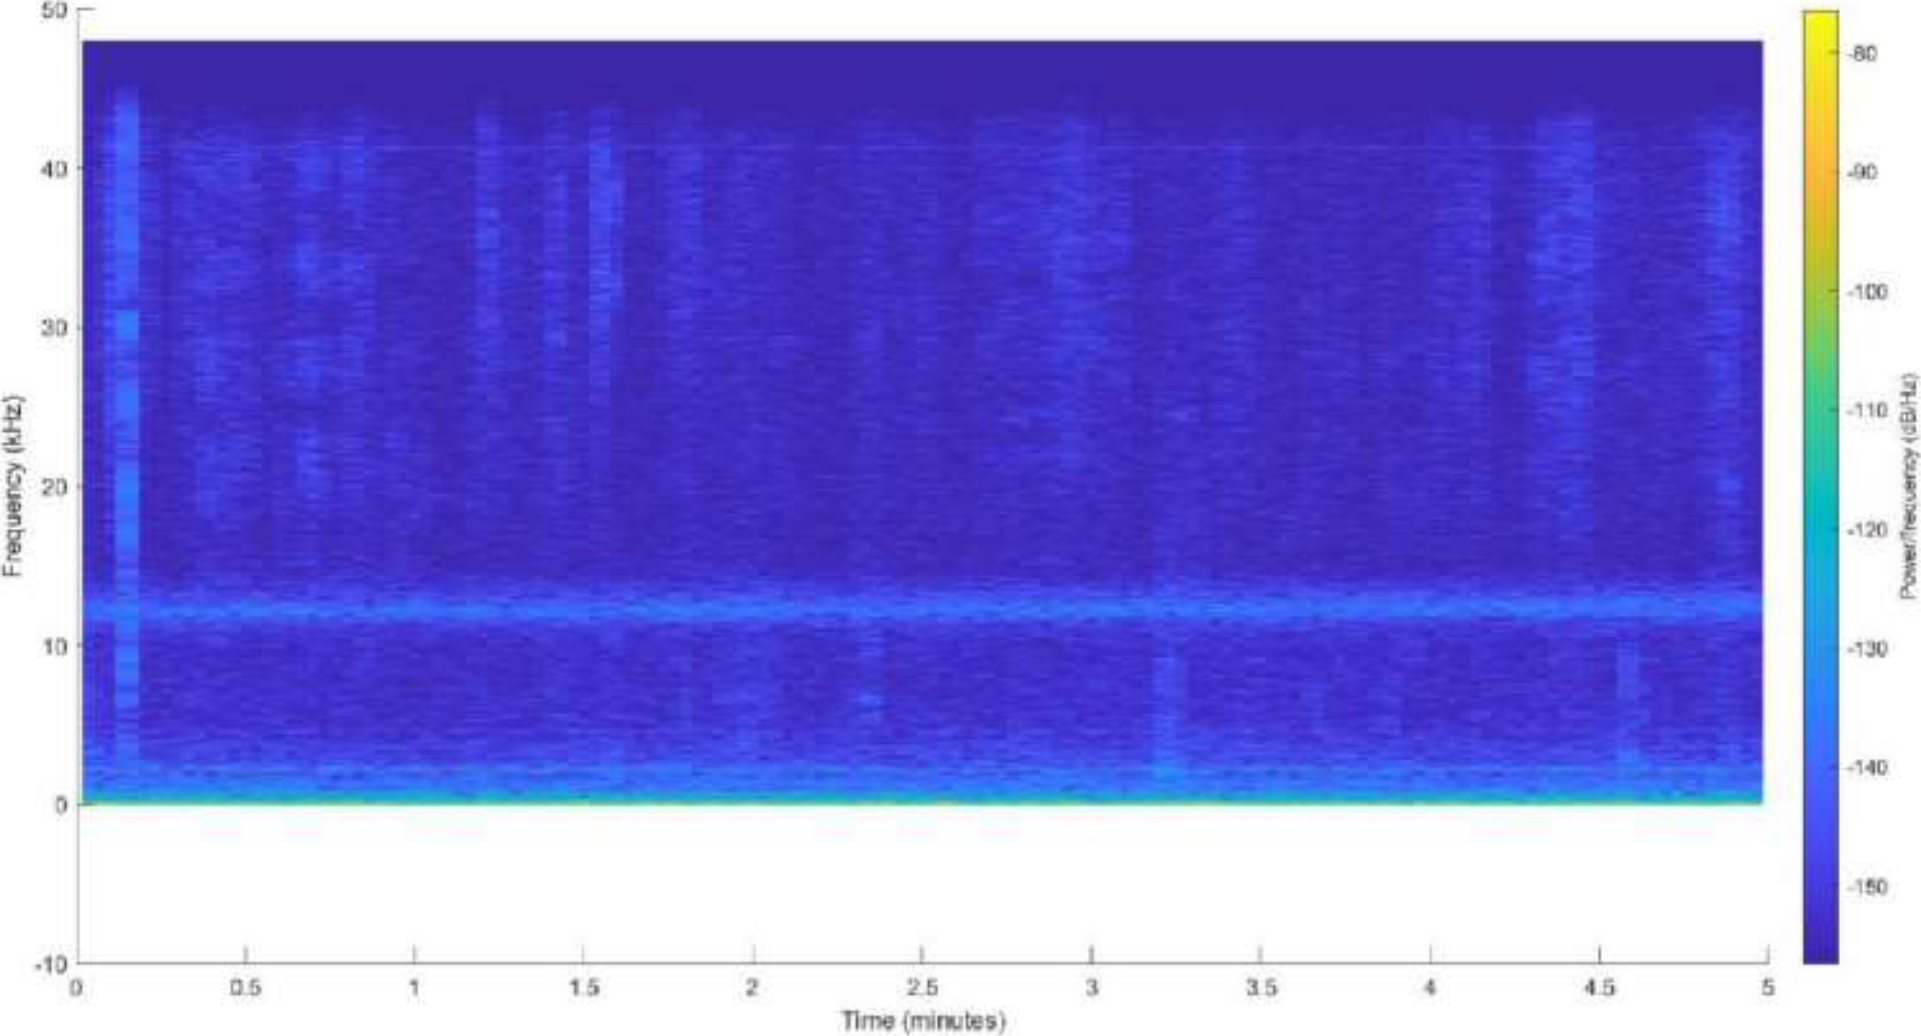
In this way, the spectrogram of Figure 17 is constructed, which is a heat map in which each column contains the estimate of the power density of the frequencies captured in the duration interval of the experiment.
These graphs are stored with the patient’s name as image files .jpg in the folder selected as the Patient Data.
Figure 18, shows the histogram constructed from the average of the power of the frequencies captured during the experimentation, in two-octave intervals.

Although 180 KHz, which represent the maximum frequency to which the 8103 hydrophone is sensitive, can be represented in a total of nineteen octaves, for this experimentation only the first twelve were considered, corresponding to a range from 0 to 4096 Hz.
This due to the fact that a greater incurrence of the highest powers detected is observed, in the interval of seven to eight octaves, and from nine to ten octaves.
For the data generated by the EEG to the control subject, the functions to graph and analyze, used for the hydrophone, are used.
With this, an analysis similar to that of the hydrophone is generated with the difference that it is not plotted in octaves, but rather in frequency bands of brain activity, such as delta
Once the data processing is finished, a new IDE is opened, Figure 19 a) where you choose between viewing the sensor results EEG, Figure 19 b) or del Hydrophone, Figure 19 c). If you want to return to the Analysis IDE, press the return button.

The high quality versions are in the same selected folder as the Patient Data. Furthermore, independently using the graphing functions described before, in order to check the processing of the raw data captured during the experiment.
For this, the signals captured by the dolphin by means of the hydrophone 8103 and the EEG signal correspond to a therapy given to a second patient with spastic cerebral palsy (ISCP).
The experimentation carried out in this case consisted of a therapy without variations with a duration of 5 minutes, which was analyzed using the hydrophone and EEG.
Thus obtaining the spectrogram corresponding to the hydrophone in Figure 20 and the one generated by the EEG shown in Figure 21.


It is worth mentioning that the bottlenose dolphin is capable of emitting clicks with frequencies between 20KHz and 150 KHz, which they use for their echolocation.
In addition to frequencies between 200 Hz and 150 KHz that comprise the hiss and clicks through which they communicate.
The latter is emphasized, because a horizontal line is observed at 13 KHz in the hydrophone spectrogram, which implies a constant power density throughout the experimentation, corresponding to 130 dB/Hz.
This is highlighted by the fact that a similar feature is observed in the spectrogram resulting from the EEG.
In this case, at approximately 13 Hz a constant power density of 40 dB/Hz is observed throughout the experimentation, forming in the same way, a horizontal line on the heat map.
These fall into the frequency band
This frequency band is related to a first state of attention in the human being, reached by being concentrated during carrying out some activity, but without reaching deep attention.
Thus, for this experimentation a communication behavior is observed by the dolphin during DAT, which coincides with a constant state of attention in the patient.
However, subsequent samples in the same experiment could not be obtained due to the inability to travel to the Delfiniti Ixtapa dolphinarium on March 2021. Thus, nothing of the observed particularity can be concluded yet until a greater number of experiments are carried out.
6 Conclusions and Future Work
In this work, first, the current state of work with objectives similar to the one proposed was evaluated, in order to determine contributions, through the investigation of scientific publications in databases such as IEEEXplore, ResearchGate and the institutional Repository several universities in Mexico.
In addition, the relevant terms within the scope of the project were defined, as well as the tools to be used to specify the methodology to be used. Using research methods and contact with Delfiniti Ixtapa, the DAT’s teaching venue, with whom he collaborated.
Subsequently, a representation of the power density of the signal emitted by the dolphin during a DAT was generated, to be compared with changes in the brain activity of the patient resuming work [13].
This, by means of the power spectral analysis resulting from the signal obtained by the hydrophone 8103 and the EEG, with this information each column of the spectrogram of the frequencies captured in the sample was constructed. In addition, the time series, periograms and histograms that represent the collected data.
With this, the results of the methodology used were evaluated, in order to determine the effectiveness of the proposed method.
This, through experimentation in a control patient to perform a function test, and later in an intervention patient where a methodology for the analysis of the therapy was suggested.
Thus, power of the bioacoustic signals emitted by a bottlenose dolphin during the assisted therapy process, imparted to a patient with spastic cerebral palsy (ISCP), was analyzed.
This in order to know the patterns that affect the patient, recording the electrical activity of the brain, as well as the behavior of this patient, through the ThinkGear ASIC Module v1.0 (TGAM1) sensor and 2 Web cameras with Standard Resolution or SD.
In addition, the bioacoustic signal emitted by the dolphin during the assisted therapy process was analyzed, making use of a USB-DAQ 8/2-ch production analysis card, a charge converter to Delta Tron with integrated TEDS, an adapter BNC (male) to 10-32 UNF (female) and a Brüel and Kjær Model 8103 miniature hydrophone with 10-32 UNF (male) cable. In the experimentation carried out, a higher power was observed in high frequencies captured in the brain of the patient during all the experiments.
In addition, the highest calculated power in brain activity is recorded during the normal process of assisted therapy, that is, with the patient, the therapist and the dolphin interacting inside the tank at the same time.
In addition to this, it is also the period where the highest estimate of the power of the bioacoustic signals emitted by the dolphin is recorded.
The present work proposes a data acquisition method based on the use of a miniature hydrophone, by means of which the bioacoustic signals emitted by a bottlenose dolphin during a therapy assisted by this are collected and analyzed. In this way, the applications of this instrument are aimed at determining the behavior of the dolphin, specifically when it uses its sonar.
The research described in this work was carried out at Delfiniti Mexico, Ixtapa in collaboration with the Superior School of Mechanical and Electrical Engeniering (Escuela Superior de Ingeniería Mecánica y Eléctrica) of the Instituto Politécnico Nacional, Campus Zacatenco.
It should be noted that the results of this work were carried out by the students Erika Yolanda Aguilar del Villar, Mario Alberto Sánchez Flores, and Abril Pérez Sánchez.

