


 text new page (beta)
 English (pdf)
 Article in xml format
 Article references
 Send this article by e-mail
 Cited by SciELO
  Similars in
SciELO
Similars in
SciELO 
 Permalink
1 Introduction
This work describes the study of the behavior of growing variables from 8 habanero chili genotype(Capsicum chinense Jacq.) through machine learning. The objective is to find the existence of a relationship between the phenomenological development variables and yield. It is interesting to know if the yield is directly related to the plant height or if the leaf growth is related to the regional weather.
Gathering this information, different genotypes had been cultivated under the same weather, and measuring and data collection too. The information that this research presents, not only implies raw data of variables but also presents a descriptive and prescriptive data analysis, applying data science techniques as statistics and neural networks.
Agricultural production has had 3 stages; the first one has been when the labor was rich and intense until 1920, later, the second stage when the industrial revolution provide heavy machine to the fieldwork and the seed study to improve farming, finally, the third one began since 2010 until today, which it is known as the Agriculture 3.0, this stage is considered by the use of innovative technology for different studies that allow a genetic and phenologic improvement of farms assisting to take decisions based on data analysis and data obtained from external sources.
The good decisions based on agricultural information give higher productivity, practicing sustainability even helping to provide transparency to consumers who may want to know more about their foods [8]. Kumar [17] in 2017, mentions that one of the aspects which impacts the livelihoods and rural prosperity is agricultural management. The options of agricultural growth and connections with farm investment are the key element to agricultural development strategy.
In 2019, Mexico was in third place in the agricultural sector in America Latina and 11th place at the global level. Agriculture is the mainstay sector in the country’s economy which wields a socio-economic impulse; with the culture of continuous improvement and the incorporation of technologies on the field, Mexico in the last year became within the 10 first agri-food products exporter [20]. The importance of habanero chili production has been used by different fields; in the pharmaceutic industry, according to Lopez-Puc [19] who studies the implementation of biotechnology in gathering varieties of habanero chili by its high capsaicinoides and capsaicina content, which are the raw material to the ointment production that relieves arthritis pain. In the agro-alimentary industry, for its proceeding in several foods that contain, habanero chili has elevated vitamin and minerals index [29].
It is used as an electrical system and irrigation coating to avoid rodents attacks. Lopez [19] also indicates in a significate way that, habanero chili is one of the least harmful chilies and is considered powerful healing, besides, it helps with gastritis and hemorrhoid problems. The 80% from chili habanero production is marked as dried fruit and 20% as sauce production like pasta and dehydrated [7]. Habanero chili it has been cultivated in the Yucatan’s peninsular and is the leading production all over Latinoamerica in 2018 [30, 35]. Like farming, it has strong economic importance to vegetable producers in Yucatan state: remains in second place after the tomato farming concerning ground farming and, due to their demands to weather, the use of the controlled environment is higher [18].
There have been already published research documents terms as agronomics, climatic, genetic, chemical, among others as Santana et al. [31]. who investigated the formation of shoots of habanero chili plants with supplements in the shoots applying variables concentration of kinetina, benciladenina, and tidiazuron. On the other hand, as times go by and the social requirements for having data control, its management and generation of information in areas like medicine, astronomy, chemistry, biology, among others, has been supporting technological and specialization challenges cause of the data volume demands, the idea of gathering not only useful and in time information, but the knowledge acquired [24, 32].
However, with technological advance and social requirements, the statistic has been involved by its essence which is identified as science and classified depending on the purpose of data in statistic descriptive, demographic, probabilistic, or administrative in order to identify a phenomenon, concept, or incident [13, 3, 34]. In 1999, Witten et al. has taken the first steps to design learning methods through data exploration techniques, applying systems through data analysis with the WEKA tool, using the RJ48 algorithm, they isolate qualified attributes for a market and price of mushrooms labeling. Witten et al. claim to support a minimum work of programming to achieve the learning.
Majumdar [20] in 2017 analyzed the data sets from different public databases through data mining techniques applied in the agronomic area, particularly, clustering techniques. The work was done with wheat farming. The groups were divided by districts assessing different variables like atmospheric humidity, pH, temperature, among others. The efficiency of the annual crop was obtained by linear regression. As well, Amato et al. [2] in 2013 make sure about the nonparametric techniques usually exceed the parametric. Amarato realized research with discriminating data analysis tools that adapt to images hiperespectrality to identify the use of farmed agriculture soil. The good results he acquired for the classification using the previous transformation of data and he remarked that the false positives could be prevented, also using a group of data little training and reaching robustness and capacity to identify the categories in its study. Conversely, Kanahal [16] in 2019 studied the needs of farmers basing on a questionnaire applied to experts in consideration of different variables as revenue, farm size, and an agricultural occupation for modeling, and the adoption of a predictive direction system. In his work, he mentions that the farm size, revenue level, and agriculture occupation are important facts in the adoption modeling and the applying of the GPS system.
Issad [1] in 2019 submits a revision of the implementation and study of Data Mining Techniques in agriculture. In this work, he mentions the Padalulu’s et al. study, his proposal is the estimate of fertilizer and irrigation, as well as Perea et al. [12], in 2019 they had worked on decision trees and genetic algorithms to predict irrigation events. The wheat production was reinforced by satellite climatic studies in Australia, creating empiric models to predict the efficiency, however, Cai et al. [5] in 2019 observed the benefit of not only gathering the climatic data via satellite but they compared climatic data already acquired. They had used the regression method known as LASSO and three learning methods to build prediction empiric models. They claim that the method based on automatic learning overcome the regression method. And due to the successful work achieved, their suggestion is to apply the same techniques to other crops.
Rajeswari [27] in 2017, create a model for data analysis bigdata through the cloud, he analyzed variables as fertilization, growth, market, as well as requirements for growth. Initially, his proposal was the extraction of information through the digital interconnection of routine objects with the internet (IoT Devices), storing it in one of the databases in the cloud, subsequently, pre-processing and labeling were made, getting a selection of attributes completing the application of a pattern algorithm of MapReduce prediction.
It is well known that problems in the real world are even complex, nonlinear, and a stage that could be charged with multivariable uncertainties, multimodal, discontinuous, or exponential. This is an immersion to get to the point; studying a data collection or getting a processing and analysis algorithm, does not ensure the information gathered [35, 6]. Although it is been a long time since the statistic was considered by the specialists as an individual science in the research study, like Stigler [32] in 1986 mentioned in his book the requirement of intervention in some disciplines in the employment of the data analysis management, consequently, this premise has been fundamental support to get to the source called the Data Science [4, 10]. Data Science is an interdisciplinary field for the research generation that is useful, relevant, and innovative, converted into knowledge, the multidisciplinary thought from fields as programming, communication, management, sociology, and mastery of topical, are intended to a reflection of Data Science [35, 6, 34, 33].
The researches already realized in the agro-nomic area apply theories after the data collection, either, using data in a computing system to produce information with a specific target, also there are works where technologies and smart algorithms have been applied for data analysis like [22, 36, 15]. However, studies are ensuring that the model system is important on data knowledge, this is, the recognition of involved disciplines in a solution to make a collaborative work and systematic that performs a succeed on the project [26].
The expansion of the system consists of several phases: Delay phase (phase ”lag) is a short period of adaptation or an increasing of startup to the half; transition phase, accelerated growth, which leads to exponential growth (logarithm phase); negative acceleration phase, imbalance phase, which leads to a stationary phase: characterized by the net coefficient of increasing declares null. Based on studies realized by Hernandez et al. [14], in grafted cucumber plant had been observed that fruit weight by plant correlated positively and significantly with plant height r=0.63*, stem diameter r=0.59* and leaf number r=0.54*, revealing these characters are important for this production system.
While Estrada et al. [9], evaluating tomato genotypes, found that the leaf length correlated with the fruit diameter, the highest correlation match to the length and wide of leaf r = 0.96, also highlight, by the number of leaves by plant, the number of clusters by plant, number of fruits by cluster, the average weight of fruits, and the fruit diameter, which means that are correlated. Other studies, like Pinedo [25] realized, studying the genetic improvement of Camu-camu, had found a correlation between the leaf length, petiole length, and the fruit weight, that is a specie with high vitamin C content; as equal as Nieto et al. [23] evaluating the chirimoya selections, they had found that the limbo area, the leaf perimeter, the petiole length, and the longitudinal axis, were variables that had higher correlations with a highly significative level (P ≤ 0.01), proving its dependence; in this studies that have been realized in different species, its been determined a high correlation besides submitting a logistic type of growing that match absolutely in the gathered results on the current investigation.
This work suggests a study of determinate variables of a data collection from habanero pepper plants settled at the beginning of Data Science. It is analyzed the data representation complex, the vision of behavior over and as time goes by, preserves the mastery of knowledge of the data topic and its generalities on the experimental study.
As a result of our work, we have found that is possible to identify the relation between determinant variables. Even better, the Neural Network algorithm proved to be a great support widget in the research of experimental variables, emphasizing the relevance of the variable which has the reply to particular incidents, in other words, a prescriptive analysis of data has been developed with great success. The relevance of this study lies that no work has studied the variable knowledge relation of habanero pepper through computational algorithm techniques.
2 Related Work
The applied methodology was through the Data Science philosophy, where its discipline simulates a coordinate and systematic mechanism. In this section, the first steps were described, as well as the experimental design of the plants and their treatment, which is critical for the experimental replication as well as the procurement process and the data management of the experiment at the 3 harvest events conclusion. In addition, the Artificial Neural Network used for knowledge analysis has been presented.
2.1 Experimental Crop Design
The experimental design was completely random with 8 treatments and 23 replications, getting 134 experimental units. The assessed variables in the habanero pepper plants were: plant height, leaf width, leaf length, bloom time al first and second shoot, and the second shoot, bloom time, number of fruits, and the greenhouse weather.
The selection of the seed was the beginning, until obtaining data from three harvests. In Table 1 the genotypes under study for their adaptation are presented. The conditions used in the greenhouse and the treatment of the plants used for the study variables are shown.
Table 1 Genotypes of C. chinense in greenhouse experiments
| Gen | Site | Name |
| G2 | PGHBN2-130217-C1 | Gliese 204 Chato1 |
| G3 | PGHBN3-130217-C1 | Gliese 204 Chato1 |
| G4 | PGHBN4-130217-C1 | Betelgeuse 2 |
| G5 | PGHBN5-130217-C1 | Betelgeuse 2 |
| G6 | PGHBN6-130217-C1 | Rigel 1 |
| G7 | PGHBN7-130217-C1 | Gliese 204 Chato1 |
| G8 | PGHBN8-130217-C1 | Rigel 1 |
| G9 | PGHBN9-130217-C1 | Gliese 204 Chato1 |
The measurement of the variables was per-formed in centimeters below describe each of them:
— Plant height (API). Seized from the bottom of the stem to the highest apex of the plant in centimeters.
— Number of primary stems (NTP). The number of secondary limbs of the leaf from the core stem was quantified.
— Number of secondary stems (NTS). The number of tertiary stems was quantified based on their secondary stem.
— Leaf length (LHj). The leaf development was quantified in the core rib at different sampling dates, using as fundamental the start of leaf limb.
— Leaf width (Anh). The leaf plant evolution was evaluated from its middle segment in terms of different sampling dates meanwhile its growth.
— Fruit length (LF) The fruit length will be measured.
— Fruit width (AF). By Measuring the widest fruit section, the width will be determined.
— Environmental temperature, in the green-house.
— Closed bloom (FC). To evaluate this variable the flower bud has to emerge on the three emergency days, closed bloom (days).
— Semi-open bloom (FSA). It had been qualified when the bloom is 30% open, but without pollination, the views as semi-closed bloom were selected.
— Open bloom (FA). It will be observed if the bloom is completely open and the anthers are dehiscences (days).
— Pollination (Pol). The bloom condition will be monitored if it bears fruit, the result will be recognized as pollination.
— Fruit Color (CF). The color might be consid-ered based on the pigmentation acquired over the maturation process.
— green-dark fruit (CVOF). The fruit will reach this color as of the 20 days of pollination.
— Light-green color (CVCIF). After 3 or 4 weeks later of pollination change this color (visual).
— Light-green with red or orange pigmentation according to its genotype (CPRN). In a period of 4.5 to 5.5 weeks of pollination, this is the pigmentation produced in the fruit (Visual).
2.2 Design and Analysis of Data
With globalization advances and global warming, the agronomic field is concerned by different purposes of the farming process such as: cost reduction, resource optimization, and/or the genetic improvement of the product. The habanero pepper experts who have been contributing to this project, not only are interested in weather adaptation in protected crop to improve efficiency and production, but also the phenomenological condition from variables of the habanero pep-per plant.
In the first analysis phase, the registered data were achieved and reviewed in numerical value with a spreadsheet. The data were evaluated and discerned through a set of continuous and discrete data values for a first descriptive diagnostic that were determined by the information gathered.
For the data analysis, a statistical function was investigated to reach the descriptive analysis as Pearson’s correlation test between the variable of height-leaf, height-stem, and finally, fruit and plant of the three crop periods.
2.2.1 Data Modeling
A set of data values was used carefully evaluated with the intention of noise-canceling which might harm the analysis process, irrelevant variables were isolated, in other words, those that don not have a coincidence relation between them. Once the database has been already reviewed, an entraining function was applied to a set of data preparing it and using it in a Neural Network Algorithm. The tests were made once the model has been trained over the set of data to reach the accurate model.
The tests that were made in this stage had the intention to create a machine learning model to explain if the plant height might have an impact on the production, or any determinant variable. Through the multiple linear regression function with function 1, a diagnostic and descriptive model has been presented describing the issue and what can be achieved through an set of exposed data:
where
Statistics models help us to qualified the validation and reliability of the gathered data. The study of correlation has been used to know the relation level during the variables growing in the study, another one, is the regression to identify the dependent and independent variable of the leaf and fruit growing, to evaluate and validate the relationship between both.
Among the logarithmic and exponential functional models, a variant of the regression of each genotype was analyzed by genotype and to know the data prove. Then, an analysis of lineal regression had been performed providing the dependency between the expressed data, in other words, the dependent and independent variables.
Once the behavior of the dependent variables has been recognized, machine learning through supervised learning has been suggested. The data already shown have been analyzed as the dependence of the variable to the response variable. In order to know the effect of temperature on plant growth or a variable that directly affects, or even, to identify the growth-production based on the genotype, the paradigm of the Artificial Neural Network was presented which supports the optimization and prediction of the reply variable.
2.2.2 Machine Learning: Artificial Neural Network
Since 1888, Ramón and Cajal [28] prove that the nervous system is formed by interconnected neurons that learn the influence of external information. There are different ways to learn as they are: through new connections, through connection breaks, links between neurons, or the neurons reproduction. Artificial paradigm of Neuronal Networks simulate the biological Neuronal Network, the standard model arises in 1986 by Rumelhart and McClelland as defined in function 3, we become aware of Artificial Neural Network in [21]:
where
The Adaline Artificial Neural Network (AANN) was used in Adalina, introduced by Winrow and Hoff in 1960, and the name comes from ADAptative LInear Neuron, operational input of continuous values intended to classify data. Different from other neuronal networks, one additional parameter has been incorporated called bias giving a free degree to the model (see function 3):
The notable thing about this model is the learning rule, identified as LMS (Least Mean Square), learning is regulated by the weights selected to the error made by the neuron. With the cost function, network optimization has been acquired (see function 5). And the Artificial Neural Network training steps are in the algorithm 1.

3 Results and Discussions
The study presents a close relationship between the fruit and leaf variables, as we can see in Figure 3, where the value of the determining variables has a logistic behavior. During the first data gathering, the fruit and leaves variables show fast germination and tend to converge towards slower germination.Coefficient of determination is


Fig. 3 Behavior of the growth rate of the variables leaf width and fruit width of the Rigel genotype and their relationship as a function of temperature
Difference between leaf
The germination average of the habanero pepper leaf of genotype Rigel is
Table 2 Determination coefficients
| Groups | Rep | SC | ||
| Large(LH) | ||||
| Width(AnH) | ||||
| Fruit |
A factor that influenced the growth rate and the production of the habanero pepper crop was the temperature. The range of temperature values in the greenhouse is between 48.75ºF and 91.85 °F.
In Figure 4 the increase of the leaf growth and the fruit in temperature function have been observed. On the axis of the independent variables, the values of the average temperature have been considered and it is relational with the growing rate of the leaf length at that moment, and the fruit length is presented at the same time.

Fig. 4 Behavior of the growth rate for the variables width of the plant leaf and the width of the fruit of the Rigel genotype and their relationship as a function of temperature
The increase in each variable is distinguished, even though the fruit length is slower.
In the linear regression analysis between the variables length leaf width (AnH) and fruit width (AF) a highly significant correlation was obtained, where the sum of squares was 9.88 and the critical value of F was
Table 3 Coefficients of determination and standard deviation to variables fruit width and plant leaf from chilli Gliese genotype and Riegel
| Study factor | Betelgeuse | Riegel | Gliese |
| Coef. of det. |
|||
| Adjusted R-squared | |||
| Error |
The results of the multiple linear regression technique showed a significant association in those predictive variables such as height, temperature and type of pepper genotype, Figure 6.


On the other hand, the estimated line obtained from the regression diagnosis can be observed in the equation 6, the
Furthermore, these results showed a growth trend with respect to yield for each treated genotype (see Figure 7). The normality of the studied data set can be observed in Figure 5, this represents a long-tail behavior in the residuals, which means that the proposed model must be studied.
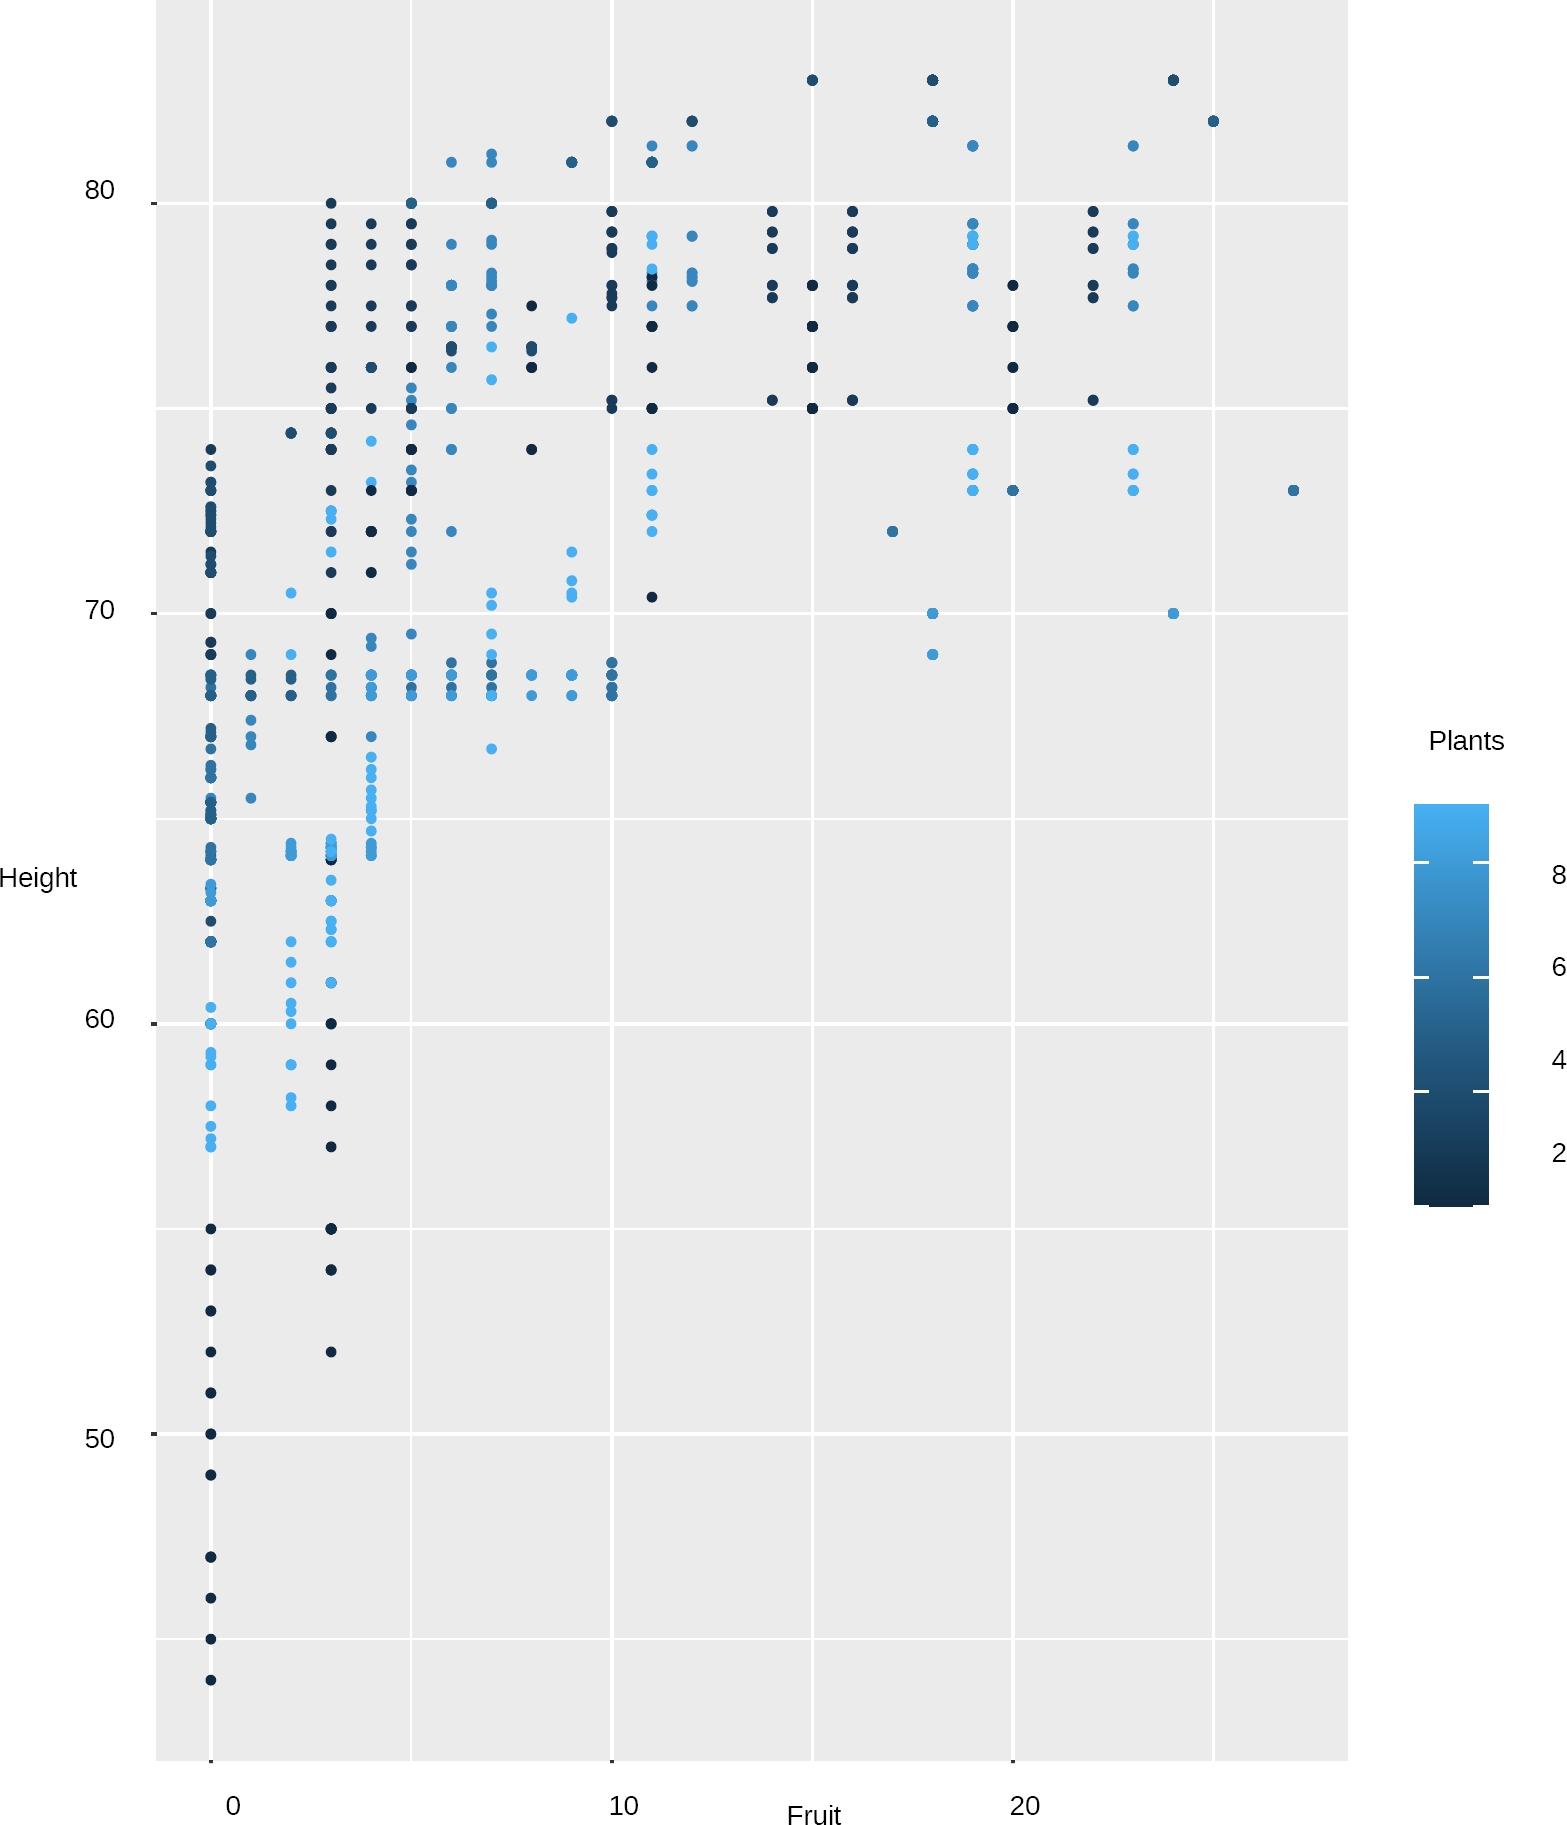
Although a statistical model was found and this represents a proposed solution, the problem is complex as can be seen in Figure 7, where it only shows the correlation of two variables.
It is necessary and advisable to continue with the study to find the information of answers to questions as; If there is a relationship between the determining variables type of plant and yield, or also pre-write which variable could identify the type of plant in question, before having the fruit, that is, without having to invest in time.
One of the first Artificial Neural Network experiments was to identify if the value of the length of the leaf can help predict the height of the plant. Among the parameters that he included in the algorithm were the variable
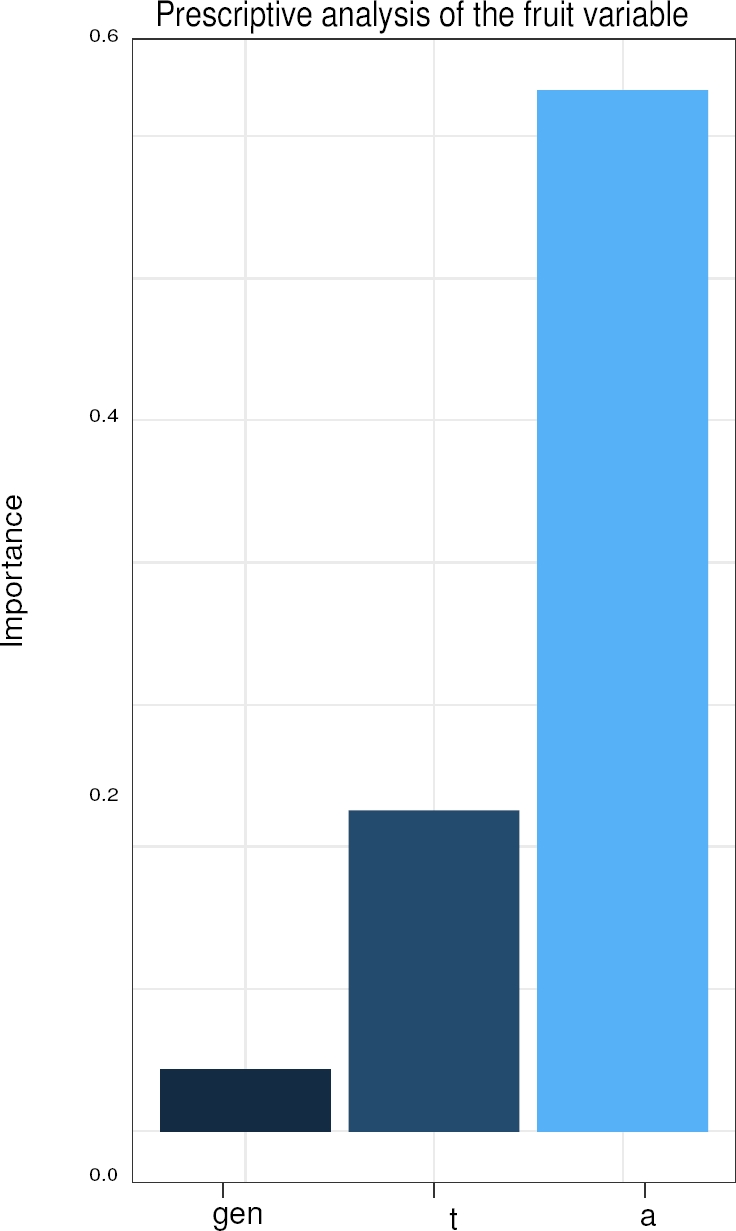
Another interesting piece of data is that the Garson [11] method of the Artificial Neural Network paradigm was used in the search for response variables among all the variables that were included in the study. The method made a significant connection between all nodes, giving a weighting value to each connection and, later, the technique considered a disconnection between the evaluation of weights on variables that do not have a significant relationship that is evaluated by the paradigm, since the connections were scaled and disarticulated, those variables that were not relevant to find the response variable were eliminated.
Figure 8 shows the variables of the data set that obtained a significant level of importance (x’s axis) in relation to the plant genotype (y’s axis), this predictive analysis will allow the expert to decipher the type of habanero chili without waiting for the plant to expose the fruit. In the same way, the study was considered very significant because the power of a neural network was verified in a prescriptive-level data analysis. Another example that showed its importance was the identification of an explanatory variable for performance, the result of the Artificial Neural Network can be seen in Figure 9.

4 Conclusion and Future Work
The study of experimental data in the habanero pepper crop was performed by a multi-disciplinary team, where team members whose area of expertise is computer science, interacted with experts in agricultural science. In this research, the experimental data obtained was analyzed by statistical and data mining techniques with the main purpose of finding interesting information beyond the prediction that a multiple regression analysis could produce.
In fact, the linear regression model appears to be insufficient for finding an explanatory variable that fully determines the response variable. We found that the Artificial Neural Network approach was quite valuable for carrying out our analysis. This work is a process that we find attractive for the analysis of multivariable linear and not linear data, which are required for obtaining a diagnostic that is both, predictive and prescriptive.
The studies carried out show that determining variables such as plant height, leaf length, leaf width and fruit have a positive and significant correlation, as did Hernández et al. [14] with they study of the cucumber plant.
On the other hand, Estrada [9] in his study of tomato genotype found a correspondence relationship between the values of the fruit and the plant with respect to the data of the clusters, we found a strong relationship between the fruit and the values of the plant’s leaf
The study of the data of a habanero pepper crop was carried out in a multidisciplinary study, the data obtained was analyzed by statistical and data mining techniques in order to find interesting information beyond a multiple regression study.
The regression model does not seem sufficient to find an explanatory variable that determines the response variable, being the ANN technique very helpful for this objective.

