


 text new page (beta)
 English (pdf)
 Article in xml format
 Article references
 Send this article by e-mail
 Cited by SciELO
  Similars in
SciELO
Similars in
SciELO 
 Permalink
1 Introduction
At the global level, agricultural activity faces the challenge of ensuring the supply of food for the population. In this sense, the actions taken to improve agricultural production need to be defined in function of the population growth rate, economy, agricultural infrastructure and natural resources of each country.
In the case of México, the cultivable area in 2015 was 27.8 million hectares, and it is estimated that the surface decreases mainly due to the degradation of the water table, pollution and the change in the use of the land to build houses [1, 2]. Therefore, the optimization of the yield of production units has been an option for the sustainability of agricultural production, rather than enabling new farmland.
In this change of strategy, producers are focused on improving the yield per unit of production, rather than finding new cultivable farms. The producers are adopting cutting-edge technologies in order to better manage the control of the elements involved in the production process (climate, pests, diseases, nutrients, and water supply). This adoption refers to technological migration and new trends such as applications that integrate internet of things technologies, cloud computing, fog computing, embedded systems, wireless sensors, artificial intelligence, and monitoring and prediction systems [3].
Several of these research works [4-6], use Internet of Things technologies with very promising results. However, despite these results, the implementation of the so-called "smart agriculture", is difficult to implement due to the use of expensive equipment that is difficult to obtain in the regional environments and also for the technical difficulties to connect objects to the internet.
In this research paper, the design of a low-cost architecture based on the Internet of Things for greenhouse monitoring is presented. The proposed architecture is based on low-cost technologies, such as WiFi and GSM/GRPS. Our proposal can be considered as an implementation alternative for small producers that wanted to implement smart monitoring of the crops. The proposed architecture was evaluated using a real mesh covered greenhouse and the results indicate the feasibility of the proposed solution.
2 Theoretical Basis and State of the Art
This section presents some of the relevant concepts used in this research: Internet of Things and smart farming. The state of the art in IoT architectures for smart agriculture is also presented in this section.
The objective of the Internet of Things approach is that any object can have its own behavior through the Internet and its own identity [7]. In this context, the IoT consists of the integration of sensors and devices in everyday objects that are connected to the internet through fixed and wireless networks. In the IoT approach, any object is capable of being connected and manifesting itself on the network. Furthermore, the IoT implies that any object can be a source of information [7].
Smart agriculture is the application of new information and communication technologies focused on a data-driven approach to address existing challenges and opportunities in agriculture [8].
Therefore, smart agriculture is the combination of Internet of Things approach, cloud computing and agriculture techniques [9].
Smart Agriculture helps to improve performance, facilitate knowledge about the customer, establish a more accurate scenario of the competitors' market and therefore to improve profitability. This technological innovation enables farmers to optimize agricultural production, reduce unnecessary applications of fertilizers and pesticides, preserve natural resources and cope with impending weather events. Precision agriculture considers variability on the ground, but smart agriculture goes further, as it bases the decision not only in place where data are produced, but also analyzes the data based on the greenhouse context captured in real time [10].
In research work [11], a smart monitoring platform is presented that consider a solid structure for agricultural sector based on IoT techniques.
In the research work [12], the authors expose the support of IoT technologies to agricultural activity in India. The paper proposes a four-layer architecture: perception layer, network layer, service layer and application layer, where multiple sensors collect weather data, soil, plant, pests and diseases, as well as natural resources such as water, in real time. The data processed by predictive models provide valuable information to the farmers so that they can make smarter decisions with crops.
Research works of Khattab, Abdelgawad, Yelmarthi, 2016 [13] present a customized IoT architecture for precision agriculture, which has three layers to collect the necessary data and to transmit it to a cloud-based back-end where the information is processed and analyzed.
In the research work of Halder & Sivakumar, 2017 [14] proposed the integrated of Internet connectivity using GSM and Ethernet modules. The proposed device monitors humidity, temperature, rain, solar radiation and UV radiation.
In research work [15], a low-cost meteorological station is presented, which permits to measure the following climatic parameters: wind velocity, wind direction and temperature. In the case of work [16] the author presents a rain monitoring system developed using a wireless sensor network. The system permits to send sensor measures through GPRS protocol.
Research work [17] presents the implementation of a meteorological system based on serial communication. In [18] a system is proposed, witch permit to estimate the amount of water needed for a specific harvest. To do that, the system takes measures of a humidity sensor, soil temperature and the duration of daylight hours.
In research work [19], the authors propose the development of sensors able to measure agricultural parameters such as soil humidity, air temperature, relative humidity and light intensity. These collected data are sent to the cloud for further processing and analysis.
Research work [20] presents a meteorological station based on IoT concepts that enables the agricultural producers to automate the production processes.
Math & Dharwadkar [20] use the Zigbee protocol for communications, managing to measure meteorological data, including barometric pressure, dew point temperature, air temperature, wind speed and direction, and relative humidity.
The development of IoT projects has given rise to different architectural proposals such as n-layers architectures, cloud architecture, fog architectures and edge computing architectures among many others. This paper proposes the development of a low-cost architecture with four layers for environments based on precision agriculture. This IoT proposal has been made using free hardware and software, web services, database and cloud platform, which can be used by small producers.
3 Proposed IoT Architecture
This section presents our proposed architecture for automatic greenhouse monitoring. This architecture is composed of four layers: perception layer, network layer, storage layer, and the application and business layer (Figure 1).

The architecture considers an initial perception layer which obtains the context data to be sent to the network layer.
This last layer performs the connection negotiations between the ESP8266 module and the local network, in order to send the collected data via WiFi. Another option for sending data is to use GSM / GPRS technology. Once the internet connection is established, then the environmental data are sent to the storage layer. To do this, the http communication protocol and the GET method were used to send the data.
Finally, the application and business layer are used to develop software applications where the end user can monitor the general conditions of the crop. Following, each one of the layers is presented in detail.
3.1 Perception Layer
The sensing layer allows collecting context data inside and outside the greenhouse. The first step of this layer is the programming of the Arduino Mega 2560 microcontroller.
In this proposal the ESP8266 module has been used, which is a chip designed by a Chinese company called Espressif Systems.
This chip is an excellent automaton solution for wifi networks that is offered as a bridge between the microcontrollers that exist so far or has the ability to run standalone applications [21]. The sensors integrated to the Arduino board were: air temperature sensors (DS18B20), relative humidity sensors (DHT11), soil moisture sensors (HL-69), infrared plant temperature sensors (MLX90614), and light intensity sensors, (Figure 2).

The second step is the calibration of the sensors. We used a digital Thermohygrometer Htc-2 [22] which has a factory calibration certificate. The sensor calibration process was asfollows: all the air temperature and relative humidity sensors were placed on one side of the digital Thermohygrometer.
The third step consist of the activation of the microcontroller to start the monitoring process each 10 seconds for the sensors to be calibrated. The readings had and observation time of 5 minutes for 5 hours per day in a period of 5 days. Two options were considered for readings out of range:
a) To replace the sensor looking for better readings, and
b) To make and adjustment to the readings by means of numerical constant.
This second option was considered as a better option.
The fourth step is the physical installation of the sensors and their integration with the Arduino mega board. For the physical installation inside the greenhouse, 8-wire category 6 shielded cable was used for the installation of the power and data transmission lines, since this type of cable mitigates the effects of crosstalk. The sensors were strategically distributed inside and outside the greenhouse (see Figure 5) The fifth step is data collection. The data collected are: air temperature, plant temperature, relative humidity, wind speed, solar radiation, soil moisture and luminosity. The data are collected at 1-minute intervals. In addition, a preprocessing of these data is carried out, which consists of applying the Kalman filter to smooth the signal. This is because the sensors used are low cost, and generate noise or unstable signals. The result of this step is two sets of data: the original data obtained and the preprocessed data.


Finally, the sixth step is to send the data to the web server. This step consists of organizing the data sets to be sent to the server using the http communication protocol through the GET method. The collection of the data through crop and soil monitoring and weather monitoring is shown in more detail below.
3.1.1 Soil and Plant Monitoring
Soil and plant monitoring allows collecting soil moisture and plant temperature information. This is done by means of the soil moisture sensor type HL-69. This type of sensor proves to be useful for detecting moisture in the soil by means of water conductivity across its terminals. In addition, this could help to make better decisions in irrigation scheduling. For example, the amount of water to apply to the plant and the right time to apply irrigation. We also use the MLX90614 Infrared Sensor to measure plant temperature without contact. Soil moisture and air temperature sensors, along with light, carbon dioxide, air humidity, water and nutrient levels provide insight into the influence of temperature on plant growth and crop productivity.
3.1.2 Climate Monitoring Inside the Greenhouse
Climate monitoring inside the greenhouse allows the collection of information on air temperature, relative humidity, solar radiation, wind speed (considered zero when the greenhouse cover is made of plastic) to be processed and analyzed looking for the optimal conditions inside the greenhouse. This is key factor to improve the production.
Air Temperature
To measure the air temperature, the DS18B20 sensor is used, which is waterproof, encapsulated in a metal probe, at the end of a 1.0 m cable, is a One-Wire interface device with programmable resolution from 9 bit to 12 bit, capable of measuring from -55C to 125 °C (+/-0.5 °C).
The sensor can operate in parasitic mode, drawing its power from the data line, eliminating the need to provide an external power supply (it can be used with only 2 pins). Each sensor has a unique 64-Bit serial number engraved on it, which allows multiple sensors to operate on the same bus [23].
Relative Humidity
Relative humidity inside the greenhouse is measured with the DHT11 sensor, the temperature measurement range is 0.0-50 °C, the accuracy in the temperature sensor is ±2.0 °C, with resolution of 0.1 °C. The relative humidity measurement range is 20.0-90.0%, with accuracy of 4.0% and resolution of 1.0%, [24].
Solar Radiation
Solar radiation can be considered the most important environmental factor in greenhouse crops, as it influences processes related to photosynthesis, water and energy balances, and crop growth and development.
The sensor (Davis Vantage pro 6450) is used to measure solar radiation. The sensor's transducer, which converts incident radiation into electrical current, is a silicon photodiode with a broad spectral response. The outer housing protects the sensor body from thermal radiation and provides an air path for convective cooling, minimizing sensor heating [25].
Wind Speed
The vapor removal process is highly dependent on wind and air turbulence, which transfer large amounts of air to the evaporating surface. A model YGC-FS sensor is used to measure the wind speed, with a measuring range of 0.0-45.0 m/s, an accuracy of ±(0.4+0.03V) m/s, and a resolution of 0.1 m/s. The onset velocity is ≤0.5 m/s, [26].
3.2 Network Layer
The network layer establishes the connection negotiations between the ESP8266 module and the local network, in order to send the data collected via WiFi to a web server. This layer is responsible for sending.
The ESP8266 module is used as a bridge between the arduino mega microcontroller and the web server. However, it has the capability to run standalone applications. The ESP8266 module can work as a server or as a client, in this case it was configured to work as a client to connect to a web server and be able to send data.
The client and server communication were carried out using the http communication protocol.
For communication with the server, there are two easy ways to send data along with an HTTP request, these are the GET and POST method. The main difference between these two methods is that in the GET method the data is sent in the URL (Example: http://target_page/data.php?a=125&b=26). Being visible to the user as seen in the example, the variables a and b are visible. While in the POST method the data is hidden. Both methods are widely used and are almost always implemented in web pages [27].
The GET method is used in out architecture to sort the data to be sent in following manner: string="GET/webService/Data.php?v1=29.5&v2=34.2&…vn=45.9 HTTP/1.1\r\n Host: servidor.mx \r\n connection: close\r\n\r\n".
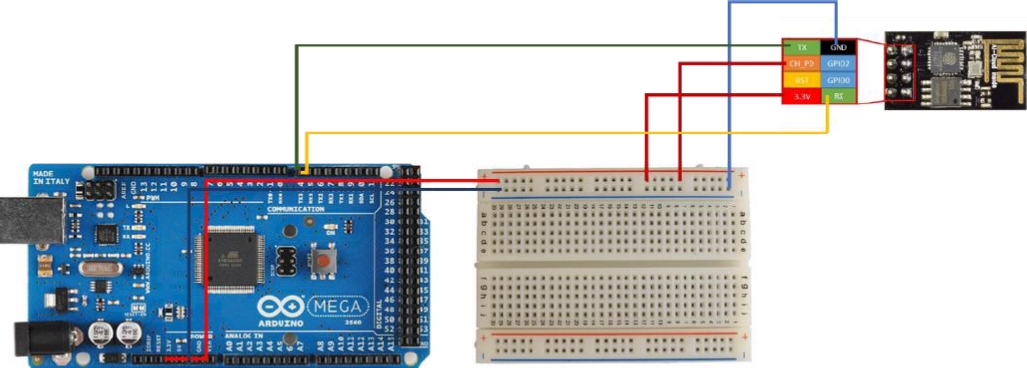
Connections Between the ESP8266 and the Arduino Board
The connection between the ESP8266 module and the arduino board is made as follows: 3.3V and CH_PD pins are connected to 3V obtained from the arduino board, GND pin is connected to ground, TX pin is connected to arduino pin D14 and RX pin is connected to arduino pin D15 as shown in Figure 3 and Table 1.
3.2 Storage Layer
The storage layer is located in a web server in the cloud, which supports programming languages from PHP server side, and a MySQL database. For the storage of the data coming from network layer, a MySQL database was developed and a web service was developed which takes the data sent by the network layer, makes the connection to the database and also insert the data in the table. The Storage layer is shown in figure 4.
The structure of table created in the storage layer is shown in table 2.
3.3 Application and Business Layer
The application layer is used to develop software applications that enable the final users to monitor the general crop conditions. The integration of the full IoT solution for final users and producers is performed in this layer. A web service was implemented for developers which uses the data generated and stored in the previous layers.
4 Sensors and Data Transmitter Module Instrumentation
The instrumentation allows monitoring 1000 m2 of greenhouse area, which can cover 1000 plants. Figure 5 shows the greenhouse sensor configuration that comprises eight temperature sensors, eight relative humidity sensors vertically located using two separate lines, a non-contact infrared temperature sensor, a light sensor, and a soil moisture sensor. There are two vertical sensor lines, each with four temperature and four relative humidity sensors. The sensor's information transmission is by a module via Category 6 8-wire shielded cable. An Arduino Mega microcontroller module receives and digitalizes the measurements. The ESP8266 transmits the information via WiFi. The experimental design is shown in Figure 5.
The installation of the sensors was carried out as follows: eight temperature sensors and eight relative humidity sensors placed vertically using two separate lines. A non-contact infrared sensor to measure plant temperature, a light sensor to measure light intensity, a soil moisture sensor to measure soil moisture percentage.
The sensors are connected to the transmitter module through a shielded 8-wire category 6 cable. The connection is as follows: The temperature and humidity sensors are grouped together (one pair at each point). There are two sensor lines one meter apart, each containing 4 temperature sensors and 4 humidity sensors for a total of 16 sensors. The 8 temperature sensors are configured to use only the arduino digital pin D13 as input, the relative humidity sensors are connected to the arduino digital inputs from D2 to D9. Both types of sensors use the same current and ground lines.
The soil moisture sensor is connected to analog input A0 and the brightness sensor is connected to analog input A1 and finally the plant temperature sensor is connected to the SDA (data) and SCL (clock) inputs. The data transmitter module is integrated by an arduino mega microcontroller, an ESP8266 module, a 3.3v and 5v power supply all embedded in a protective box. The experimental design is shown in Figure 5.
5 Lessons Learned
Among the lessons learned, it was observed that the sensors must be calibrated taking as a reference a manual measurement performed with a specialized device for that purpose. Although the data sheet mentions that the measuring devices were calibrated under strict quality standards, due to their low cost, they may present in some cases a significant margin of error. Therefore, it is considered of great importance to perform the calibration procedure.
It is important that the wiring used for the connection of sensors or actuators is of good quality to avoid the effects of crosstalk, it is recommended to use shielded cable.
The ESP8266 module is factory configured with a baud rate of 115200 baud. This configuration must be reduced to a speed of 9600 baud, since the arduino microcontroller works with SoftwareSerial, and with 115200 baud we would be at the speed limit supported by the SoftwareSerial and some packets could be lost.
Among the most important variables to generate a controlled or semi-controlled environment, temperature and relative humidity are considered.
6 Result
The experimentation with the proposed approach was performed in greenhouse with a mesh cover. In order to analyze the results obtained, two complementary actions were performed: the first is the development of an architecture for the monitoring of the environmental variables for the crop and soil. The second action was the validation of the data obtained from sensors.
The architecture for the monitoring of the environmental variables for crop and soil was developed to enables the producers to use emerging technologies that improves their competitiveness through a sustainable production.
The validation of the data coming from sensors permits to calibrate the signal of two of the sensors which presented variations in the readings. The validation permits the adjust of data with a numerical constant. This solution permits to have a constant behavior of the sensor’s readings.
The results obtained to date are a database with 20 climatic variables and approximately 350,000 records. With this database, data mining techniques can be applied to search for patterns of behavior to try to find correlations between these variables. Generating the conditions to generate predictive models that help to make better decisions. Figure 6 shows the data of two temperature variables taken outside and inside the greenhouse. It can be observed that the temperature inside the greenhouse remains higher during most of the day, being surpassed by the outside temperature approximately from 12:00 noon to 8:00 p.m.

A very important factor in relative humidity measurement is temperature. Temperature defines the water vapor saturation pressure. A small change in the temperature value, mainly at high humidity’s, has a significant effect on the relative humidity, since the water vapor saturation pressure changes as well. As can be seen in Figure 7, when the temperature increases, the relative humidity tends to decrease.

The proposed architecture is considered low-cost, taking as a reference some commercial weather stations used for research. As we can see in the description of each of the commercial stations, all of them include the basic sensors (wind speed, relative humidity, temperature and presence of rain); however, they do not include the solar radiation sensor, which is one of the most important for meteorology and when it is included it tends to increase its cost as can be seen in table 3.
Table 3 Costs of different weather stations
| No. | Description | Brand | Price Dlls |
| 1 | Proposed architecture. Sensors included: wind speed (soonhua), temperature (Elecrow) relative humidity (Generic), solar radiation (Davis Advantage Pro 2650), plant temperature (Tecneu), soil moisture (Rantec), solar panel, light intensity (tresd print tech), and internet connection. | proposed architecture | $502.98 |
| 2 | Weather station for research. Sensors included: wind speed, temperature, humidity, rainfall, atmospheric pressure, sensor array with solar panel (range up to 300 m), receiver console with display and keyboard. | Vantage Vue, 6250m Davis | $699.14 |
| 3 | Wireless weather station 6162 Vantage Pro2 Plus, Davis Instruments. Sensors included: Wind Speed, Temperature, Relative Humidity, Rainfall, Solar Radiation, Ultraviolet Radiation, Atmospheric Pressure. | Vantage Pro2 Plus, Davis 6162 | $1,755.38 |
| 4 | Wireless Weather Station Vantage Pro2 6152, Davis. Sensors included: Wind speed and direction, Rainfall, Ambient temperature and relative humidity, Atmospheric pressure, Solar panel (range up to 300 m), Receiver console with display and keypad. | Vantage Pro2 6152, Davis | $1,078.88 |
The proposed architecture has the same characteristics as a commercial weather station, even in the quality of its components, but at a price much lower than these.
7 Conclusions and Future Work
Taking advantage of the opportunity offered by the combination of low-cost hardware tools and free software, the design, implementation and deployment of a low-cost architecture supported by IoT has been achieved. It has four layers of operation comprising the sensing layer, network layer, storage layer, and application and business layer. The architecture can serve as a reference for farmers and researchers and the community interested in taking advantage of emerging IoT-based technologies to improve agricultural productivity.
The implementation of this architecture, in the first instance, is intended to serve as a reference for researchers from different disciplines to implement it, since they are easy to implement and low-cost architectures.
The proposed solution presented in this paper has advantages compared with current approaches existing in the market: 1. The components are relatively easy to get and to assemble, 2. The low cost of the sensors, microcontrollers and data transmitter, 3. The solutions considers the mechanism to stablish an internet connection for sending the data to the cloud, 4. The implementation is easy to do, and 5. The solution is very light and compact with a weight of less than 1kg. 6. The total cost of the solutions is $500.00 dollars approximately.
Although the case study was a greenhouse, the architecture is very versatile for its implementation in different areas of knowledge.
As future work, we intend to complement the application and business layer of the proposed architecture by including machine learning algorithms for the analysis of the variables involved in the calculation of evapotranspiration.

